

Abstract
Increased circulating sclerostin and accumulation of advanced glycation end-products (AGEs) are two potential mechanisms underlying low bone turnover and increased fracture risk in type 2 diabetes (T2D). Whether the expression of the sclerostin-encoding SOST gene is altered in T2D, and whether it is associated with AGEs accumulation or regulation of other bone formation-related genes is unknown. We hypothesized that AGEs accumulate and SOST gene expression is upregulated in bones from subjects with T2D, leading to downregulation of bone forming genes (RUNX2 and osteocalcin) and impaired bone microarchitecture and strength. We obtained bone tissue from femoral heads of 19 T2D postmenopausal women (mean glycated hemoglobin [HbA1c] 6.5%) and 73 age- and BMI-comparable nondiabetic women undergoing hip replacement surgery. Despite similar bone mineral density (BMD) and biomechanical properties, we found a significantly higher SOST (p = .006) and a parallel lower RUNX2 (p = .025) expression in T2D compared with non-diabetic subjects. Osteocalcin gene expression did not differ between T2D and non-diabetic subjects, as well as circulating osteocalcin and sclerostin levels. We found a 1.5-fold increase in total bone AGEs content in T2D compared with non-diabetic women (364.8 ± 78.2 versus 209.9 ± 34.4 μg quinine/g collagen, respectively; p < .001). AGEs bone content correlated with worse bone microarchitecture, including lower volumetric BMD (r = −0.633; p = .02), BV/TV (r = −0.59; p = .033) and increased trabecular separation/spacing (r = 0.624; p = .023). In conclusion, our data show that even in patients with good glycemic control, T2D affects the expression of genes controlling bone formation (SOST and RUNX2). We also found that accumulation of AGEs is associated with impaired bone microarchitecture. We provide novel insights that may help understand the mechanisms underlying bone fragility in T2D.
Keywords: BIOMECHANICS, BONE μCT, DIABETES, OSTEOBLASTS, SCLEROSTIN
Diabetes mellitus is one of the most common chronic diseases worldwide, whose prevalence has increased in parallel with the increase in obesity and changes in lifestyle.(1) Fragility fractures are important complications of both type 1 and type 2 diabetes (T1D and T2D, respectively), independent of age and sex, suggesting a strong involvement of glucose metabolism in bone homeostasis.(2) Several epidemiological studies highlighted an increased fracture risk among T2D subjects, despite normal or even higher BMD as compared with healthy controls.(3,4) This suggests abnormalities in bone quality, with bone material strength and/or bone microarchitecture likely being affected.(5,6) Alterations in bone turnover and bone cell function may contribute to impaired bone quality in diabetes. Several evidences highlighted that circulating biochemical markers of both bone formation (ie, osteocalcin, procollagen type I N-terminal propeptide [P1NP], and bone-specific alkaline phosphatase) and bone resorption such as C-terminal telopeptide of type 1 collagen (CTX) are decreased in T2D subjects, indicating that diabetes is characterized by low bone turnover.(4,7–9)
Sclerostin, a glycoprotein encoded by SOST and secreted by osteocytes, is a potent inhibitor of the canonical WNT signaling pathway and therefore a negative regulator of bone formation. Sclerostin expression progressively increases during osteocyte maturation, and higher levels were reported in osteocytes surrounded by mineralized bone.(10) We have shown that serum sclerostin is increased in T2D,(2) and tends to correlate with glucose control (glycated hemoglobin [HbA1c]) in T2D and higher vertebral marrow fat.(8,11) Moreover, some studies described a positive association between serum sclerostin and vertebral fractures in postmenopausal women with T2D compared to healthy subjects, suggesting that sclerostin plays a role in diabetes-associated bone fragility.(12) However, it is unknown if SOST gene expression is upregulated in T2D and whether other bone formation-related genes are affected.
Accumulation of advanced glycation end-products (AGEs), which are markedly increased in subjects with diabetes, may further contribute to reduced bone formation and impaired bone quality.(13) Previous studies demonstrated that AGEs accumulate in diabetes, forming nonenzymatic cross-links within type I collagen (which constitutes nearly 90% of the bone organic phase), affecting biochemical and mechanical properties of bone.(14)
Although many hypotheses have been proposed regarding the mechanisms underlying impaired bone quality and/or its mechanical properties in hyperglycemic states, how T2D contributes to fracture risk has not been fully elucidated. We sought to assess the relationship between bone microarchitecture and strength with bone AGEs content and the expression of SOST and bone forming genes (RUNX2 and osteocalcin) at the tissue level. To this aim, we evaluated the gene expression of both bone formation and WNT pathway markers in bone samples from postmenopausal women with or without T2D undergoing hip replacement surgery, and examined the association between diabetes and bone density, geometry and strength in this population.
Patients and Methods
Study subjects
Between 2015 and 2017, postmenopausal women affected by osteoarthritis who were scheduled for elective hip replacement surgery were consecutively screened for participation in this cross-sectional study. All participants provided written informed consent. The study protocol was reviewed and approved by the Ethics Committee of Campus Bio-Medico University of Rome. Diabetes diagnosis was confirmed by the treating diabetes physician and based on the 2015 American Diabetes Association criteria: fasting plasma glucose (FPG) ≥126 mg/dL or a 2-hour plasma glucose (2-hPG) ≥200 mg/dL during a 75-g oral glucose tolerance test (OGTT), or an HbA1c ≥6.5%. In the absence of unequivocal hyperglycemia, diagnosis required two abnormal test results from the same sample or in two separate test samples.(15) Exclusion criteria were as follows: age <65 years; use of medications affecting bone metabolism such as estrogen, raloxifene, tamoxifen, bisphosphonates, teriparatide, denosumab, thiazolidinediones, glucocorticoids, anabolic steroids and phenytoin. Further exclusion criteria were as follows: evidence of hypercalcemia, hypocalcemia, chronic liver disease, renal failure, hypercortisolism, malabsorption and immobilization, current alcohol or tobacco use, evidence of bone metastases or disease at the site of surgery.
Prior to surgery, participants underwent a complete physical examination and dual energy X-ray absorptiometry (DXA).
Sample preparation
Blood samples were collected in the morning after an overnight fast, before surgery, and stored at −80°C until use.
Discarded femoral head specimens were collected fresh and stored without any fixative at 4°C until procession by our study team. RNA extraction was performed from bone tissue within 24 hours after surgery. A trabecular bone specimen was sampled from the femoral head (approximately 1 × 1.5 cm) and transferred to a 50-mL tube containing sterile PBS 1X. Samples were repeatedly flushed in order to remove the marrow, vigorously vortexed, and the supernatant was discharged. We repeated the washing process at least twice and finally bone samples were snap frozen and stored at −80°C. Moreover, a trabecular core (10 mm diameter × 20 mm length) was excised from femoral head alongside the direction of the principal trabeculae(16) for compression testing. Compression tests were performed using a fresh trabecular core, without freezing and thawing. Femoral head samples were rapidly stored by our study team at −80°C until use.
Isolation of mRNA and evaluation of gene expression with RT-PCR
Total RNA was isolated using TRIzol Reagent (Invitrogen Corp., Carlsbad, CA, USA),(17) following manufacturer’s instructions, and RNA concentration was determined spectrophotometrically (InfiniteM200PRO; Tecan, Männedorf, Switzerland). The ratio of absorbance at 260 and 280 nm (A260/280) was used to assess the purity of isolated RNA. Bone tissue RNA yields ranged between 1.8 and 2. We only reverse-transcribed RNA within this range, excluding from the analysis those samples not reaching this threshold. In order to carry out the quantitative real-time RT-PCR, 1 μg of total RNA was reverse transcribed using High-Capacity cDNA Reverse Transcription Kit (Applied Biosystems, Carlsbad, CA, USA), according to product protocol (25°C for 10 min, 37°C for 2 hours, 85°C for 5 min). A further real-time RT-PCR analysis was performed using TaqMan Gene Expression Analysis Assay, with the 7900 Real-Time PCR system (Applied Biosystems) and standard cycling conditions (95°C for 10 min; 40 cycles of 95°C for 15 s and 60°C for 1 min; followed by 95°C for 15 s, 60°C for 15 s, and 95°C for 15 s). Gene expression of sclerostin (SOST; TaqMan ID Hs00228830_m1), bone formation marker osteocalcin (OCN; TaqMan ID Hs01587814_g1), and Runt related transcription factor 2 (RUNX2; TaqMan ID Hs01047973_m1) was evaluated in bone tissue biopsies. For each analysis, we used three internal controls (housekeeping genes), the most stable ones. Gene expression was normalized with ribosomal RNA18S (Hs03928985_g1), GAPDH (Hs02758991_g1), and B-ACTIN (Hs01060665_g1), and the results were analyzed using BestKeeper software tool (https://www.gene-quantification.de/bestkeeper.html).(18–20)
Bone density (DXA) and micro-computed tomography (μCT)
Lumbar spine (L1 to L4), total and neck femoral BMD were measured by DXA (QDR-4500A; Hologic, Inc., Bedford, MA, USA) at lumbar spine and proximal femur. The coefficient of variation (CV) for this technique at our center was 1.1% for the lumbar spine and 1.2% for the proximal femur. Standardized procedures and scan analysis were executed for all scans.(21)
Bone cores (8-mm in diameter and 8–10 mm in length) were harvested from the femoral head of each donor and then scanned using a benchtop μCT system (microCT 40; Scanco Medical AG, Bruttisellen, Switzerland). Voxels of 15 × 15 × 15 μm3 in dimension were obtained with an X-ray tube potential of 70 kVp, intensity of 114 mA, 1000 projections, and 300 ms integration time. To standardize the procedure, cores were obtained as close as possible to the principal trabecular loading axis of the femoral head as identified from the digital X-ray. A hydroxyapatite phantom calibration with the manufacturer’s specifications was performed weekly for this system. The trabecular bone analyses were conducted such that contours excluded the cortical bone. After contouring, trabecular bones were masked by lower and upper thresholds that partitioned a digital image into the bony regions.
Tissue mineral density (TMD) was defined as the mean of volumetric bone mineral density for all voxels assigned to the matrix (voxels with a BMD more than 600 mg HA/cm3). Standard trabecular architecture parameters were also computed including the bone volume fraction (BV/TV), connectivity density (Conn.D), trabecular number (Tb.N), trabecular spacing (Tb.Sp), and trabecular thickness (Tb.Th). Analyses were completed using by Scanco Evaluation program.
Biomechanical tests
A cylindrical specimen with a diameter of 10 mm and a length of 20 mm was obtained from each femoral head sample and biomechanical tests were performed on fresh trabecular cores. An electromechanical testing machine (Mod. 3365; Instron Corp., Canton, MA, USA) was used to perform the mechanical compression tests. Each cylindrical specimen was positioned between two compression platens onto the testing machine ensuring the alignment of the specimen with the machine axis. The impressed force was measured by a static load force cell (Instron Corp., Canton, MA, USA; Mod. 2530–447) with a force capacity of ±5 kN, linearity ±0.25% of reading and repeatability of ±0.25% of reading. The specimen strain during the test was obtained by recording the crosspiece movement, with an accuracy of ±0.02 mm2. Bluehill software (Instron Corp.) was used for controlling the compression tests, and to record the force and deformation data. The strain rate was set to 0.01 s−1. Data were recorded at 25 Hz. Young’s modulus, ultimate strength and yield strength of each specimen were obtained from the specimen strain-stress curve in MATLAB (MathWorks, version R2017b; MathWorks, Natick, MA, USA). Young’s modulus was obtained as the slope of the linear part of the calculated stress-strain curve.(22) We used the ultimate strength to calculate the maximum load and stress required to initiate the plastic deformation of bone, while the yield strength was the minimum load or stress required to maintain the plastic behavior of bone.(23)
Measurement of AGEs in bone
Pieces of trabecular bone (approximately 4 × 4 × 4 mm3 in volume) were isolated from the surgical specimens of a subset of five diabetics and 15 nondiabetics. The samples were first demineralized using ethylenediaminetetra acetic acid (EDTA), enzymatically homogenized using papain (5 μg/mL, 65°C for 18 hours), and then finally hydrolyzed in 12 N hydrochloric acid (12 N HCl, 120°C for 3 hours). The samples were then centrifuged, and the supernatant collected and then plated in triplicate with quinine sulfate standards. Fluorescence emission was read at a wavelength of 440 nm with an excitation wavelength of 370 nm using a microplate photometer (SpectraMax M2; Molecular Devices, Sunnyvale, CA, USA). The AGEs content was then normalized to the amount of collagen present in each sample, which was quantified using a chloramine T colorimetric assay and standardized to hydroxyproline.(24,25)
Biochemical analyses
Fasting morning blood samples were analyzed by standard methods for the evaluation of glucose, calcium, creatinine, and serum urea. Serum concentration of sclerostin was performed with enzyme immunoassay (Biomedica GmbH, Vienna, Austria). The determination of serum undercarboxylated osteocalcin (Glu-OCN) and of carboxylated fraction (Gla-OCN) was carried out through commercially available standard immunoassay (Takara Bio Inc., Shiga, Japan), according to the manufacturer’s protocol.
Statistical analyses
Data were analyzed using R 3.6.1 (R Foundation for Statistical Computing, Vienna, Austria; https://www.r-project.org/). Patients’ characteristics were described using means and standard deviations (SDs) or medians and interquartile ranges (IQRs), as appropriate, and percentages. Student’s t test or the Wilcoxon rank-sum test were used as appropriate to compare variables between groups. When variables were not normally distributed, we used a logarithmic transformation. Pearson’s correlation coefficients were used to assess the relationship between variables.
Results
Subject characteristics
A total of 92 postmenopausal women scheduled for elective hip replacement surgery were enrolled (19 T2D subjects and 73 nondiabetic controls). Demographic and clinical characteristics of subjects are presented in Table 1. Nondiabetic and T2D subjects had similar age, BMI, and age at menopause (Table 1). Mean disease duration in diabetic subjects was 14.6 ± 9.8 years (mean ± SD). HbA1c was collected in all T2D subjects within 3 months before surgery and on average was 6.5% ± 1.7% (Table 1). Diabetes medications used by T2D subjects included monotherapy with metformin (n = 11), combination therapy with metformin plus insulin and glinide (n = 5), or combination therapy with metformin plus glinide (n = 3).
Table 1.
Demographic and Clinical Features of the Study Subjects
| Characteristic | Nondiabetic subjects (n = 73) | T2D subjects (n = 19) | p |
|---|---|---|---|
| Age (years) | 73.2 ± 5.8 | 75.2 ± 8.5 | NS |
| BMI (kg/m2) | 27.7 ± 5.6 | 29.9 ± 5.4 | NS |
| Menopausal age (years) | 49.3 ± 5.2 | 48.9 ± 5.9 | NS |
| Pregnancies (n) | 2.0 ± 1.2 | 2.5 ± 1.3 | NS |
| Disease duration (years) | – | 14.6 ± 9.8 | – |
| Fasting plasma glucose (mg/dL) | 100.7 ± 11.21 | 120.1 ± 21.5 | .002 |
| HbA1c (%) | – | 6.5 ± 1.7 | – |
| Serum calcium (mg/dL) | 9.2 ± 0.4 | 9.3 ± 0.5 | NS |
| Creatinine (mg/dL) | 0.76 ± 0.16 | 0.83 ± 0.25 | NS |
| Serum blood urea nitrogen (mg/dL) | 41.5 ± 11.5 | 48. ± 15.6 | NS |
Data are presented as mean ± SD.
NS = not statistically significant.
As expected, T2D subjects showed significantly higher fasting blood glucose compared to controls (120.1 ± 21.5 mg/dL versus 100.7 ± 11.21 mg/dL, respectively, p = .002) (Table 1).
Bone gene expression and serum markers
We analyzed gene expression at bone level, of the WNT pathway inhibitor SOST, the bone forming transcriptional factor RUNX2, and the bone matrix protein OCN. Then, circulating levels of sclerostin and OCN (Gla-OCN and Glu-OCN) were also measured. Gene expression results, expressed in logarithmic scale, are shown in Fig. 1. SOST gene expression in the bone of 53 analyzed subjects (15 T2D subjects and 38 nondiabetics) revealed significantly higher mRNA levels in T2D subjects versus nondiabetics (p = .006, Fig. 1A), even independently of age and BMI (p = .007).
Fig 1.
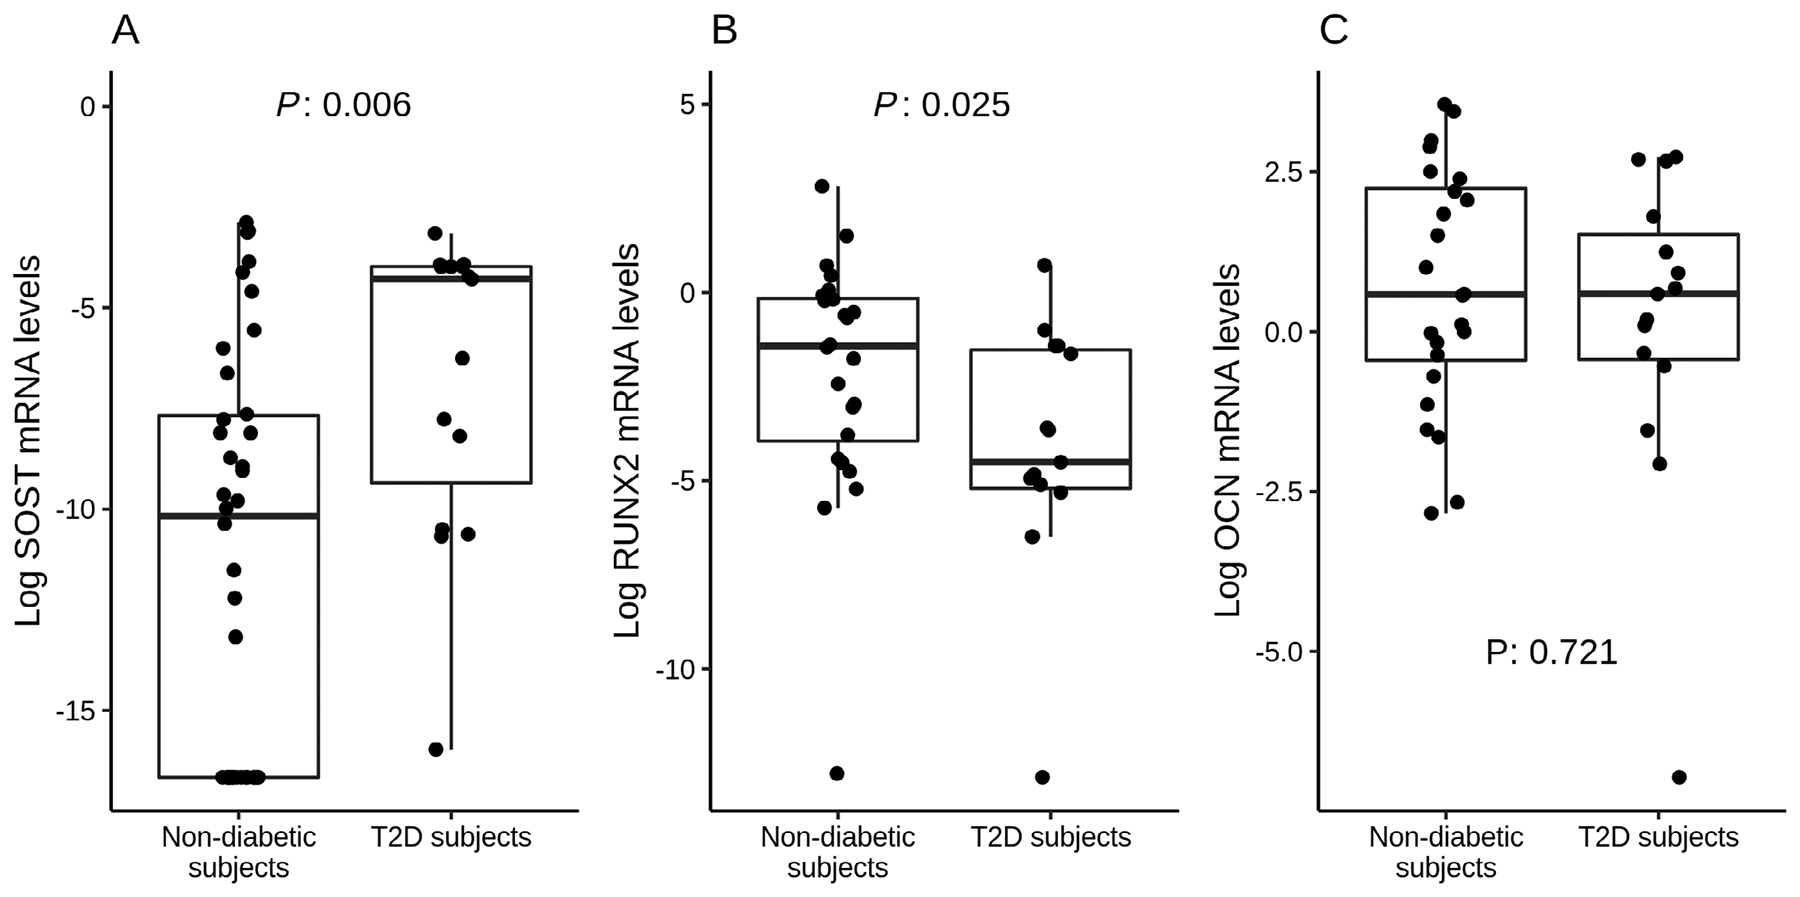
Gene expression analyses in bone samples. Data are expressed as logarithmic scale medians and interquartile ranges for non-diabetics and T2D subjects. (A) SOST mRNA levels resulted higher in T2D subjects versus nondiabetics (p = .006), even independently of age and BMI (p = .007). (B) RUNX2 gene expression was lower in T2D subjects versus nondiabetics (p = .025). (C) OCN levels were not different between groups (p = .72).
When we analyzed bone gene expression of RUNX2 and OCN in a total number of 39 enrolled subjects (15 T2D subjects and 24 nondiabetic controls), we found that RUNX2 mRNA levels were lower in T2D subjects versus controls (p = .025, Fig. 1B).
Finally, OCN gene expression did not differ between T2D subjects and nondiabetics (p = .721, Fig. 1C).
Circulating levels of both Gla-OCN and Glu-OCN were not different between T2D subjects and nondiabetics. Gla-OCN was 14.1 ± 5.2 ng/mL in nondiabetics versus 14.9 ± 6.0 ng/mL in T2D subjects, whereas Glu-OCN was 3.3 ± 2.9 ng/mL in nondiabetics versus 2.96 ± 1.79 ng/mL in T2D subjects (p = .88). Sclerostin was higher in T2D subjects, but this difference was not significant (28.5 ± 3.2 pmol/L versus 22.8 ± 1.4 pmol/L; p = .25).
Bone density and bone microarchitecture
Based on femoral BMD by DXA interpreted according to the World Health Organization (WHO) criteria,(26) 32.1% of nondiabetic and 50% of T2D subjects were osteopenic (T-score between −1.0 SD and −2.5 SD), while 3.6% and 0% were osteoporotic (T-score less than −2.5 SD), respectively. Comparison of BMD at lumbar spine and hip BMD (neck and total) showed no significant differences among T2D and nondiabetic subjects (Table 2).
Table 2.
Bone Density, Bone Microarchitecture, and Biomechanical Parameters in Nondiabetic and T2D Subjects
| Parameter | Nondiabetic subjects | T2D subjects | p |
|---|---|---|---|
| Dual-energy X-ray absorptiometry | |||
| BMD lumbar L1 + L4 (g/cm2) | 0.92 ± 0.17 | 0.95 ± 0.12 | .43 |
| Lumbar T-score (SD) | −1.15 ± 1.43 | −0.83 ± 1.14 | .44 |
| BMD femoral total (g/cm2) | 0.79 ± 0.11 | 0.82 ± 0.09 | .39 |
| BMD femoral neck (g/cm2) | 0.68 ± 0.12 | 0.66 ± 0.11 | .62 |
| Femoral T-score (SD) | −1.36 ± 0.87 | −0.98 ± 0.75 | .27 |
| Microcomputed tomography | |||
| BV/TV | 0.26 ± 0.10 | 0.24 ± 0.14 | .54 |
| Connectivity (1/mm3) | 6.75 ± 2.41 | 6.99 ± 4.25 | .89 |
| Trabecular number (1/mm) | 1.59 ± 0.37 | 1.48 ± 0.5 | .49 |
| Trabecular thickness (mm) | 0.2 ± 0.08 | 0.2 ± 0.05 | .98 |
| Trabecular separation (mm) | 0.61 ± 0.15 | 0.71 ± 0.2 | .14 |
| Volumetric BMD (mgHA/cm3) | 243.0 ± 74.8 | 220.4 ± 100.2 | .48 |
| Tissue mineral density (mgHA/cm3) | 685.5 ± 29.51 | 689.36 ± 32.8 | .65 |
| Biomechanical properties | |||
| Young’s modulus (MPa) | 58.93 ± 52.39 | 43.16 ± 55.91 | .4 |
| Ultimate strength (MPa) | 5.38 ± 3.12 | 8.17 ± 10.51 | .97 |
| Yield strength (MPa) | 4.87 ± 2.64 | 3.78 ± 3.40 | .13 |
Data are presented as mean ± SD.
According to microarchitecture assessment by μCT on bone core samples, T2D and nondiabetic subjects had similar trabecular indices, including bone volume density (BV/TV), connectivity, mean trabecular thickness, trabecular number, trabecular separation, tissue mineral density, and volumetric BMD.
AGEs and biomechanical tests in bone sample cores
We found a significant 1.5-fold increase in total fluorescent AGEs in T2D subjects (n = 5) compared to nondiabetic ones (n = 15) (364.8 ± 78.2 μg quinine/g collagen versus 209.9 ± 34.4 μg quinine/g collagen; p < .001) (Fig. 2).
Fig 2.
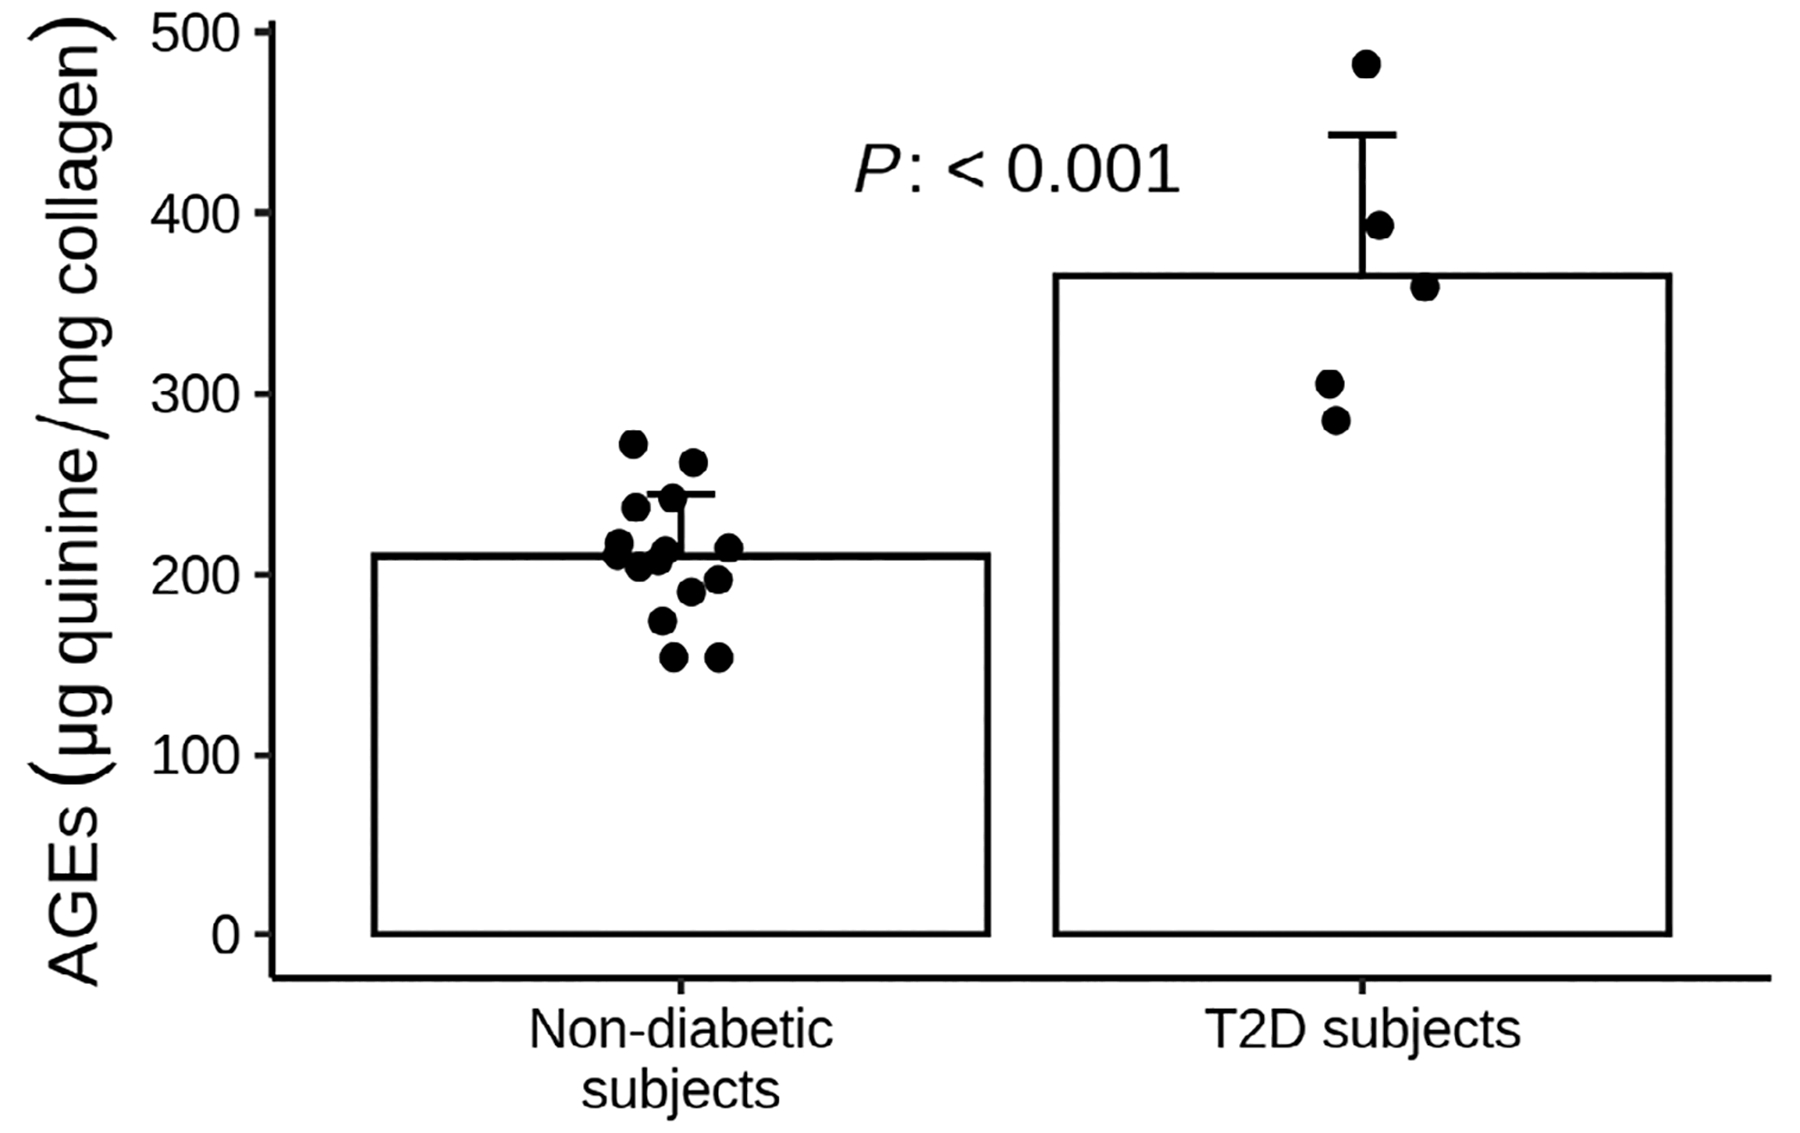
AGEs content in bone samples of nondiabetic (dark gray bar) and T2D subjects (light gray bar). Data are expressed as mean ± SE. T2D (n = 5) had higher AGEs bone content compared to nondiabetics (n = 15) (364.8 ± 78.2 μg quinine/g collagen versus 209.9 ± 34.4 μg quinine/g collagen, respectively, p < .001).
Correlation analysis, including both T2D and nondiabetic subjects, showed that AGEs were negatively correlated with volumetric BMD and BV/TV, and positively correlated with trabecular separation and spacing (Fig. 3A–C).
Fig 3.
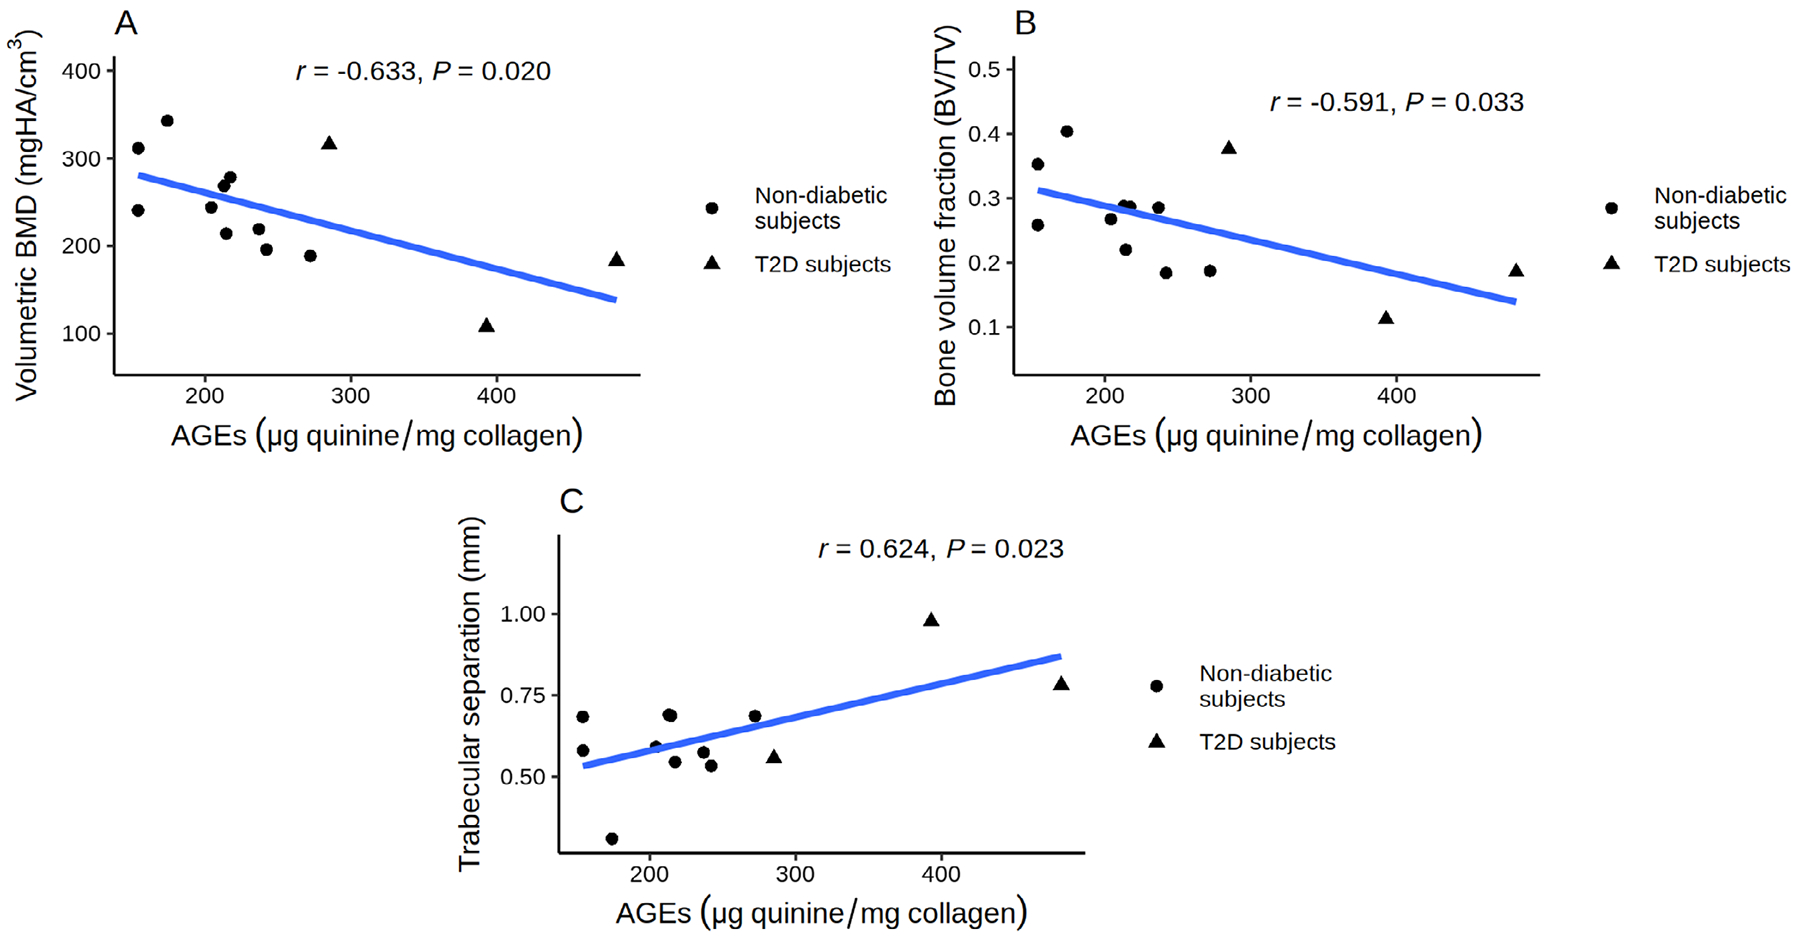
Relationship between AGEs content and bone microarchitecture in T2D and nondiabetic subjects: AGEs were negatively correlated with volumetric BMD (A) and BV/TV (B), and positively correlated with trabecular separation and spacing (C).
Young’s modulus, upper yield strength and lower yield strength values were compared between T2D and nondiabetic subjects. Results were not different between T2D and nondiabetic subjects (Table 2).
Relationship between HbA1c, bone microarchitecture/strength, and AGEs
We performed a Pearson’s analysis to assess correlations between HbA1c values collected before surgery and bone parameters obtained by μCT and biomechanical tests. No significant correlations were found between HbA1c and measures of bone strength or microarchitecture parameters. Moreover, HbA1c did not correlate with bone AGEs (data not shown).
Discussion
In the present study, we showed for the first time that T2D patients exhibit lower bone gene expression of bone forming transcriptional factor RUNX2, and upregulated gene expression of the WNT pathway inhibitor SOST. Furthermore, AGEs accumulation was increased in T2D bone compared to nondiabetic bone. Our data strengthen the hypothesis that reduced bone formation in T2D is associated with dysregulated Wnt–β-catenin signaling pathway, particularly with increases in SOST gene expression. Of note, diabetic patients in our study had well-controlled T2D, suggesting that pathways of bone formation in T2D may be impaired despite good glycemic control.
Previous data have shown that diabetes is characterized by low bone turnover and increased serum sclerostin levels.(7,9,27) For the first time, we provide evidence that, in bones from subjects with T2D, the expression of genes involved in the regulation of bone formation is altered. Furthermore, direct analysis of bone specimens showed an increase in bone AGE content.
Accumulation of AGEs in bone might upregulate SOST, which encodes for sclerostin and reduce the expression of RUNX2, a key regulator of bone formation. It is also possible that AGE-associated SOST upregulation mediates transcriptional changes that precede a decrease in bone formation (RUNX2 downregulation); prior to bone density, bone microarchitecture and strength are affected. Our findings here are consistent with prior work that AGEs do not directly impair bone density and strength.(25) It is not clear if AGEs accumulation depends on glucose control or disease duration. In this light, osteocytes and sclerostin are likely to play a central role in the pathophysiology of bone fragility in T2D. Osteocytes are the most abundant cell type in the adult skeleton, where they orchestrate bone remodeling by regulating osteoblast and osteoclast activity.(28) It is possible that chronic hyperglycemia and subsequent AGEs accumulation directly affect osteocytes, leading to an increase in sclerostin levels that in turn inhibits bone formation. Importantly, all this process may occur even in well controlled T2D patients, as was evident in our subjects. In fact, the majority of our T2D subjects were on monotherapy with oral hypoglycemic medications despite a long disease duration. Preclinical studies showed that both high glucose and AGEs significantly increase the expression of sclerostin protein and mRNA by osteocyte-like MLO-Y4 cells, possibly by increasing TGF-β or TNF-α, although the underlying mechanisms are still poorly elucidated.(29–31) In clinical studies, circulating sclerostin is almost invariably elevated in hyperglycemic states such as prediabetes, T1D, and T2D.(32) Furthermore, studies in animal models showed that RUNX2 expression declined after exposure to AGEs, this effect being dependent on sclerostin regulation, as treatment with an anti-sclerostin antibody restored RUNX2 expression.(31) Similarly, a decrease in osteoprogenitor proliferation paralleled a decline in RUNX2 expression in aged ovariectomized rats. RUNX2 gene expression was re-established after the treatment with an anti-sclerostin antibody, indicating sclerostin regulation of RUNX2 gene expression.(33) Finally, our data are in agreement with the observations of Manavalan and colleagues,(34) who found that RUNX2 is downregulated in T2D subjects, although this finding was based on analysis of circulating cells expressing bone-related proteins (OCN+/CD146+ cells), and not from the direct analysis of bone tissue. Although we found lower RUNX2 expression,(35) osteocalcin gene expression was not significantly different between T2D and nondiabetic subjects. Serum undercarboxylated osteocalcin (Glu-OCN) did not differ between groups, in agreement with gene expression results. Previous studies that assessed circulating osteocalcin in subjects with T2D yielded conflicting findings, with osteocalcin levels either normal or reduced.(32)
Measurement of total AGEs in bone showed a significant 1.5-fold increase in T2D compared to nondiabetic subjects. This finding is important, because it reveals that even patients with well-controlled T2D present higher levels of AGEs as compared to nondiabetic subjects. AGE formation and deposition occurs over time, and are not affected by short-term changes in glycemic control. Mean duration of disease in T2D subjects was nearly 15 years; therefore, it is possible that AGEs deposition in bone had occurred in earlier stages of disease. With respect to total AGEs content in bone, Hunt and colleagues(36) reported higher levels of pentosidine (a biomarker for AGEs cross-links in collagen) and sugar matrix, and no differences in total fluorescent AGEs in T2D bone. Karim and colleagues(37) showed that total fluorescent AGEs in cortical bone were ~20% higher in T2D subjects than controls although there were no differences in the trabecula cores. These differences might be due to differences in gender, age of study participants (we enrolled only elderly postmenopausal women, whereas participants in previous studies were younger and mainly male) and, maybe even more relevant, diabetes duration, which was not reported in previous studies but may be an important determinant of total AGEs content.
Our data are in agreement with those from Karim and colleagues,(37) who found no significant differences in biomechanical properties in bone samples from diabetics versus nondiabetics, except for a trend for lower Young’s modulus in the diabetic group. Hunt and colleagues(36) showed a greater tissue mineral content at the femoral neck and increased Young’s modulus, yield stress, and ultimate stress in T2D subjects versus nondiabetics. Previous clinical studies have shown that T2D may be associated with lower bone strength, as estimated by nanoindentation(38) or pQCT.(39) Differences with our study may be related to the different clinical features of the study population or the use of indirect estimates of bone strength in previous studies, whereas our observations originate from direct evaluation on the tissue using compressive tests.
Bone density and bone microarchitecture analyses, obtained on bone specimens by DXA and μCT, respectively, showed no differences between T2D subjects versus nondiabetics, confirming previous data in larger human cohorts.(13,37,40) Moreover, our results are in line with data of trabecular microarchitectural properties reported by Karim and colleagues(37) and Hunt and colleagues.(36) Treating bone fragility in diabetics is challenging,(41) and our data may reveal SOST as a possible target. Although other anabolic treatments like teriparatide have shown positive effects in subjects with diabetes,(42) more clinical data will be needed to confirm if targeting WNT signaling will improve fracture risk in diabetics.
Our study has some limitations, such as the number of T2D subjects recruited, and lack of separation of cortical versus trabecular bone cores. AGEs were available only in a subset of subjects and we could not differentiate between cortical and trabecular bone compartments; therefore, cortical porosity could not be quantified. It is possible that with a larger sample size would have found a significant increase in serum sclerostin in diabetics. Although sclerostin may be involved in the pathogenesis of osteoarthritis,(43) it is unlikely that this condition significantly interfered with our findings because all study subjects were affected with osteoarthritis, suggesting that differences in SOST gene expression were linked to diabetes status. More studies using other osteogenic markers will be needed to confirm the role of WNT signaling in bone fragility in diabetics.
A strength of our study is the use of bone specimens from T2D patients, which allowed direct analysis of local gene expression, microarchitectural, compositional, and biomechanical features.
In conclusion, our data show that, despite good glycemic control, T2D is associated with alterations in the expression of genes involved in the regulation of bone formation (upregulation of sclerostin and downregulation of RUNX2) that may partly explain the reduced bone formation in T2D. We also found that T2D was associated with increased AGEs accumulation but no changes in BMD, strength, or microarchitectural parameters. Our data contribute to the understanding of the pathophysiology of diabetes-related bone fragility, but also highlight its complexity.
Acknowledgments
This study was supported by a Campus Bio-Medico University strategic grant.
Footnotes
Disclosures
All authors declare that they have no potential conflicts of interest relevant to this work.
References
- 1.Unnikrishnan R, Pradeepa R, Joshi SR, Mohan V. Type 2 diabetes: demystifying the global epidemic. Diabetes. 2017;66(6):1432–42. [DOI] [PubMed] [Google Scholar]
- 2.Napoli N, Chandran M, Pierroz DD, et al. Mechanisms of diabetes mellitus-induced bone fragility. Nat Rev Endocrinol. 2017;13(4): 208–19. [DOI] [PubMed] [Google Scholar]
- 3.Napoli N, Schwartz AV, Schafer AL, et al. Vertebral fracture risk in diabetic elderly men: the MrOS study. J Bone Miner Res. 2018;33(1):63–9. [DOI] [PMC free article] [PubMed] [Google Scholar]
- 4.Rubin MR, Patsch JM. Assessment of bone turnover and bone quality in type 2 diabetic bone disease: current concepts and future directions. Bone Res. 2016;4:16001. [DOI] [PMC free article] [PubMed] [Google Scholar]
- 5.Conte C, Epstein S, Napoli N. Insulin resistance and bone: a biological partnership. Acta Diabetol. 2018;55(4):305–14. [DOI] [PubMed] [Google Scholar]
- 6.Russo GT, Giandalia A, Romeo EL, et al. Fracture risk in type 2 diabetes: current perspectives and gender differences. Int J Endocrinol. 2016;2016:161735. [DOI] [PMC free article] [PubMed] [Google Scholar]
- 7.Hygum K, Starup-Linde J, Harslof T, Vestergaard P, Langdahl BL. Mechanisms in endocrinology: diabetes mellitus, a state of low bone turnover—a systematic review and meta-analysis. Eur J Endocrinol. 2017;176(3):R137–57. [DOI] [PubMed] [Google Scholar]
- 8.Starup-Linde J, Lykkeboe S, Gregersen S, et al. Differences in biochemical bone markers by diabetes type and the impact of glucose. Bone. 2016;83:149–55. [DOI] [PubMed] [Google Scholar]
- 9.Starup-Linde J, Vestergaard P. Biochemical bone turnover markers in diabetes mellitus—a systematic review. Bone. 2016;82:69–78. [DOI] [PubMed] [Google Scholar]
- 10.Delgado-Calle J, Sato AY, Bellido T. Role and mechanism of action of sclerostin in bone. Bone. 2017;96:29–37. [DOI] [PMC free article] [PubMed] [Google Scholar]
- 11.Ma YH, Schwartz AV, Sigurdsson S, et al. Circulating sclerostin associated with vertebral bone marrow fat in older men but not women. J Clin Endocrinol Metab. 2014;99(12):E2584–90. [DOI] [PMC free article] [PubMed] [Google Scholar]
- 12.Black DM, Rosen CJ. Clinical practice. postmenopausal osteoporosis. N Engl J Med. 2016;374(3):254–62. [DOI] [PubMed] [Google Scholar]
- 13.Furst JR, Bandeira LC, Fan WW, et al. Advanced glycation endproducts and bone material strength in type 2 diabetes. J Clin Endocrinol Metab. 2016;101(6):2502–10. [DOI] [PMC free article] [PubMed] [Google Scholar]
- 14.Rubin MR. Skeletal fragility in diabetes. Ann N Y Acad Sci. 2017;1402(1):18–30. [DOI] [PubMed] [Google Scholar]
- 15.American Diabetes Association. 2. Classification and diagnosis of diabetes. Diabetes Care. 2015;38(Suppl):S8–16. [DOI] [PubMed] [Google Scholar]
- 16.Ohman C, Baleani M, Perilli E, et al. Mechanical testing of cancellous bone from the femoral head: experimental errors due to off-axis measurements. J Biomech. 2007;40(11):2426–33. [DOI] [PubMed] [Google Scholar]
- 17.Rio DC, Ares M Jr, Hannon GJ, Nilsen TW. Purification of RNA using TRIzol (TRI reagent). Cold Spring Harb Protoc. 2010;2010(6):pdb prot5439. [DOI] [PubMed] [Google Scholar]
- 18.Huggett J, Dheda K, Bustin S, Zumla A. Real-time RT-PCR normalisation; strategies and considerations. Genes Immun. 2005;6(4):279–84. [DOI] [PubMed] [Google Scholar]
- 19.Nolan T, Hands RE, Bustin SA. Quantification of mRNA using real-time RT-PCR. Nat Protoc. 2006;1(3):1559–82. [DOI] [PubMed] [Google Scholar]
- 20.Wang Q, Ishikawa T, Michiue T, Zhu BL, Guan DW, Maeda H. Stability of endogenous reference genes in postmortem human brains for normalization of quantitative real-time PCR data: comprehensive evaluation using geNorm, NormFinder, and BestKeeper. Int J Leg Med. 2012;126(6):943–52. [DOI] [PubMed] [Google Scholar]
- 21.Samelson EJ, Demissie S, Cupples LA, et al. Diabetes and deficits in cortical bone density, microarchitecture, and bone size: Framingham HR-pQCT study. J Bone Miner Res. 2018;33(1):54–62. [DOI] [PMC free article] [PubMed] [Google Scholar]
- 22.Ciarelli TE, Fyhrie DP, Schaffler MB, Goldstein SA. Variations in threedimensional cancellous bone architecture of the proximal femur in female hip fractures and in controls. J Bone Miner Res. 2000;15(1): 32–40. [DOI] [PubMed] [Google Scholar]
- 23.Wolfram U, Schwiedrzik J. Post-yield and failure properties of cortical bone. Bonekey Rep. 2016;5:829. [DOI] [PMC free article] [PubMed] [Google Scholar]
- 24.Abraham AC, Agarwalla A, Yadavalli A, McAndrew C, Liu JY, Tang SY. Multiscale predictors of femoral neck in situ strength in aging women: contributions of BMD, cortical porosity, reference point indentation, and nonenzymatic glycation. J Bone Miner Res. 2015;30(12):2207–14. [DOI] [PMC free article] [PubMed] [Google Scholar]
- 25.Tang SY, Zeenath U, Vashishth D. Effects of non-enzymatic glycation on cancellous bone fragility. Bone. 2007;40(4):1144–51. [DOI] [PMC free article] [PubMed] [Google Scholar]
- 26.World Health Organization. WHO Scientific Group on the assessment of osteoporosis at primary health care level. Summary Meeting Report Brussels, Belgium, 5–7 May 2004 [Internet]. Geneva, Switzerland: World Health Organization; 2007. [cited 2020 Apr 12]. Available at: https://www.who.int/chp/topics/Osteoporosis.pdf. [Google Scholar]
- 27.Starup-Linde J, Eriksen SA, Lykkeboe S, Handberg A, Vestergaard P. Biochemical markers of bone turnover in diabetes patients—a meta-analysis, and a methodological study on the effects of glucose on bone markers. Osteoporos Int. 2014;25(6):1697–708. [DOI] [PubMed] [Google Scholar]
- 28.Boyce BF, Yao Z, Xing L. Osteoclasts have multiple roles in bone in addition to bone resorption. Crit Rev Eukaryot Gene Expr. 2009;19(3):171–80. [DOI] [PMC free article] [PubMed] [Google Scholar]
- 29.Miranda C, Giner M, Montoya MJ, Vazquez MA, Miranda MJ, Perez-Cano R. Influence of high glucose and advanced glycation endproducts (ages) levels in human osteoblast-like cells gene expression. BMC Musculoskelet Disord. 2016;17:377. [DOI] [PMC free article] [PubMed] [Google Scholar]
- 30.Notsu M, Kanazawa I, Takeno A, et al. Advanced glycation end product 3 (AGE3) increases apoptosis and the expression of sclerostin by stimulating TGF-beta expression and secretion in osteocyte-like MLO-Y4-A2 cells. Calcif Tissue Int. 2017;100(4):402–11. [DOI] [PubMed] [Google Scholar]
- 31.Sakamoto E, Kido JI, Takagi R, et al. Advanced glycation end-product 2 and porphyromonas gingivalis lipopolysaccharide increase sclerostin expression in mouse osteocyte-like cells. Bone. 2019;122:22–30. [DOI] [PubMed] [Google Scholar]
- 32.Costantini S, Conte C. Bone health in diabetes and prediabetes. World J Diabetes. 2019;10(8):421–45. [DOI] [PMC free article] [PubMed] [Google Scholar]
- 33.Boyce RW, Brown D, Felx M, et al. Decreased osteoprogenitor proliferation precedes attenuation of cancellous bone formation in ovariectomized rats treated with sclerostin antibody. Bone Rep. 2018; 8:90–4. [DOI] [PMC free article] [PubMed] [Google Scholar]
- 34.Manavalan JS, Cremers S, Dempster DW, et al. Circulating osteogenic precursor cells in type 2 diabetes mellitus. J Clin Endocrinol Metab. 2012;97(9):3240–50. [DOI] [PMC free article] [PubMed] [Google Scholar]
- 35.Atashi F, Modarressi A, Pepper MS. The role of reactive oxygen species in mesenchymal stem cell adipogenic and osteogenic differentiation: a review. Stem Cells Dev. 2015;24(10):1150–63. [DOI] [PMC free article] [PubMed] [Google Scholar]
- 36.Hunt H, Torres A, Palomino P, et al. Altered tissue composition, microarchitecture, and mechanical performance in cancellous bone from men with type 2 diabetes mellitus. J Bone Miner Res. 2019;34(7): 1191–206. [DOI] [PMC free article] [PubMed] [Google Scholar]
- 37.Karim L, Moulton J, Van Vliet M, et al. Bone microarchitecture, biomechanical properties, and advanced glycation end-products in the proximal femur of adults with type 2 diabetes. Bone. 2018;114:32–9. [DOI] [PMC free article] [PubMed] [Google Scholar]
- 38.Farr JN, Khosla S. Determinants of bone strength and quality in diabetes mellitus in humans. Bone. 2016;82:28–34. [DOI] [PMC free article] [PubMed] [Google Scholar]
- 39.Petit MA, Paudel ML, Taylor BC, et al. Bone mass and strength in older men with type 2 diabetes: the Osteoporotic Fractures in Men Study. J Bone Miner Res. 2010;25(2):285–91. [DOI] [PMC free article] [PubMed] [Google Scholar]
- 40.Samelson EJ, Demissie S, Cupples LA, et al. Diabetes and deficits in cortical bone density, microarchitecture, and bone size: Framingham HR-pQCT study. J Bone Miner Res. 2018;33(1):54–62. [DOI] [PMC free article] [PubMed] [Google Scholar]
- 41.Ferrari SL, Abrahamsen B, Napoli N, et al. Diagnosis and management of bone fragility in diabetes: an emerging challenge. Osteoporos Int. 2018;29(12):2585–96. [DOI] [PMC free article] [PubMed] [Google Scholar]
- 42.Langdahl BL, Silverman S, Fujiwara S, et al. Real-world effectiveness of teriparatide on fracture reduction in patients with osteoporosis and comorbidities or risk factors for fractures: integrated analysis of 4 prospective observational studies. Bone. 2018;116:58–66. [DOI] [PubMed] [Google Scholar]
- 43.Weivoda MM, Youssef SJ, Oursler MJ. Sclerostin expression and functions beyond the osteocyte. Bone. 2017;96:45–50. [DOI] [PMC free article] [PubMed] [Google Scholar]