

Abstract
Objective
To assess whether patient socioeconomic status (SES) moderates the effectiveness of coordinated specialty care for first‐episode psychosis and to investigate possible mechanisms.
Data Sources
A secondary analysis of data from the RAISE‐ETP Trial, which was conducted from 2010‐2014.
Study Design
RAISE‐ETP was a cluster‐randomized trial comparing a coordinated specialty care (CSC) intervention called NAVIGATE with usual community care. We constructed a patient SES index based on parental education, parental occupational prestige, and race/ethnicity. After identifying correlates of SES, we used OLS regression analysis to estimate treatment effects on the major study outcomes across quartiles of the index. We also examined whether correlates of SES including the duration of untreated psychosis (DUP), and participation in NAVIGATE might account for the observed difference in effectiveness of CSC by SES.
Principal Findings
The trial sample had a similar SES distribution to the US population, and SES was positively correlated with all mental health outcomes and several potential moderators at baseline. CSC substantially improved the main trial outcomes compared to community care for patients in the highest SES quartile but had small and statistically insignificant benefits for the remaining 75% of patients. Intervention participation rates and several potential moderators did not explain this disparity.
Conclusions
CSC may be more effective for high‐SES patients with early psychosis than low‐SES patients. Additional research is needed to understand why CSC is less effective for low‐SES patients and to develop methods to increase effectiveness for this subgroup.
Keywords: health status disparities, psychotic disorders, schizophrenia, social class, socioeconomic factors
What This Study Adds.
Although patient socioeconomic status (SES) may influence the effectiveness of psychiatric treatment through several channels, few studies in psychiatry or other fields examine the role of SES as a moderator.
The RAISE‐ETP trial found moderate effects of coordinated specialty care (CSC) on quality of life and psychosis symptoms.
We show that CSC substantially improved the main trial outcomes for patients in the top 25% of the SES distribution but had small and statistically insignificant benefits for the remaining 75% of patients.
Additional research is needed to understand why CSC is less effective for low‐SES patients and to increase effectiveness for this subgroup.
1. INTRODUCTION
Schizophrenia is a severe psychotic disorder and a leading cause of disability worldwide. The disorder typically develops during late adolescence or early adulthood and often leads to decades of disability, severe psychological distress, social isolation, suicidality, as well as substance abuse, unemployment, reliance on public assistance, and homelessness.
Recent studies have raised hope that early, intensive treatment can moderate the course of this illness by reducing symptoms and improving functioning. 1 The RAISE‐ETP trial, the largest, longest US‐based test of this approach, was a cluster‐randomized evaluation (N = 404 at 34 sites) comparing a coordinated specialty care (CSC) intervention called NAVIGATE to standard community care (CC) for patients with first‐episode psychosis (FEP). The trial showed that NAVIGATE improved quality of life, reduced psychosis symptoms, and was cost effective. 2
Through the secondary analysis of clinical trials, researchers can identify moderators that indicate which patients benefit the most from treatment and therefore should be sure to receive it, and which patients benefit less, and may need a modified version of the intervention. Studies of the moderators in clinical trials typically focus on known prognostic factors. 3 To date, the duration of untreated psychosis (DUP) is the only significant moderator identified in the RAISE‐ETP trial, with virtually all clinical benefits accruing to patients with below‐median DUP. 2
Patient socioeconomic status (SES) is a complex concept that is challenging to measure and has not been commonly studied as a moderator of intervention effectiveness in medical research. 4 The moderating role of SES may help illuminate persistent mental health disparities and high rates of psychiatric disability among low‐SES patients. 5 For example, low‐SES psychiatric patients may have worse medication adherence, more severe symptoms, poorer cognition, less social and community support, and more serious substance abuse disorders, any one of which could reduce the effectiveness of CSC and other psychiatric interventions. 6
This study examined whether SES is a significant moderator of the effectiveness of CSC for FEP in the RAISE‐ETP trial. We first developed an SES index using available data on parental education, parental occupational prestige, and race/ethnicity and validated the index by comparing the SES distribution in the RAISE‐ETP sample with the nationally representative sample in the General Social Survey (GSS). Next we examined whether SES moderates the treatment effects of CSC on the Heinrichs‐Carpenter Quality of Life Scale (QLS) (the primary outcome of the original trial), the Positive and Negative Syndrome Scale (PANSS), and the Calgary Depression Scale for Schizophrenia. 7 , 8 , 9 We further assessed whether baseline characteristics such as DUP, substance use, illness severity, and current economic and educational circumstances of patients were correlated with SES and might account for the socioeconomic gradient in treatment effectiveness.
2. METHODS
The RAISE‐ETP study is part of the National Institute of Mental Health (NIMH) RAISE initiative. Details of the study, 10 the clinical intervention, participant characteristics, and two‐year clinical outcomes have been previously reported. 2
2.1. Intervention
NAVIGATE included four components: (1) personalized medication management; (2) family psycho‐education; (3) individual, resilience‐focused illness self‐management therapy; and (4) supported education and employment. 11 To offer personalized medication management, providers actively monitored symptoms and side effects in order to optimize each patient's medication regimen. Individual resiliency training, a form of cognitive behavioral therapy, involved weekly or biweekly therapy sessions. Family psycho‐education involved 10‐12 sessions that attempted to help families understand psychosis, overcome stigma, and create a supportive home environment. In the supported employment and education component, counselors helped patients to set and achieve realistic work and school goals with in vivo supports.
The control arm of the trial received “Community Care” (CC), which consisted of “the routine treatment offered by that clinic for such patients, with no additional training or supervision provided by the central team, except in relationship to retention in the research follow‐up.” 2 Researchers demonstrated robust differences between NAVIGATE and CC in implementation and service delivery and systematically monitored fidelity of NAVIGATE to existing evidence‐based models of treatment. 2 , 12
2.2. Subjects and sites
From July 2010 to July 2012, researchers recruited a total of 404 subjects, aged 15‐40, who presented for treatment with FEP and had taken antipsychotic medication for fewer than six (lifetime) months. A CONSORT diagram of the recruitment process has been published previously. 2 Following a national invitation and selection process, the study team recruited 34 clinical sites located in 21 US states. Sites were randomly assigned to offer NAVIGATE or CC. These criteria led to 223 patients in the NAVIGATE arm and 181 patients in the CC arm. Researchers obtained written informed consent from adult participants and the legal guardians of participants under 18 years old. The study was approved by the institutional review boards of the coordinating center and the participating sites. The NIMH Data and Safety Monitoring Board also oversaw the intervention.
2.3. Outcomes
The primary outcome of the RAISE‐ETP trial was the Heinrichs‐Carpenter Quality of Life Scale (QLS), 9 , 10 a 21‐item scale with higher scores indicating better quality of life. The main symptom measure was the Positive and Negative Syndrome Scale (PANSS) a widely used 30‐item assessment of schizophrenia symptom severity. 7 Researchers also administered the Calgary Depression Scale for Schizophrenia, a nine‐item self‐reported scale distinguishing between depression symptoms and psychosis symptoms that might mimic depression. 8 Trained live interviewers conducted the QLS and PANSS assessments through two‐way live video conferencing while local research assistants administered the Calgary Scale. We constructed z‐scores for each of these outcomes by subtracting each outcome observation from the sample mean and dividing by the sample standard deviation during the follow‐up period.
2.4. Socioeconomic status
A baseline survey elicited information on parental education and occupational prestige. We used these variables and race/ethnicity to construct an SES index. Maternal and paternal education had nine possible responses that ranged from “no schooling” to “completed advanced degree.” Occupational prestige had eight possible responses that ranged from “unskilled employee” to “major professional,” following the 1970 US Census occupation codes. 13 These variables provide the basis for constructing the Hollingshead Index of Social Position. 14 Despite its widespread use in epidemiology, social scientists have criticized this index because it employs arbitrary weights and does not account for race or ethnicity. 15 In addition, data on maternal characteristics were missing for 20% of patients and data on paternal characteristics were missing for 30% of patients. In many of these cases, the parent was absent from the home or the patient was unaware of this information. Race/ethnicity categories included white, African American, Hispanic, and “other race” (Native American, Asian, and Hawaiian or Pacific Islander). Following other studies of race/ethnicity, we coded respondents of any race as Hispanic if they indicate Hispanic ethnicity.
We defined the SES index to be the first principal component of variables reflecting parental education, occupational prestige, and race. Principal component analysis is a widely used data‐reduction technique that extracts the common variation from a set of correlated variables. 16 The SES index provides a way to collapse multiple correlated SES dimensions into a single variable. Although some researchers view race/ethnicity as conceptually distinct from SES, we included this dimension in the index as another proxy to help reduce measurement error. 16 We did not include the respondent's own education or occupational prestige because serious mental disorders often disrupt the schooling and employment of young adults. Parental SES is thus a better proxy for the patient's pre‐illness socioeconomic background. The index incorporated indicators that the father or mother was absent from the household or data were otherwise unavailable. For clarity, we normalized the index to have a mean of zero and a standard deviation of one. Our analysis ranks patients by SES and divides them into quartiles in order to estimate the intervention impact for each SES quartile.
2.5. Moderators that may be correlated with SES
SES may indirectly moderate the impact of NAVIGATE if it is correlated with other factors that directly influence the effectiveness of treatment. For factors that have a significant SES gradient, we further investigated whether they contributed to differential observed treatment effects by SES. Available moderators (all of which were measured at baseline) included the following: (a) Measures of initial mental health status included the baseline PANSS, Clinical Global Impression, and Calgary scores, as well as the DUP. (b) Measures of patient school enrollment, employment, and insurance status, which might affect instrumental functioning and access to health services. (c) Cognition, which may affect communication and receptivity with health care providers, was assessed with the Brief Assessment of Cognition in Schizophrenia (BACS). 17 (d) Substance abuse may also interfere with the treatment participation. We measured lifetime and current (past 30 days) use of alcohol, marijuana, and other drugs, as well as the frequency of use. (e) Medication attitudes and stigma were evaluated with the seven‐item Stigma Scale 18 and the four‐item Brief Evaluation of Medication Influences and Beliefs. 19 (f) Family support, which promotes life stability, 20 was assessed with four relevant items from the Burden Assessment Scale for Families of the Seriously Mentally Ill. 21
2.6. Analysis plan
The analysis proceeded in several steps. First, we used principal component analysis to develop a measure of SES based on parental education, employment, and race.
Next, we compared the SES distribution in the trial sample to the 2010 GSS, a nationally representative survey, in order to gauge the SES variation in the trial sample. Although race/ethnicity and parental education are measured comparably across these datasets, the GSS does not measure parental occupational prestige. For a like‐to‐like comparison of SES across the RAISE‐ETP and GSS datasets, we computed an alternative SES index for both samples that omitted parental occupational prestige. We then compared these distributions visually and using the Kolmogorov‐Smirnov test to assess whether differences were statistically significant. 22
We then examined the relationship between SES quartiles and baseline demographic and clinical characteristics, including the potential moderators identified in Section 2.5.
Our main analysis estimated heterogeneous treatment effects across levels of patient SES using ordinary least squares (OLS) regression analysis. We pooled the data from the 6‐, 12‐, 18‐, and 24‐month follow‐up assessments and interacted the treatment indicator with a full set of SES quartile indicators, so that each estimate provides the treatment effect (ie, the mean difference between NAVIGATE and CC) in standardized (z‐score) units for each SES quartile. This approach is an alternative to a regression with a main effect of treatment and a treatment‐SES interaction. Round indicators controlled for possible time trends in the outcome variables, and a vector of baseline covariates improved precision by reducing the error variance. Since RAISE‐ETP is a cluster‐randomized trial, we clustered standard errors by site throughout the analysis to address possibly correlated errors across patients over time and at a common site. This clustering technique, which allows for multi‐level error correlations, is a statistical alternative to nested hierarchical modeling. 23 Since a comparison of baseline characteristics showed some imbalances between NAVIGATE and CC, 2 we estimated the treatment propensity by regressing assignment to treatment on the socioeconomic and demographic variables in Table 1 using a logistic regression. We then applied entropy weights to the CC arm so that the NAVIGATE and CC arms had the same treatment propensities after weighting. 24
TABLE 1.
Baseline characteristics by socioeconomic status
| SES quartile | Significance | ||||
|---|---|---|---|---|---|
| Q1 | Q2 | Q3 | Q4 | ||
| (1) | (2) | (3) | (4) | (5) | |
| SES index components | |||||
| Education of mother (1‐9) | 4.8 | 5.1 | 5.6 | 7.0 | *** |
| Education of father (1‐9) | 5.0 | 5.1 | 5.5 | 6.7 | *** |
| Occupational prestige of mother (1‐8) | 3.7 | 3.8 | 4.9 | 6.3 | *** |
| Occupational prestige of father (1‐8) | 4.1 | 3.9 | 4.3 | 5.9 | *** |
| Black (%) | 49 | 29 | 17 | 7 | *** |
| Hispanic (%) | 40 | 36 | 16 | 16 | * |
| White (%) | 10 | 33 | 61 | 65 | *** |
| Other race (%) | 1 | 2 | 6 | 11 | * |
| Mental health | |||||
| Heinrichs‐Carpenter QLS (Std.) | −0.47 | −0.15 | 0.25 | 0.23 | *** |
| PANSS Total Score (Std.) | 0.46 | −0.15 | −0.05 | −0.18 | *** |
| Calgary Depression Scale (Std.) | 0.23 | −0.13 | −0.07 | −0.03 | |
| Duration of untreated psychosis | 8.2 | 7.8 | 4.9 | 3.3 | *** |
| Demographics | |||||
| Male (%) | 75 | 75 | 80 | 83 | |
| Age | 23.8 | 24.1 | 22.8 | 22.8 | |
| Patient Education (1‐9) | 4.5 | 4.8 | 5.0 | 5.7 | *** |
| Married (%) | 3 | 13 | 7 | 2 | ** |
| Receives SSI or SSDI (%) | 7 | 7 | 8 | 8 | |
| Private Health Insurance (%) | 9 | 12 | 27 | 44 | *** |
| Employment (%) | 7 | 11 | 15 | 13 | |
| Weekly earnings ($) | 12.6 | 21.7 | 39.9 | 20.6 | |
| School enrollment (%) | 11 | 12 | 22 | 13 | |
| Potential moderators | |||||
| Cognition Index | −0.45 | −0.31 | 0.21 | 0.60 | *** |
| Substance use Index | −0.09 | 0.08 | 0.01 | −0.01 | |
| Medication attitudes/stigma index | 0.03 | 0.19 | 0.09 | −0.04 | |
| Family Support Index | −0.44 | −0.09 | 0.03 | −0.28 | * |
| Number of patients | 102 | 100 | 102 | 100 | |
The table reports the mean of each variable within each SES quartile, incorporating entropy weights as described in the text. Column 5 tests whether the means in Columns 1‐4 are jointly significantly different. The QLS, PANSS, and Calgary Depression Scale are standardized by subtracting the mean and dividing by the standard deviation at baseline.
P < .1
P < .05
P < .01.
Next to assess whether any of the factors described above contribute to the socioeconomic gradient in the impact of NAVIGATE relative to CC, we examined whether controlling for treatment effect heterogeneity associated with these factors attenuates the treatment effect heterogeneity observed for SES. For instance, if high‐SES patients respond more to treatment because they happen to have milder initial symptoms, controlling for treatment effect heterogeneity by initial mental health status should attenuate our estimate of treatment effect heterogeneity by SES. This exercise is distinct from a Baron‐Kenny mediation analysis because SES and all of the factors above are pre‐determined at baseline and do not change over time. We also assessed whether differences in the use of the four key NAVIGATE services might account for differences in outcomes by SES quartile.
3. RESULTS
3.1. Socioeconomic status
Figure 1 plots the probability density function of our primary version of this index, which is computed within the RAISE‐ETP sample using all available socioeconomic variables. The distribution is approximately bell shaped.
FIGURE 1.
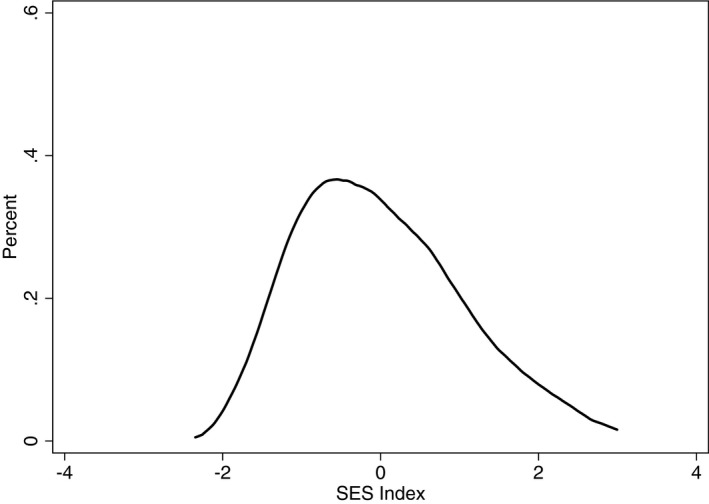
The SES density of the RAISE‐etp sample using all available SES components
A visual comparison of the SES densities in the RAISE sample (solid lines in Figure 2) and the GSS sample (dashed lines in Figure 2) shows that the SES distributions of these samples largely overlap. While the Kolmogorov‐Smirnov test leads us to reject statistical equality between these distributions (P < .02), this finding demonstrates that the SES distribution of the trial sample differs only minimally from the SES distribution of the broader population. A comparison of the black and gray lines in Figure 2 shows that computing the SES index within the GSS rather than the RAISE‐ETP sample shifts the index to the right in both samples but leads to a similar conclusion about similarity of the SES distributions in the two samples. These alternatives have a minimal effect on the classification of individuals into high‐SES and low‐SES groups.
FIGURE 2.
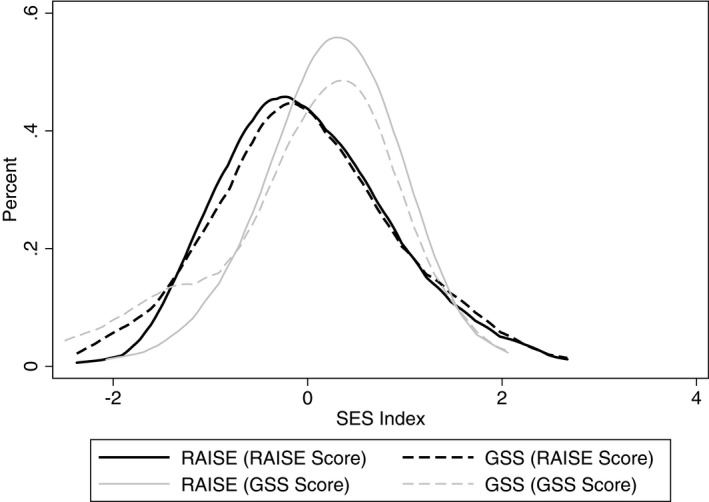
SES density comparison of the RAISE‐ETP and GSS samples (omitting parental occupational prestige)
Table 1 summarizes the characteristics of patients by quartile of the SES distribution. Columns 1‐4 provide the mean of each variable within each SES quartile, while Column 5 indicates the statistical significance of a joint comparison of means. The SES Index was strongly associated with all of its components, as one would expect by definition. Table 1 also demonstrates a strong SES gradient in mental health status and quality of life, which are reported as z‐scores in the table. The gap between SES Quartile 1 and SES Quartile 4 was 0.7 standard deviations for the QLS, 0.64 standard deviations for the PANSS, and 0.26 standard deviations for Calgary. The duration of untreated psychosis was 4.9 months shorter in Quartile 4 than in Quartile 1.
Table 1 also identifies which potential moderators vary with SES. Although several patient‐level economic variables were not strongly correlated with SES (employment, weekly earnings, school enrollment), high‐SES patients had substantially more access to private health insurance, performed much better on cognitive tests, and had somewhat stronger family support (although patients in SES Quartile 3 had the largest values of the family support index). SES was not correlated with the substance use or medication attitudes and stigma.
Table A1 in the Appendix S1 compares the baseline characteristics of the NAVIGATE and CC arms before and after reweighting.
3.2. SES moderates the impact of CSC
Our primary regression estimates appear in Table 2, which provides SES quartile‐specific treatment effects. Standard errors (clustered by clinical site) appear below the treatment effect estimates. In the first row of Table 2 (Columns 1, 3 and 5), NAVIGATE improved the QLS by 0.37 standard deviations (P = .03), reduced PANSS by 0.45 standard deviations (P = .002), and reduced the Calgary Depression Scale by 0.71 standard deviations (P < 0.001) for patients in the highest SES quartile. The intervention had several other notable but imprecise and statistically insignificant impacts. It improved QLS by 0.22 standard deviations in SES Quartile 3 and reduced Calgary scores by 0.33 standard deviations in SES Quartile 2. It had detrimental but insignificant effects on all outcomes for SES Quartile 1, reducing QLS by 0.19 standard deviations, increasing PANSS by 0.12 standard deviations, and increasing Calgary scores by 0.10 standard deviations for this group. The magnitude of other impacts was small.
TABLE 2.
Treatment effects on study outcomes by SES quartile
| QLS | PANSS | Calgary | ||||
|---|---|---|---|---|---|---|
| (1) | (2) | (3) | (4) | (5) | (6) | |
| Standardized treatment effect | ||||||
| SES Quartile 4 | 0.367** (0.162) | 0.320 (0.191) | −0.445*** (0.119) | −0.425*** (0.127) | −0.713*** (0.175) | −0.771*** (0.158) |
| SES Quartile 3 | 0.220 (0.170) | 0.252 (0.184) | 0.0248 (0.184) | 0.00419 (0.162) | −0.00174 (0.121) | 0.0742 (0.129) |
| SES Quartile 2 | −0.010 (0.156) | −0.0249 (0.156) | −0.00367 (0.187) | −0.152 (0.176) | −0.289 (0.217) | −0.326 (0.203) |
| SES Quartile 1 | −0.194 (0.209) | −0.280 (0.222) | 0.120 (0.223) | 0.130 (0.212) | 0.101 (0.262) | 0.178 (0.256) |
| Equality of effects (P‐value) | .13 | .22 | .02 | .05 | .03 | .00 |
| Control for T × Covariates | No | Yes | No | Yes | No | Yes |
| Observations | 955 | 955 | 955 | 955 | 955 | 955 |
Each column presents one regression with a fully interacted specification to estimate SES quartile‐specific effects. All outcome variables are standardized by subtracting the follow‐up mean and dividing by the follow‐up standard deviation. Site‐clustered standard errors appear in parentheses. All regressions control for round indicators and use entropy weights. Even columns control for the interaction of treatment with baseline mental health, employment, cognition, and family support variables.
P < .1.
P < .05.
P < .01.
The table also assesses the heterogeneity across SES quartiles through a joint Wald test of coefficient equality. The differential impact of NAVIGATE on QLS for high‐SES patients was not statistically significant by this test (P = .18), however the differential impacts on the PANSS and Calgary scores were significant (P = .02 and P = .04 respectively). Table A2 in the Appendix S1 shows results using an alternative SES index that omits race/ethnicity.
3.3. The contributions of related moderators
Next, we assessed whether any characteristics significantly related to SES in Table 1 could account for the heterogeneous impact of NAVIGATE across SES quartiles. Table 1 indicates that initial mental health indicators (including DUP), health insurance status, and family support were correlated with SES. To examine how these factors influenced estimates by SES quartile, Columns 2, 4, and 6 of Table 2 control for these characteristics and the interaction of these characteristics with treatment. In each case, including these controls did not substantially change our finding that NAVIGATE was differentially effective for high‐SES patients. In addition, Table A3 in the Appendix S1 provides all coefficient estimates associated with Table 2. In Columns 2, 4, and 6, DUP was not a significant moderator of the impact of NAVIGATE conditional on the other covariates in the regressions.
3.4. Levels of program participation
Table 3 examines participation rates in the four NAVIGATE components by SES within the NAVIGATE arm. The table computes the percent of offered service contacts that were utilized by patient and month, and Column 5 tests whether rates differ significantly across SES quartiles. While P = .02 for individual resiliency training and P = .09 for family psycho‐education, several participation dimensions were actually highest in Quartile 3, which is not consistent with the modest treatment effect for this group. These patterns make it unlikely that SES differences in NAVIGATE participation explain the disparate mental health impact by SES.
TABLE 3.
NAVIGATE program participation by SES quartile within the CSC arm
|
SES Quartile 1 |
SES Quartile 2 |
SES Quartile 3 |
SES Quartile 4 |
P‐value | |
|---|---|---|---|---|---|
| (1) | (2) | (3) | (4) | (5) | |
| Individual resiliency training | 53 | 57 | 67 | 64 | .02 |
| Individualized medication management | 53 | 54 | 55 | 57 | .99 |
| Supported education and employment | 14 | 20 | 18 | 22 | .54 |
| Family psycho‐education | 25 | 32 | 37 | 29 | .09 |
| Percent of services utilized | 36 | 41 | 44 | 43 | .25 |
The table shows the participation in the NAVIGATE intervention contacts by SES quartile within the treatment group. We compute rates by individual and month. Column 5 tests whether rates differ significantly across quartiles. P‐values are based on regressions with site‐clustered standard errors.
4. DISCUSSION
This study demonstrates a strongly positive socioeconomic gradient in the effectiveness of coordinated specialty care for FEP within the RAISE‐ETP study. Our SES index incorporates information about parental education, parental occupational prestige, and race/ethnicity. We validated this measure through a comparison to a representative US sample and then compared the NAVIGATE CSC intervention to Community Care across SES levels to assess impacts on the QLS, the PANSS, and the Calgary Depression Scale. We found that NAVIGATE had large and significant benefits on all three outcomes for patients in the highest SES quartile but had no significant treatment effects for the remaining 75% of patients. Although SES was correlated with several potential moderators of treatment effectiveness (including DUP), these correlations did not explain the differential effectiveness of CSC for high‐SES patients. Moreover in contrast to Kane et al, 2 we did not find that DUP was a significant moderator of the effectiveness of treatment. Differences between our respective empirical approaches or the included covariates might explain this difference.
Multiple epidemiological studies have identified low SES as a risk factor for schizophrenia and for mental illness more broadly. 25 Research has found that low SES is both a cause and is a consequence of mental illness. Epidemiological studies suggest that people with low SES have greater exposure to diverse environmental psychosocial stress factors that may trigger subsequent psychosis. After the onset of illness, low‐SES may exacerbate illness by limiting access to high‐quality mental health care. 26 Psychiatric treatment may also be less effective for low‐SES patients for any of several reasons, as we explore here. The optimal policy and clinical responses to mental health disparities depends on the relative contributions of these channels.
Few studies have examined how SES may moderate the effectiveness of psychiatric care, and these papers primarily focus on race and ethnicity. 7 Pooling across mental illnesses, some studies, unlike ours, find that enhanced treatments have greater benefit for disadvantaged minorities 27 , 28 , 29 or that SES is uncorrelated with treatment effectiveness. 30 , 31 Among the studies aligning with our findings, one showed that an injectable antipsychotic treatment was more effective on substance use outcomes for white patients, 32 while another found that low‐SES patients in the Netherlands responded poorly to anxiety treatment. 33
We are unable to pinpoint a single reason why CSC was differentially effective for high‐SES patients. Trial participants were generally young and remained attached to their families of origin. High‐SES patients were likely to have access to various additional psychosocial and material resources that might enable a stronger response to treatment. 34 For instance, high‐SES patients might have access to more flexible work and educational opportunities, additional high‐quality medical care, and more resilient support networks, although the trial data did not allow us to explore these hypotheses.
Our results suggest that despite the promising findings of the RAISE‐ETP trial, CSC may not necessarily be effective for low‐SES patients. Research describes the particular challenges that arise when treating low‐SES patients, who may experience elevated stress and may prioritize immediate concerns over receiving psychiatric treatment. Providers should be flexible about appointment schedules, reach out intensively during initial engagement, and remain culturally sensitive when interfacing with low‐SES patients. 35
We acknowledge several limitations of this analysis. Like most clinical trials, the RAISE study was not designed to examine heterogeneous treatment effects by SES. The impact disparity is only statistically significant because it happens to be large. Since the SES components were highly correlated (for instance ρ = 0.50 between mother's and father's education), we could not distinguish their separate contributions with the trial sample size. The treatment‐control imbalance in patient characteristics may weaken the internal validity of the study by casting doubt on the randomness of the treatment assignment. However the use of entropy weights minimized this concern for our analysis. External validity also remains a concern for any small‐sample trial, despite the similarity of the RAISE and GSS SES distributions.
SES is not commonly studied as a potential moderator of clinical effectiveness in the treatment of psychosis or other mental disorders. Future research should use richer data to explore this relationship in other contexts and should seek to identify the underlying reasons why CSC may be differentially effective for high‐SES patients. For instance, a trial design that randomized patients to receive specific NAVIGATE components would allow researchers to explore which components (or combinations of components) have the largest impacts for which patients.
The primary RAISE‐ETP studies suggest that CSC is a promising approach to FEP treatment. 2 Our findings suggest that high‐SES patients benefitted the most from NAVIGATE. More focused research is needed to better understand the circumstances under which CSC is most effective.
Supporting information
Author matrix
Appendix S1
ACKNOWLEDGMENT
Joint Acknowledgment/Disclosure Statement: Research reported in this publication was supported in part by the National Institute of Mental Health. The content is solely the responsibility of the authors and does not necessarily represent the official view of the National Institutes of Health.
Disclosures: none.
Bennett D, Rosenheck R. Socioeconomic status and the effectiveness of treatment for first‐episode psychosis. Health Serv Res.2021;56:409–417. 10.1111/1475-6773.13606
Contributor Information
Daniel Bennett, Email: bennettd@usc.edu.
Robert Rosenheck, Email: robert.rosenheck@yale.edu.
REFERENCES
- 1. Correll CU, Galling B, Pawar A, et al. Comparison of early intervention services vs treatment as usual for early‐phase psychosis: a systematic review, meta‐analysis, and meta‐regression. JAMA Psychiatry. 2018;75(6):555‐565. [DOI] [PMC free article] [PubMed] [Google Scholar]
- 2. Kane J, Robinson D, Schooler N, et al. Comprehensive versus usual community care for first‐episode psychosis: 2‐year outcomes from the NIMH RAISE Early Treatment Program. Am J Psychiatry. 2016;173(4):362‐372. [DOI] [PMC free article] [PubMed] [Google Scholar]
- 3. Gabler NB, Duan N, Liao D, Elmore JG, Ganiats TG, Kravitz RL. Dealing with heterogeneity of treatment effects: is the literature up to the challenge? Trials. 2009;10(1):43. [DOI] [PMC free article] [PubMed] [Google Scholar]
- 4. Callahan JL, Heath CJ, Aubuchon‐Endsley NL, Collins FL Jr, Herbert GL. Enhancing information pertaining to client characteristics to facilitate evidence‐based practice. J Clin Psychol. 2013;69(12):1239‐1249. [DOI] [PubMed] [Google Scholar]
- 5. Arpey NC, Gaglioti AH, Rosenbaum ME. How socioeconomic status affects patient perceptions of health care: a qualitative study. J Primary Care Commun Health. 2017;8(3):169‐175. [DOI] [PMC free article] [PubMed] [Google Scholar]
- 6. Marshall M, Lewis S, Lockwood A, Drake R, Jones P, Croudace T. Association between duration of untreated psychosis and outcome in cohorts of first‐episode patients. Arch Gen Psychiatry. 2005;62:976‐983. [DOI] [PubMed] [Google Scholar]
- 7. Kay SR, Fiszbein A, Opfer LA. The positive and negative syndrome scale (PANSS) for schizophrenia. Schizophr Bull. 1987;13(2):261‐276. [DOI] [PubMed] [Google Scholar]
- 8. Addington D, Addington J, Atkinson M. A psychometric comparison of the Calgary Depression Scale for Schizophrenia and the Hamilton Depression Rating Scale. Schizophr Res. 1996;19:205‐212. [DOI] [PubMed] [Google Scholar]
- 9. Heinrichs DW, Hanlon TE, Carpenter WT Jr. The Quality of Life Scale: an instrument for rating the schizophrenic deficit syndrome. Schizophr Bull. 1984;10(3):388‐398. [DOI] [PubMed] [Google Scholar]
- 10. Kane J, Schooler N, Marcy P, et al. The RAISE Early Treatment Program for First Episode Psychosis: background, rationale, and study design. J Clin Psychiatry. 2015r;76(3):240‐246. [DOI] [PMC free article] [PubMed] [Google Scholar]
- 11. Abdi H, Williams LJ. Principal component analysis. Wiley Interdiscipl Rev Comput Stat. 2010;2(4):433‐459. [Google Scholar]
- 12. Mueser KT, Meyer‐Kalos PS, Glynn SM, et al. Implementation and fidelity assessment of the NAVIGATE treatment program for first episode psychosis in a multi‐site study. Schizophr Res. 2019;204:271‐281. [DOI] [PMC free article] [PubMed] [Google Scholar]
- 13. Cirino PT, Chin CE, Sevcik RA, Wolf M, Lovett M, Morris RD. Measuring socioeconomic status: reliability and preliminary validity for different approaches. Assessment. 2002;9(2):145‐155. [DOI] [PubMed] [Google Scholar]
- 14. Hollingshead A.Four Factor Index of Social Status; 1975. Unpublished manuscript.
- 15. Mueller CW, Parcel TL. Measures of socioeconomic status: alternatives and recommendations. Child Develop; 1981;52(1):13‐30. [Google Scholar]
- 16. Hellton KH, Thoresen M. The impact of measurement error on principal component analysis. Scand J Stat. 2014;41(4):1051‐1063. [Google Scholar]
- 17. Keefe R, Goldberg T, Harvey P, Gold J, Poe M, Coughenour L. The Brief Assessment of Cognition in Schizophrenia: reliability, sensitivity, and comparison with a standard neurocognitive battery. Schizophr Res. 2004;68:283‐297. [DOI] [PubMed] [Google Scholar]
- 18. King M, Dinos S, Shaw J, et al. The Stigma Scale: development of a standardised measure of the stigma of mental illness. Br J Psychiatry. 2007;190(3):248‐254. [DOI] [PubMed] [Google Scholar]
- 19. Dolder CR, Lacro JP, Warren KA, Golshan S, Perkins DO, Jeste DV. Brief evaluation of medication influences and beliefs: development and testing of a brief scale for medication adherence. J Clin Psychopharmacol. 2004;24(4):404‐409. [DOI] [PubMed] [Google Scholar]
- 20. Rabinovitch M, Cassidy C, Schmitz N, Joober R, Malla A. The influence of perceived social support on medication adherence in first‐episode psychosis. Can J Psychiatr. 2013;58(1):59‐65. [DOI] [PubMed] [Google Scholar]
- 21. Reinhard SC, Gubman GD, Horwitz AV, Minsky S. Burden assessment scale for families of the seriously mentally ill. Evaluat Progr Plan. 1994;17(3):261‐269. [Google Scholar]
- 22. Smirnov NV. Estimate of deviation between empirical distribution functions in two independent samples. Bull Moscow Univ. 1939;2(2):3‐16. [Google Scholar]
- 23. Moen EL, Fricano‐Kugler CJ, Luikart BW, O’Malley AJ. Analyzing Clustered data: why and how to account for multiple observations nested within a study participant? PLoS One. 2016;11(1):e0146721. [DOI] [PMC free article] [PubMed] [Google Scholar]
- 24. Hainmueller J. Entropy balancing for causal effects: a multivariate reweighting method to produce balanced samples in observational studies. Polit Anal. 2012;20:25‐45. [Google Scholar]
- 25. Sareen J, Afifi T, McMillan K, Asmundson G. Relationship between household income and mental disorder. Arch Gen Psychiatry. 2011;68(4):419‐427. [DOI] [PubMed] [Google Scholar]
- 26. Miranda J, McGuire TG, Williams DR, Wang P. Mental health in the context of health disparities. Am J Psychiatry. 2008;165(9):1102‐1108. [DOI] [PubMed] [Google Scholar]
- 27. Miranda J, Duan N, Sherbourne C, et al. Improving care for minorities: can quality improvement interventions improve care and outcomes for depressed minorities? Results of a randomized, controlled trial. Health Serv Res. 2003;38(2):613‐630. [DOI] [PMC free article] [PubMed] [Google Scholar]
- 28. Ngo VK, Asarnow JR, Lange J, et al. Outcomes for youths from racial‐ethnic minority groups in a quality improvement intervention for depression treatment. Psychiatr Serv. 2009;60(10):1357‐1364. [DOI] [PMC free article] [PubMed] [Google Scholar]
- 29. Arnold JG, Salcedo S, Ketter TA, et al. An exploratory study of responses to low‐dose lithium in African Americans and Hispanics. J Affect Disord. 2015;178:224‐228. [DOI] [PMC free article] [PubMed] [Google Scholar]
- 30. Miranda J, Schoenbaum M, Sherbourne C, Duan N, Wells K. Effects of primary care depression treatment on minority patients’ clinical status and employment. Arch Gen Psychiatry. 2004;61(8):827‐834. [DOI] [PubMed] [Google Scholar]
- 31. Roy‐Byrne P, Sherbourne C, Miranda J, et al. Poverty and response to treatment among panic disorder patients in primary care. Am J Psychiatry. 2006;163(8):1419‐1425. [DOI] [PubMed] [Google Scholar]
- 32. Leatherman SM, Liang MH, Krystal JH, et al. Differences in treatment effect among clinical subgroups in a randomized clinical trial of long‐acting injectable risperidone and oral antipsychotics in unstable chronic schizophrenia. J Nerv Ment Dis. 2014;202(1):13‐17. [DOI] [PubMed] [Google Scholar]
- 33. Schat A, Van Noorden M, Noom M, et al. Predictors of outcome in outpatients with anxiety disorders: the Leiden routine outcome monitoring study. J Psychiatr Res. 2013;47(12):1876‐1885. [DOI] [PubMed] [Google Scholar]
- 34. Woolf SH, Braveman P. Where health disparities begin: the role of social and economic determinants and why current policies may make matters worse. Health Aff. 2011;30(10):1852‐1859. [DOI] [PubMed] [Google Scholar]
- 35. Santiago CD, Kaltman S, Miranda J. Poverty and mental health: how do low‐income adults and children fare in psychotherapy? J Clin Psychol. 2013;69(2):115‐126. [DOI] [PubMed] [Google Scholar]
Associated Data
This section collects any data citations, data availability statements, or supplementary materials included in this article.
Supplementary Materials
Author matrix
Appendix S1