Figure 4. The number of exogenous, movement-unrelated ‘visual’ spikes to occur intra-saccadically linearly added to the executed movement’s amplitude.
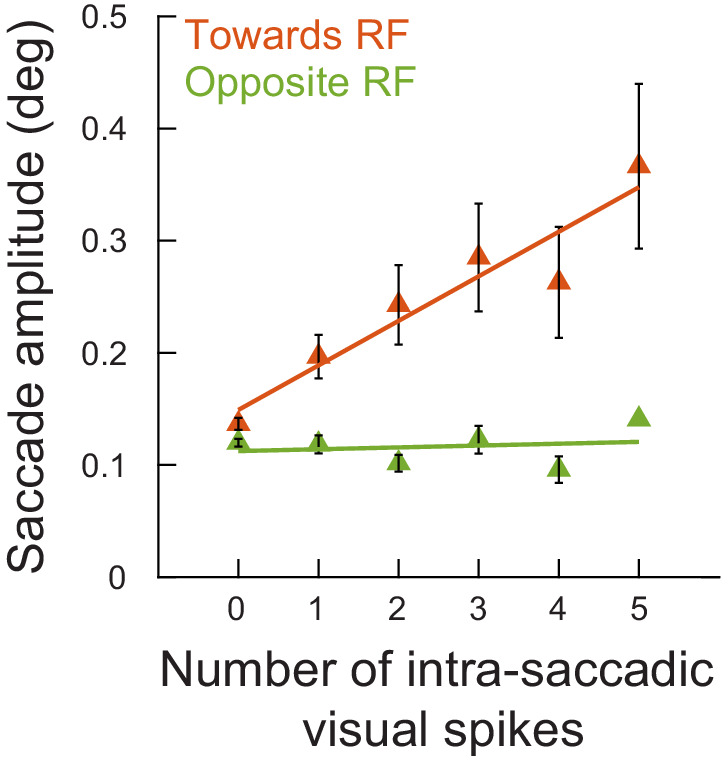
(A) For every recorded neuron from experiment 1 (Figure 3A,B) and every microsaccade to occur near the visual burst interval (Figure 2), we counted the number of spikes recorded from the neuron that occurred intra-saccadically (0–20 ms after movement onset). We did this for movements directed towards the RF location (Figure 1C; Materials and methods). We then plotted radial eye position (aligned to zero in both the x- and y-axes) relative to saccade onset after categorizing the movements by the number of intra-saccadic spikes. When no spikes were recorded during the eye movement, saccade amplitudes were small (darkest curve). Adding ‘visual’ spikes into the SC map during the ongoing movements systematically increased movement amplitudes. Error bars denote s.e.m. (B) To summarize the results in A, we plotted mean saccade amplitude against the number of intra-saccadic ‘visual’ spikes for movements directed towards the RF locations (faint red dots). There was a linear increase in amplitude with each additional spike per recorded neuron (orange line representing the best linear fit of the underlying raw data). Even intra-saccadic spikes from visual neurons (more dissociated from the motor output of the SC than visual-motor neurons) were still associated with increased amplitudes (Figure 4—figure supplement 1). For movements opposite the RF locations (faint green dots and green line), there was no impact of intra-saccadic ‘visual’ spikes on movement amplitudes. The numbers of movements contributing to each x-axis value are 1772, 383, 237, 145, 113, and 78 (towards) or 1549, 238, 104, 63, 36, 23 (opposite) for 0, 1, 2, 3, 4, and 5 spikes, respectively. (C) For the movements towards the RF locations (A), peak radial eye velocities also increased, as expected (Buonocore et al., 2017). Error bars denote one standard error of the mean (A, C) and 95% confidence intervals (B). Figure 4—figure supplement 2 shows results for intra-saccadic spikes from more eccentric neurons (>4.5 deg), and Figure 4—figure supplement 3 shows the full dependence on neuronal preferred eccentricity. Finally, Figure 4—figure supplement 4 shows the same analyses of B but for the data from experiment 2.

Figure 4—figure supplement 1. Same analysis as in Figure 4B (for movements toward RF’s), but separating visual and visual-motor neurons.
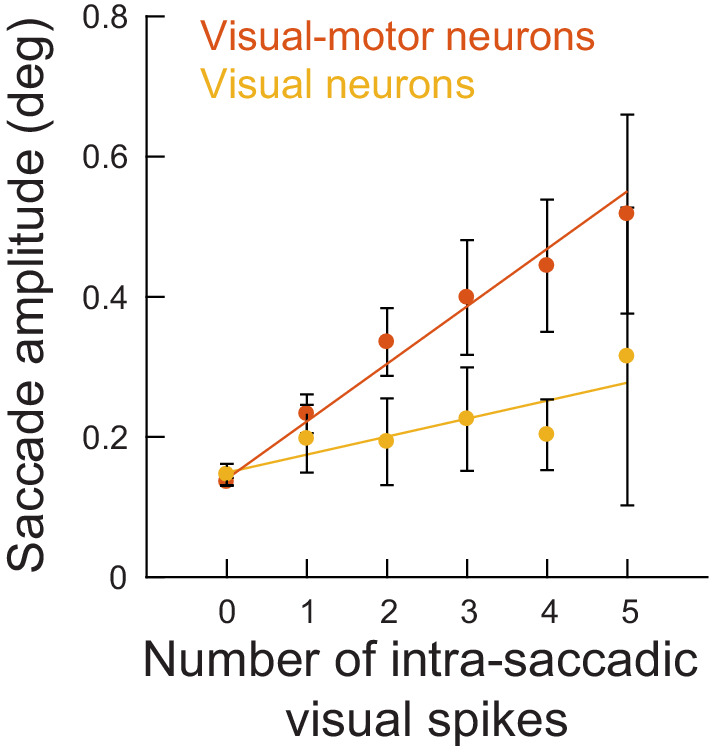
Figure 4—figure supplement 2. Intra-saccadic ‘visual’ spikes from more eccentric neurons in experiment one still linearly increased microsaccade amplitudes, but with a much weaker effect size.

Figure 4—figure supplement 3. Injected visual spikes always increased microsaccade amplitudes, but the effectiveness was diminished with larger neuronal eccentricities.

Figure 4—figure supplement 4. The analysis of Figure 4B but during the spatial frequency task (experiment 2).