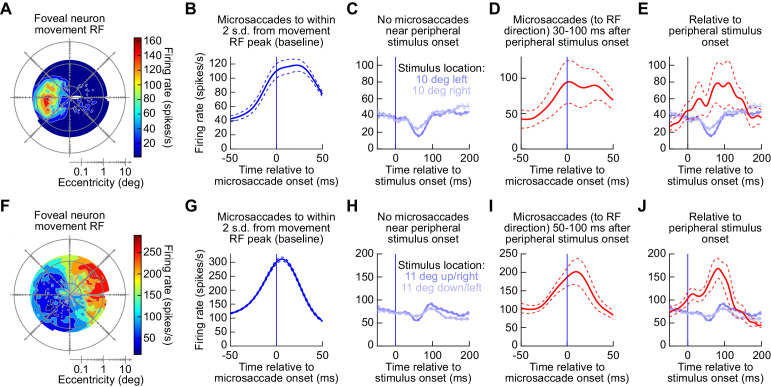
Figure 9. Rostral SC activity still exhibited bursts for microsaccades at the same time as caudal SC visual bursts.
(A) Example movement-related RF of a rostral SC neuron in the right SC (obtained from an RF mapping task; Materials and methods). Peak peri-microsaccadic firing rate is shown as a function of microsaccade radial amplitude and direction. Movement dimensions are plotted on log-polar axes (Hafed and Krauzlis, 2012), and the origin represents 0.03 deg radial amplitude. The neuron preferred leftward horizontal microsaccades. (B) After obtaining a movement RF like in A, we fitted the RF with a two-dimensional gaussian function (Materials and methods), and we then selected all microsaccades to a region within 2 s.d. of the fitted gaussian’s peak. We then plotted firing rates as a function of time from microsaccade onset, confirming movement-related discharge (Hafed et al., 2009; Willeke et al., 2019). (C) When a peripheral stimulus appeared in the main task of experiment three and no microsaccades occurred within −50–200 ms from stimulus onset, the neuron reduced its activity, consistent with earlier reports (Munoz and Istvan, 1998; Dorris et al., 2007; Hafed and Krauzlis, 2008). (D) However, the same neuron still exhibited a movement-related burst if the microsaccades towards its movement RF occurred within the visual burst interval associated with stimulus onset. (E) Thus, when aligned to peripheral stimulus onset, the neuron could either reduce its activity if microsaccades did not occur (blue curves), or it could increase its activity if microsaccades to the movement RF occurred (red). (F–J) Similar observations for a second example rostral SC neuron, this time in the left rostral SC. Note that for this particular example neuron, the visual burst interval that we picked was slightly modified because of a rarity of microsaccades of appropriate direction, but the same conclusions were reached as in the first example neuron (also see Figure 11). Error bars denote s.e.m.

