Abstract
Background and Objective:
Allergic reactions, including anaphylaxis, are rising among children. Little is known about health care utilization among infants and toddlers. Our objective was to characterize health care utilization and charges for acute allergic reactions (AAR).
Methods:
We conducted a retrospective cohort study of trends in emergency department (ED) visits and revisits, hospitalizations and rehospitalizations, and charges among infants and toddlers (ages < 3 years), with an index ED visit or hospitalization for AAR (including anaphylaxis). We used data from population-based multipayer data: State Emergency Department Databases and State Inpatient Databases from New York and Nebraska. Multivariable logistic regression was used to identify factors associated with ED revisits and rehospitalizations.
Results:
Between 2006 and 2015, infant and toddler ED visits for AAR increased from 27.8 per 10,000 population to 35.2 (Ptrend < 0.001), whereas hospitalizations for AAR remained stable (Ptrend = 0.11). In the one year after an index AAR visit, 5.1% of these patients had at least one AAR ED revisit and 5.9% had at least one AAR rehospitalization. Factors most strongly associated with AAR ED revisits included an index visit hospitalization and receipt of epinephrine. Total charges for AAR ED visits (2009–2015) and hospitalizations (2011–2015) were more than $29 million and $11 million, respectively. Total charges increased more than fourfold for both AAR ED revisits for AAR rehospitalizations during the study period.
Conclusion:
Infants and toddlers who presented with an AAR were at risk for ED revisits and rehospitalizations for AAR within the following year. The charges associated with these revisits were substantial and seemed to be increasing.
Keywords: anaphylaxis, food allergy, health care utilization, cost, infant, toddler, allergic reaction, emergency department, children, epinephrine
Acute allergic reactions (AAR) (including anaphylaxis) are rising among children.1 Infants and toddlers are a vulnerable and understudied population, with high rates of food-induced allergic reactions.2,3 Anaphylaxis is an emerging risk as a growing number of infants and toddlers are exposed to potential food allergens (e.g., peanut) early in life due to changes in food introduction recommendations and practices.4,5 Every year, there are ∼30 million emergency department (ED) visits in the United States by children.6 Children ages < 4 years account for >50% of ED visits every year.7 Among children ages < 18 years with an index visit for food-induced anaphylaxis (FIA), 6.4% had a revisit or rehospitalization in the following 1 year.8 The occurrence of ED revisits or rehospitalizations among infants and toddlers with AARs have not been well characterized. Identifying health care utilization patterns will allow us to better care for vulnerable infants and toddlers in the era of early allergen introduction.4 The first aim of the study was to describe the overall trends in ED visits and hospitalizations for AAR and factors associated with severe anaphylaxis among infants and toddlers. The second aim was to describe the trends in AAR ED revisits, rehospitalizations, and associated charges and costs among infants and toddlers with an index AAR ED visit or hospitalization.
METHODS
We conducted a retrospective cohort study of the trends in ED visits and revisits, hospitalizations and rehospitalizations, and charges and costs among infants and toddlers (ages < 3 years) with an index ED visit or hospitalization for AAR (including anaphylaxis). We first analyzed overall trends in ED visits and hospitalizations at the visit level from 2006 to 2015. We then used a cohort to track individuals longitudinally from 2009 to 2015 to calculate both visit-level visit rates (i.e., the number of visits per baseline population of infants and toddlers) and patient-level visit rates (i.e., the number of individual infants and toddlers who presented for visits). To maintain internal validity, we excluded data from the fourth quarter of 2015 after the transition to International Classification of Diseases, Tenth Revision, Clinical Modification (ICD-10-CM) coding.
Data Sources
We analyzed data from the population-based mulitpayer data bases from the Healthcare Cost and Utilization Project (HCUP), State Emergency Department Databases (SEDD), and State Inpatient Databases (SID) maintained by the Agency for Healthcare Research and Quality9 from New York and Nebraska. New York and Nebraska were selected due to the availability of a visit linkage variable, which allows for study of ED revisits and rehospitalization. SEDD captures emergency visits from all payers at hospital-affiliated EDs that do not result in hospitalization. SID includes inpatient discharge records from all payers at community hospitals in the state, including ED visits that resulted in hospitalization. The data are protected by a Data Use Agreement. This study was approved by the Massachusetts General Hospital Institutional Review Board.
Study Population
We constructed cohorts of children ages < 3 years based on discharge diagnoses after an ED visit or hospitalization. First, we constructed a visit-level cohort by using data from 2006 to 2015. Then, we constructed a patient-level cohort by using data from 2009 to 2015. We used the International Classification of Diseases, Ninth Revision, Clinical Modification (ICD-9-CM) diagnosis codes to identify ED visits or hospitalizations for the four categories of allergic reactions based on reaction severity and trigger, which are not mutually exclusive: AAR, anaphylaxis, food-induced AAR (FAAR), and FIA. A full list and description of the ICD-9-CM codes are provided in Supplemental Table 1. The anaphylaxis definition corresponds to Method 1 of the previously validated algorithm by Harduar-Morano.10
Outcomes
Index ED Visits and Hospitalizations.
For the first analysis, we calculated trends in ED visits and hospitalizations (2006–2015). In the SEDD, we defined severe anaphylaxis as hospitalization, endotracheal intubation, mechanical ventilation, or death. There was not a reliable intensive care unit (ICU) indicator in the SEDD. In the SID, we defined severe anaphylaxis by ICU admission.
ED Revisits and Rehospitalizations.
We defined ED revisits and rehospitalizations for those with a valid patient identifier variable (i.e., visit link). We calculated patient-level and visit-level ED revisits (AAR and all-cause) within 1 year of the index AAR ED visit from 2009 to 2015. We calculated revisits for those with index ED visits with and without index hospitalization. Similarly, we calculated rehospitalization (AAR and all-cause) within 1 year of the index hospitalization for AAR from 2009 to 2015.
Charges and Costs.
We then calculated the total charges per year and the average total charges per visit for all AAR ED visits, ED revisits, hospitalizations, and rehospitalizations. In the HCUP data base, charges are the amount that the hospitals billed for the services, excluding professional (physician) fees. For rehospitalizations, we calculated total costs by using the HCUP cost-to-charge ratio files provided by the Agency for Healthcare Research and Quality.9 Costs represent that actual expense incurred in hospital services.9 Cost-to-charge data were not available during the study period for ED visits or ED revisits. All charges and costs were inflation-adjusted to 2015 dollars by using the Consumer Price Index from the U.S. Bureau of Labor Statistics.11
Covariates
We evaluated multiple covariates, including patient age, sex, race and/or ethnicity, primary payer, median household income quartile based on the patient's ZIP code of residence, discharge quarter, admission on a weekend day and length of stay. Administration of epinephrine in the ED was determined by current procedure terminology code (CPT) code J0170 (2006–2010) and J0171 (2011–2015). In the SID, chronic conditions were identified by using the Chronic Condition Indicator, which allows for identification of a chronic condition that was likely present before admission. The Chronic Condition Indicator for pulmonary disease includes asthma and other chronic respiratory diseases. We used procedure codes to identify endotracheal intubation (96.04) and mechanical ventilation (96.7). ICU admission was defined by utilization flag.
Statistical Analyses
All analyses were performed using SAS 9.4 (SAS Institute, Cary, NC). Data are presented as frequencies and proportions or medians with interquartile ranges, as appropriate. We examined trends in the frequency and rate of index ED visits and hospitalizations per 10,000 baseline U.S. population for the corresponding year by using parametric and nonparametric tests as appropriate. To examine factors associated with severe anaphylaxis and ICU admission from 2006 to 2015, we performed multivariable logistic regression modeling. For those with an index visit for AAR from 2009 to 2015, we performed multivariable logistic regression modeling to identify factors associated with ED revisits and rehospitalizations for all diagnoses. We included multiple covariates in the models selected a priori based on clinical knowledge. All p values were two-tailed, with p < 0.05 considered statistically significant.
RESULTS
Trends in ED Visits and Hospitalizations
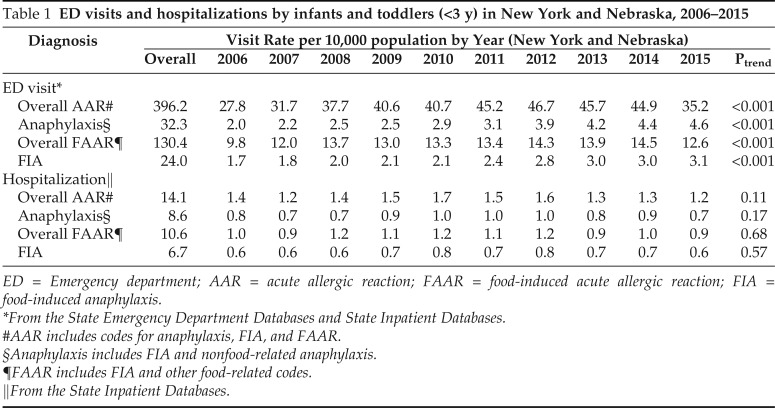
The rate of ED visits for AAR among infants and toddlers increased from 27.8 per 10,000 population in 2006 to 35.2 per 10,000 population in 2015 (Ptrend < 0.001) (Table 1). The rate of ED visits for anaphylaxis also increased from 2 per 10,000 population in 2006 to 4.6 per 10,000 population in 2015 (Ptrend < 0.001). A similar increasing trend was seen for FAAR and FIA. These characteristics are described in Supplemental Table 2. The rate of hospitalization for AAR and anaphylaxis remained stable during the study period (Ptrend = 0.11 and Ptrend = 0.17, respectively). Similar stable trends were seen for FAAR and FIA. These characteristics are described in Supplemental Table 3.
Table 1.
ED visits and hospitalizations by infants and toddlers (<3 y) in New York and Nebraska, 2006–2015
ED = Emergency department; AAR = acute allergic reaction; FAAR = food-induced acute allergic reaction; FIA = food-induced anaphylaxis.
*From the State Emergency Department Databases and State Inpatient Databases.
#AAR includes codes for anaphylaxis, FIA, and FAAR.
§Anaphylaxis includes FIA and nonfood-related anaphylaxis.
¶FAAR includes FIA and other food-related codes.
‖From the State Inpatient Databases.
Associations with Severe Anaphylaxis and ICU Admission
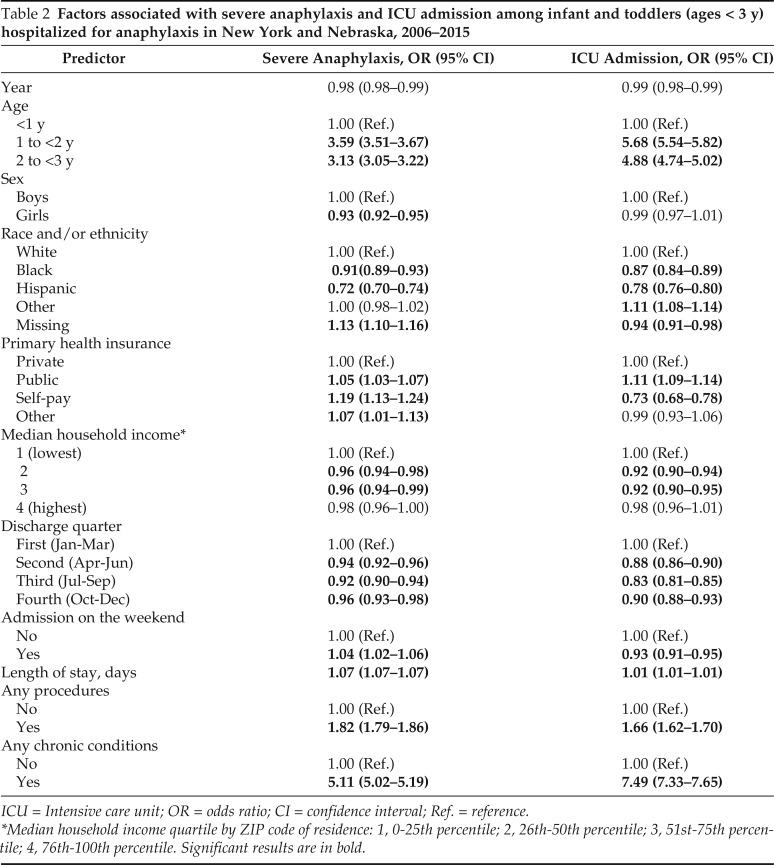
Among infants and toddlers hospitalized for anaphylaxis from 2006 to 2015, severe anaphylaxis was associated with ages > 1 year, male sex, white race, insurance other than private insurance (e.g., public or self-pay), the lowest income quartile, a weekend admission, underwent at least one procedure during admission, and a history of any chronic condition (Table 2). A history of a chronic condition was most strongly associated (odds ratio 5.11 [95% confidence interval, 5.02–5.19]). ICU admission was associated with age > 1 year, white race, public insurance, the lowest income quartile, any procedures during hospitalization, and any history of chronic condition. Among these factors, a history of any chronic condition was the most strongly associated (odds ratio 7.49 [95% confidence interval, 7.33–7.65]).
Table 2.
Factors associated with severe anaphylaxis and ICU admission among infant and toddlers (ages < 3 y) hospitalized for anaphylaxis in New York and Nebraska, 2006–2015
ICU = Intensive care unit; OR = odds ratio; CI = confidence interval; Ref. = reference.
*Median household income quartile by ZIP code of residence: 1, 0-25th percentile; 2, 26th-50th percentile; 3, 51st-75th percentile; 4, 76th-100th percentile. Significant results are in bold.
ED Revisits after the Index AAR ED Visit
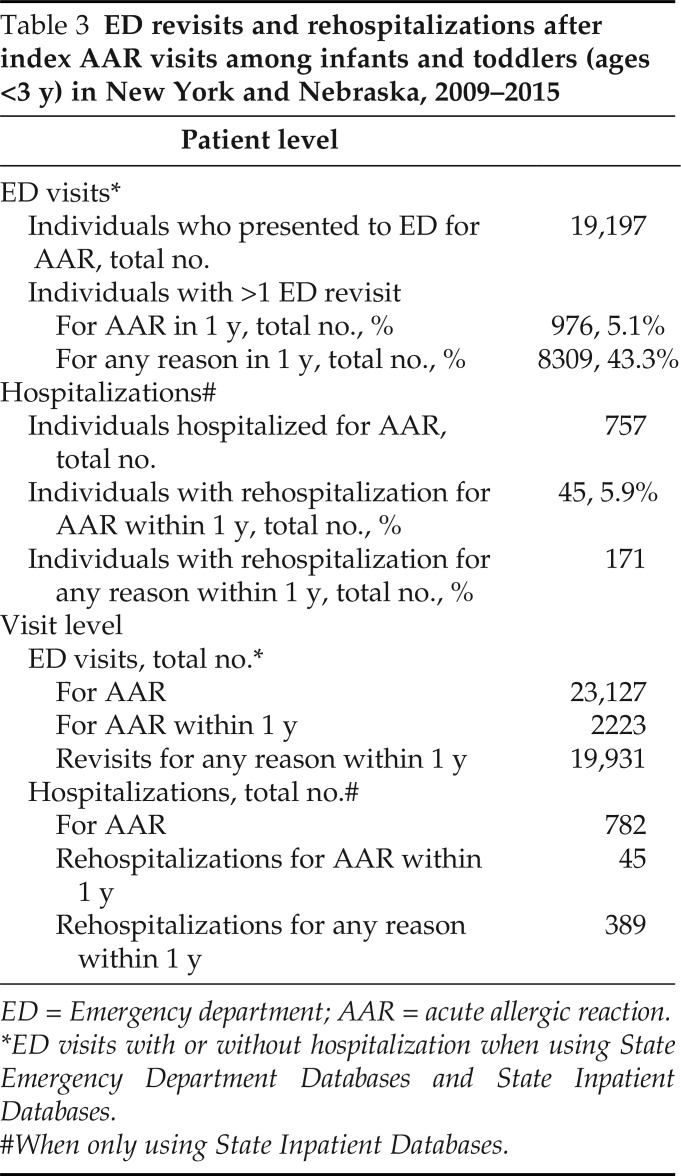
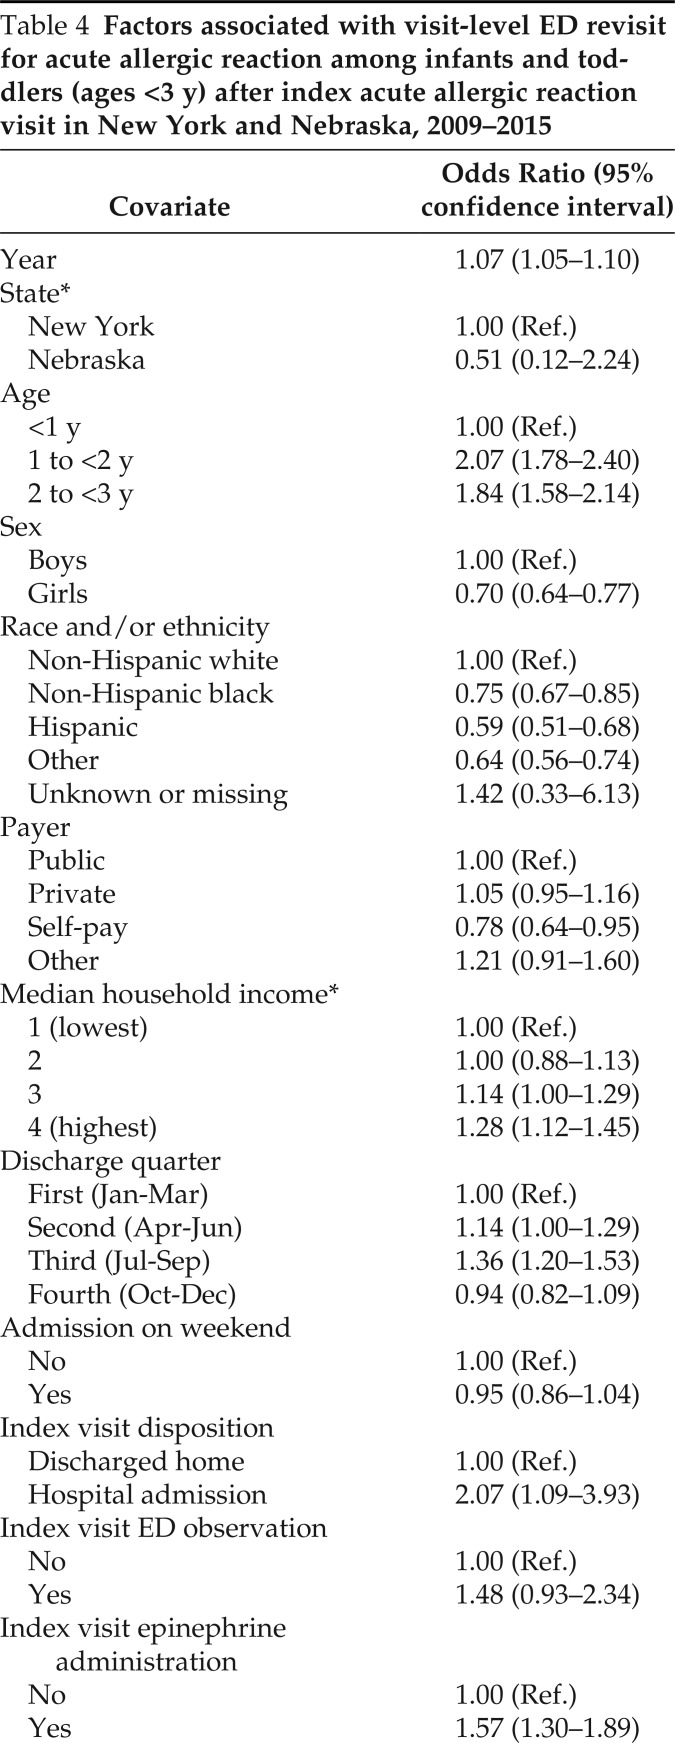
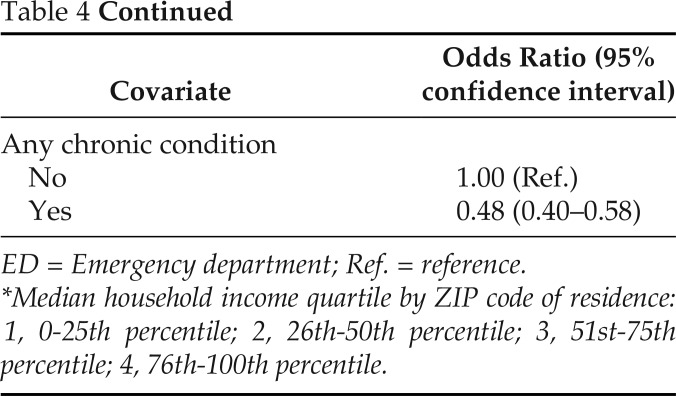
In the 1 year after the index AAR ED visit, 5.1% of individual children had at least one ED revisit for AAR (Table 3). These characteristics are described in Supplemental Table 4. ED revisit for AAR was associated with ages > 1 year, male sex, white race, index hospitalization, and index visit epinephrine administration (Table 4).
Table 3.
ED revisits and rehospitalizations after index AAR visits among infants and toddlers (ages <3 y) in New York and Nebraska, 2009–2015
ED = Emergency department; AAR = acute allergic reaction.
*ED visits with or without hospitalization when using State Emergency Department Databases and State Inpatient Databases.
#When only using State Inpatient Databases.
Table 4.
Factors associated with visit-level ED revisit for acute allergic reaction among infants and toddlers (ages <3 y) after index acute allergic reaction visit in New York and Nebraska, 2009–2015
ED = Emergency department; Ref. = reference.
*Median household income quartile by ZIP code of residence: 1, 0-25th percentile; 2, 26th-50th percentile; 3, 51st-75th percentile; 4, 76th-100th percentile.
Rehospitalization after Index Hospitalization for AAR
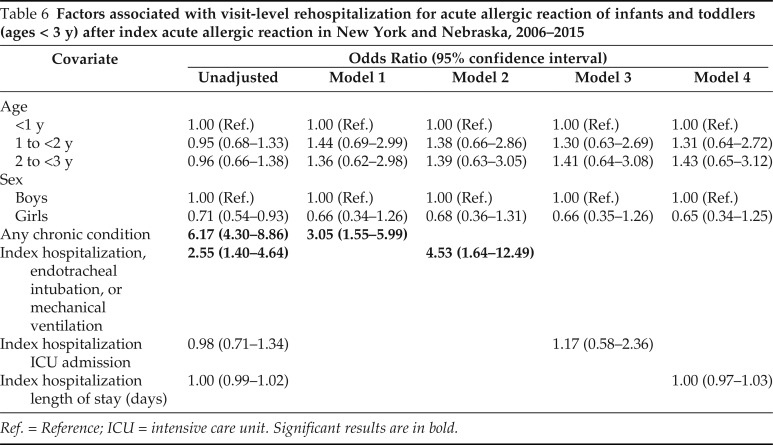
In the 1 year after the index AAR hospitalization, 5.9% of individual children were rehospitalized at least once for AAR. These characteristics are described in Supplemental Table 5. In the unadjusted and multivariable analyses, a history of any chronic condition, and endotracheal intubation or mechanical ventilation at index hospitalization were significantly associated with rehospitalization for AAR (Table 6).
Table 6.
Factors associated with visit-level rehospitalization for acute allergic reaction of infants and toddlers (ages < 3 y) after index acute allergic reaction in New York and Nebraska, 2006–2015
Ref. = Reference; ICU = intensive care unit. Significant results are in bold.
ED Visit and Revisit Charges
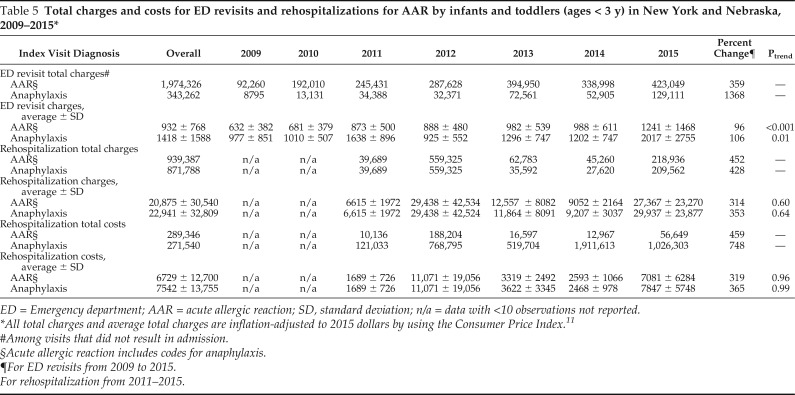
From 2009 to 2015, the total of the charges for index AAR ED visits without hospitalization was $29,411,606 and the average of the charges was $826 per visit. The total of the charges for index anaphylaxis ED visits without hospitalization was $3,425,274, and the average of the charges was $1504 per visit (data not shown). During the study period, the total of the charges for AAR ED revisits was $1,974,326, with the average of the charges of $932 per visit. The total of the charges for AAR ED revisits increased more than fourfold, from $92,260 in 2009 (inflation adjusted to 2015 dollars) to $423,049 in 2015. The average ± standard deviation (SD) of the charges increased by 96%, from $632 ± $382 in 2009 (inflation adjusted 2015 dollars) to $1241 ± $1468 in 2015 (Ptrend < 0.001) (Table 5).
Table 5.
Total charges and costs for ED revisits and rehospitalizations for AAR by infants and toddlers (ages < 3 y) in New York and Nebraska, 2009–2015*
ED = Emergency department; AAR = acute allergic reaction; SD, standard deviation; n/a = data with <10 observations not reported.
All total charges and average total charges are inflation-adjusted to 2015 dollars by using the Consumer Price Index.11
#Among visits that did not result in admission.
§Acute allergic reaction includes codes for anaphylaxis.
¶For ED revisits from 2009 to 2015.
For rehospitalization from 2011–2015.
Hospitalization and Rehospitalization Charges and Costs
From 2009 to 2015, the total of the charges for AAR index hospitalization was $11,461,666 and the average of the charges was $29,464 per hospitalization. The total of the costs for index AAR hospitalization was $3,200,489 and the average of the costs was $8697 per hospitalization (data not shown). The number of AAR rehospitalizations from 2009 to 2010 were too low to report a valid cost and charge estimates. The total of the charges for AAR rehospitalization after index AAR hospitalization increased by more than fourfold (452%), from $39,689 (inflation adjusted to 2015 dollars) in 2011 to $218,936 in 2015 (Table 5). The average ± SD of the charges for AAR rehospitalization increased by 314%, from $6615 ± $1,972, inflation adjusted to 2015 dollars) in 2011 to $27,367 ± $23,270 in 2015 (Ptrend = 0.60). Due to low absolute numbers of AAR rehospitalizations, there was variability in costs and charges from year to year. The total costs for AAR rehospitalization after index AAR increased fourfold (459%), from $10,136 (inflation adjusted to 2015 dollars) in 2011 to $56,649 in 2015. The average ± SD of the costs for AAR rehospitalization increased by 319%, from $1689 ± $726, inflation adjusted US dollars) in 2011, to $7081 ± $6284) in 2015 (Ptrend = 0.96). (Table 5).
DISCUSSION
By using U.S. population-based data from two states (New York and Nebraska), we characterized trends in health care utilization for AAR (including anaphylaxis) among infants and toddlers. We reported rising rates of ED visits for all types of AAR (including anaphylaxis), FAAR, and FIA during the study period. In contrast, the rates of hospitalization remained stable. Although data are sparse about infants and toddlers, these findings were consistent with other recent studies.1,12–14 Severe anaphylaxis or ICU admission was most strongly associated with a history of any chronic condition. Although the details of these chronic conditions were limited due to the nature of the data, this finding was consistent with previous studies that showed that asthma (the most common chronic pulmonary condition among children) is associated with severe anaphylaxis.15–17 Interestingly, the odds of severe anaphylaxis and ICU admission were much higher among toddlers (ages 1 to <3 years) compared with infants (ages < 1 year). Anaphylaxis in infants is not well characterized but the presentation may be less severe.3,18,19
In our study, we found that patient-level ED revisits for AAR occurred in 5.1% of infants and toddlers. There were limited data on ED revisits for infants and toddlers with AAR. The majority of previous studies focused on recurrent anaphylaxis in all children. From a study that used a large administrative data base in the United States, 3.5% of all the children (ages < 18 years) with an index anaphylaxis ED visit had an ED visit for recurrent anaphylaxis within 1 year.20 A previous study that used a cohort of children (ages < 18 years), with an index anaphylaxis visit found that 6.4% had a recurrent ED visit and/or hospitalization for anaphylaxis.8
We reported that ED revisits for AAR were most strongly associated with index hospital admission and index epinephrine administration, which suggested that a more severe index presentation increased the odds of an ED AAR revisit. Although the reasons for this are not known, we hypothesize that a lack of appropriate ED follow-up for this vulnerable population may contribute. As per guidelines, appropriate ED follow-up care for anaphylaxis includes an allergist evaluation, epinephrine autoinjector (EAI) prescription, and parental education about allergen avoidance.21,22 Implementation of these guidelines seemed to be improving but remains suboptimal.23,24 Access to appropriate weight-based EAI for infants and toddlers has been limited due to availability of 0.1-mg doses.3 To prevent ED revisits in this vulnerable population, we should focus on access to allergist care, prescriptions for appropriate weight-based EAIs, and parental education.
We reported that 5.9% of infants and toddlers hospitalized for AAR had an AAR rehospitalization in the following 1 year. There were sparse data on rehospitalization for children and no previous studies of AAR or anaphylaxis rehospitalizations among infants and toddlers. A recent study that used the National Readmission Database reported rehospitalization for FIA in 1.1% of children ages < 18 years within 1 year.25 However, there was no specific analysis of infants and toddlers. Analysis of our findings suggested that infants and toddlers may have a higher risk for rehospitalization than older children. Factors that may increase the risk of rehospitalization for AAR include variable anaphylaxis presentation and continued allergen exposure due to high rates of FIA in this population.2,3
Recurrent anaphylaxis has been associated with asthma, other atopic diseases, and severity of index reaction.15,26 Our findings supported this because we reported an increased odds of rehospitalization among infants and toddlers with any chronic conditions and with intubation or mechanical ventilation on the index visit. Many children who experience AAR are at risk of future reactions due to persistent food allergy and other chronic atopic conditions (e.g., asthma). Identification of these children at high risk at the time of the index visit is essential to decrease recurrent visits. It is essential that all infants and toddlers hospitalized for AAR receive a referral for an allergist evaluation, prescription for appropriate EAI, and parental education on avoidance of potential triggers to prevent rehospitalization for AAR or anaphylaxis.15
Interestingly, we reported a high rate of all-cause ED revisits after the index AAR visit, of 43.3%. This finding was higher than the reported 25% of children in the United States with any-cause ED revisit within 1 year of any-cause index ED visit.27 It is possible that infants and toddlers with AAR and anaphylaxis are at risk of ED revisits due to other atopic conditions (e.g., wheezing or asthma) or the findings may be due to overutilization of the ED for unrelated conditions. Limited access to appropriate and accessible outpatient care may also lead to ED revisits.
We reported that the financial burden of AAR among infants and toddlers was substantial. During the study period, the total charges for AAR ED visits were more than $29 million and hospitalizations were more than $11 million in New York and Nebraska alone. The total charges for ED revisits for AAR increased more than fourfold and the total charges for AAR rehospitalization increased nearly sixfold. This financial burden has not been well described; but these results were generally consistent with previous studies among children with AAR and FIA.25,28,29 The increase in average charges and costs for visits over time indicated that the costs and charges may have increased despite short lengths of stay and few procedures. However, the data were limited due to year-to-year variability and the low absolute number of events. Analysis of these data highlighted the financial importance of preventing revisits and rehospitalizations.
Our study had several limitations, including the use of administrative data, which is prone to coding error and diagnostic misclassification. Based on previous studies, anaphylaxis is underdiagnosed by ICD-9-CM code and thus we expected that our findings may be an underestimate of the prevalence of anaphylaxis.29 The generalizability of this study may be limited due to the use of data from two U.S. states. However, the data were population based and mulitpayer. The two states are geographically diverse and thus are more generalizable. Our analysis of ED revisits and rehospitalizations at the patient-level was limited by the presence of the specific visit linkage variable, which was not reliable from 2006 to 2008 and which was not available for all index visits. Our ability to capture epinephrine administration was limited to procedure codes and thus did not capture the number of doses or appropriate administration in the prehospital setting. Due to the transition from ICD-9-CM and ICD-10-CM coding in late 2015, we only had data from the first 3 quarters of 2015; however, the overall trends were present before 2015. Due to the nature of the data, we were unable to capture information about allergist evaluations and EAI prescriptions. Due to low absolute numbers of rehospitalizations and year-to-year variability our ability to confidently make conclusions about rehospitalization charges and costs were limited.
The strengths of the study included the use of >7 years of data from a population-based multiplayer data base from two diverse U.S. states with the ability to define trends in visits, hospitalization revisits, costs, and charges. The data base also allowed us to identify factors associated with severe anaphylaxis and ICU admission, which cannot be well studied in other nationwide data bases. Our study population (infants and toddlers) is rarely studied in anaphylaxis, but research on this vulnerable population is essential because anaphylaxis is an emerging risk due to the updated guidelines for early introduction of allergens. This study was conducted before dissemination and implementation of the updated food allergy guidelines in 2017.4
CONCLUSION
Among infants and toddlers, ED visits for AAR and anaphylaxis increased, whereas hospitalizations remained stable. In the 1 year after the index AAR visit, ED revisits and rehospitalizations for AAR are not uncommon in these vulnerable children. The financial impact of AAR ED revisits and rehospitalizations is substantial. We must improve implementation of strategies to prevent revisits and rehospitalizations for AAR among infants and toddlers. Strategies to prevent revisits and rehospitalizations include adherence to anaphylaxis guidelines of allergists' evaluations, access to weight-based EAIs, and parental education of allergen avoidance. This is particularly relevant as we enter the era of early allergen introduction and more high-risk infants and toddlers will be exposed to potential food allergens.4,5
Footnotes
CA Camargo Jr. is a consultant and has received grants from Kaleo and Bryn Pharma. The remaining authors have no conflicts of interest to declare pertaining to this article
L.B. Robinson was supported by the National Institutes of Health (NIH) award T32HL116275. A.C. Arroyo was supported by NIH R25AI147369-02. The content is solely the responsibility of the authors and does not necessarily represent the official views of the NIH. C.A. Camargo received partial funding for this data analysis project from kaleo, Inc. (Richmond, VA)
The NIH had no role in the design or conduct of the study. kaleo, Inc. reviewed the final manuscript after study completion
Supplemental data available at www.IngentaConnect.com
REFERENCES
- 1. Motosue MS, Bellolio MF, Van Houten HK, et al. National trends in emergency department visits and hospitalizations for food-induced anaphylaxis in US children. Pediatr Allergy Immunol. 2018; 29:538–544. [DOI] [PubMed] [Google Scholar]
- 2. Rudders SA, Banerji A, Clark S, et al. Age-related differences in the clinical presentation of food-induced anaphylaxis. J Pediatr. 2011; 158:326–328. [DOI] [PMC free article] [PubMed] [Google Scholar]
- 3. Greenhawt M, Gupta RS, Meadows JA, et al. Guiding principles for the recognition, diagnosis, and management of infants with anaphylaxis: an expert panel consensus. J Allergy Clin Immunol Pract. 2019; 7:1148–1156.e5. [DOI] [PubMed] [Google Scholar]
- 4. Togias A, Cooper SF, Acebal ML, et al. Addendum guidelines for the prevention of peanut allergy in the United States: report of the National Institute of Allergy and Infectious Diseases-sponsored expert panel. J Allergy Clin Immunol. 2017; 139:29–44. [DOI] [PMC free article] [PubMed] [Google Scholar]
- 5. Du Toit G, Roberts G, Sayre PH, et al. Randomized trial of peanut consumption in infants at risk for peanut allergy. N Engl J Med. 2015; 372:803–813. [DOI] [PMC free article] [PubMed] [Google Scholar]
- 6. Tang N, Stein J, Hsia RY, et al. Trends and characteristics of US emergency department visits, 1997–2007. JAMA. 2010; 304:664–670. [DOI] [PMC free article] [PubMed] [Google Scholar]
- 7. McDermott KW, Stocks C, Freeman WJ. Overview of pediatric emergency department visits, 2015. HCUP Statistical Brief #242. In: Healthcare Cost and Utilization Project (HCUP) Statistical Briefs [Internet]. Rockville (MD): Agency for Healthcare Research and Quality; 2006. February. August 2018. Agency for Healthcare Research and Quality. 2017. Updated December. Available online at www.hcup-us.ahrq.gove/nedsoverview.jsp; accessed August 7, 2020. [PubMed] [Google Scholar]
- 8. Landsman-Blumberg PB, Wei W, Douglas D, et al. Concordance with recommended postdischarge care guidelines among children with food-induced anaphylaxis. J Pediatr. 2014; 164:1444–1448.e-1. [DOI] [PubMed] [Google Scholar]
- 9. HCUP Databases. Healthcare Cost and Utilization Project (HCUP). 2006–2015. Agency for Healthcare Research and Quality. Rockville, MD. Available online at www.hcup-us.ahrq.gove/databases.jsp; accessed May 30, 2020. [PubMed] [Google Scholar]
- 10. Harduar-Morano L, Simon MR, Watkins S, et al. Algorithm for the diagnosis of anaphylaxis and its validation using population-based data on emergency department visits for anaphylaxis in Florida. J Allergy Clin Immunol. 2010; 126:98–104.e4. [DOI] [PMC free article] [PubMed] [Google Scholar]
- 11. U.S. Bureau of Labor Statistics. Consumer price index - all urban consumers, 2009–2015. Available online at http://data.bls.gov; accessed April 2020.
- 12. Michelson KA, Monuteaux MC, Neuman MI. Variation and trends in anaphylaxis care in United States children's hospitals. Acad Emerg Med. 2016; 23:623–627. [DOI] [PubMed] [Google Scholar]
- 13. Rudders SA, Banerji A, Vassallo MF, et al. Trends in pediatric emergency department visits for food-induced anaphylaxis. J Allergy Clin Immunol. 2010; 126:385–388. [DOI] [PubMed] [Google Scholar]
- 14. Shrestha P, Dhital R, Poudel D, et al. Trends in hospitalizations related to anaphylaxis, angioedema, and urticaria in the United States. Ann Allergy Asthma Immunol. 2019; 122:401–406.e2. [DOI] [PubMed] [Google Scholar]
- 15. Pouessel G, Cerbelle V, Lejeune S, et al. Anaphylaxis admissions in pediatric intensive care units: follow-up and risk of recurrence. Pediatr Allergy Immunol. 2019; 30:341–347. [DOI] [PubMed] [Google Scholar]
- 16. Smith PK, Hourihane JO, Lieberman P. Risk multipliers for severe food anaphylaxis. World Allergy Organ J. 2015; 8:30. [DOI] [PMC free article] [PubMed] [Google Scholar]
- 17. Jerschow E, Lin RY, Scaperotti MM, et al. Fatal anaphylaxis in the United States, 1999-2010: temporal patterns and demographic associations. J Allergy Clin Immunol. 2014; 134:1318–1328.e7. [DOI] [PMC free article] [PubMed] [Google Scholar]
- 18. Pouessel G, Jean-Bart C, Deschildre A, et al. Food-induced anaphylaxis in infancy compared to preschool age: a retrospective analysis. Clin Exp Allergy. 2020; 50:74–81. [DOI] [PubMed] [Google Scholar]
- 19. Simons FER, Sampson HA. Anaphylaxis: unique aspects of clinical diagnosis and management in infants (birth to age 2 years). J Allergy Clin Immunol. 2015; 135:1125–1131. [DOI] [PubMed] [Google Scholar]
- 20. Motosue MS, Bellolio MF, Van Houten HK, et al. Risk factors for recurrent anaphylaxis-related emergency department visits in the United States. Ann Allergy Asthma Immunol. 2018; 121:717–721.e1. [DOI] [PubMed] [Google Scholar]
- 21. Campbell RL, Li JTC, Nicklas RA, et al. Emergency department diagnosis and treatment of anaphylaxis: a practice parameter. Ann Allergy Asthma Immunol. 2014; 113:599–608. [DOI] [PubMed] [Google Scholar]
- 22. Shaker MS, Wallace DV, Golden DBK, et al. Anaphylaxis–a 2020 practice parameter update, systematic review, and Grading of Recommendations, Assessment, Development and Evaluation (GRADE) analysis. J Allergy Clin Immunol. 2020; 145:1082–1123. [DOI] [PubMed] [Google Scholar]
- 23. Clark S, Boggs KM, Balekian DS, et al. Changes in emergency department concordance with guidelines for the management of food-induced anaphylaxis: 1999–2001 versus 2013–2015. J Allergy Clin Immunol Pract. 2019; 7:2262–2269. [DOI] [PubMed] [Google Scholar]
- 24. Clark S, Boggs KM, Balekian DS, et al. Changes in emergency department concordance with guidelines for the management of stinging insect-induced anaphylaxis: 1999–2001 vs 2013–2015. Ann Allergy Asthma Immunol. 2018; 120:419–423. [DOI] [PubMed] [Google Scholar]
- 25. Cheng BT, Fishbein AB. Patterns of hospital readmission in children with food-induced anaphylaxis. J Allergy Clin Immunol Pract. 2020; 8:1420–1422.e1. [DOI] [PMC free article] [PubMed] [Google Scholar]
- 26. O‘Keefe A, Clarke A, St Pierre Y, et al. The risk of recurrent anaphylaxis. J Pediatr. 2017; 180:217–221. [DOI] [PubMed] [Google Scholar]
- 27. Goto T, Hasegawa K, Faridi MK, et al. Emergency department utilization by children in the USA, 2010–2011. West J Emerg Med. 2017; 18:1042–1046. [DOI] [PMC free article] [PubMed] [Google Scholar]
- 28. Patel DA, Holdford DA, Edwards E, et al. Estimating the economic burden of food-induced allergic reactions and anaphylaxis in the United States. J Allergy Clin Immunol. 2011; 128:110–115.e55. [DOI] [PubMed] [Google Scholar]
- 29. Rudders SA, Arias SA, Camargo CA, Jr. Trends in hospitalizations for food-induced anaphylaxis in US children, 2000–2009. J Allergy Clin Immunol. 2014; 134:960–962.e3. [DOI] [PubMed] [Google Scholar]
Associated Data
This section collects any data citations, data availability statements, or supplementary materials included in this article.


