

Abstract
The magnetic and interface properties of [Pt/Co/Pt] were investigated. First, the magnetic properties were determined from the magnetic dead layer plots, in which the Co layer was considered as two distinct parts representing different magnetic properties. The two parts with low and high tCo ranges are close to and away from the top interface (Co/Pt), respectively. The part close to the top interface shows a smaller magnetization (M) value and nonlinear behavior. However, the other part shows a higher M value closer to the bulk value and a linear behavior. The nonlinear behavior of the M values of the low tCo range was converted to an impurity level using simple assumptions. The results showed the effect of the top Pt layer on the magnetic properties of the Co layer. The results clearly demonstrate that magnetometry could be utilized as a means to understand the interface quality of magnetic multilayer systems.
Subject terms: Magnetic properties and materials, Characterization and analytical techniques, Magnetic properties and materials
Introduction
Recently, magnetic structures with perpendicular magnetic anisotropy (PMA) have been extensively studied, because they are essential for the development of high-density magnetic random access memory1,2. One of the most important materials showing a strong PMA is the [NM/Co]n multilayer (where NM and n denote the nonmagnetic material and number of iterations, respectively)3–5. In these structures, PMA is achieved through the interface effects. However, its strength is sensitive to the flatness and atomic intermixing of the interfaces6,7. The interface flatness can be improved by designing proper seed/buffer layers before depositing the multilayers. However, the atomic intermixing is extremely difficult to prevent if the stacks are fabricated through sputtering, in which the sputtered particles arriving at the substrate are rather energetic8. The [Pt/Co] multilayer system, which is one of the most popular multilayer systems exhibiting a strong PMA, can be composed of two different types of interfaces: Pt (bottom)/Co and Co (bottom)/Pt. Considering that Pt is significantly heavier and more strongly bonded than Co, more intermixing will occur at the Co/Pt interface than at the Pt/Co interface9–11. Therefore, to develop materials with a strong PMA, it is important to minimize the intermixing at the Co/Pt interfaces. Some efforts have been made in this direction, which include inserting a spacer layer such as Cu between Co and Pt12 and reducing the Pt layer thickness down to 0.2–0.25 nm3–5. The latter results in [Pt/Co] multilayers with an inverted structure in which Pt is thinner than Co; this showed a strong PMA and high post-annealing stability4,5. Very recently, a model system with a trilayer structure of [Pt/Co/Pt] was investigated for a more comprehensive understanding of the roles played by the Pt/Co and Co/Pt interfaces in influencing the PMA strength11. The PMA strength due to the top Co/Pt interface was found to be significantly weaker than that of the bottom Pt/Co interface. A similar difference in the interface quality was expected between the two interfaces but no evidence was found. In this study, conventional magnetometry was used to analyze the interface quality of the bottom Pt/Co and top Co/Pt interfaces in the [Pt/Co/Pt] trilayers; however, a more emphasis was placed on the latter, because its interface quality and PMA strength are greatly affected by annealing and the top Pt thickness4,5,11.
Results
Microstructural characterization by HRTEM
To examine the microstructure of the interfaces, two typical samples were chosen for HRTEM experiments: (1) tCo = 5.0 nm and tPt = 0.25 nm, and (2) tCo = 5.0 nm and tPt = 3.0 nm. Figure 1a–d show cross-sectional HRTEM images of these samples. The upper images (Fig. 1a,b) display the first sample (tCo = 5.0 nm and tPt = 0.25 nm), whereas the lower images (Fig. 1c,d) display the second samples (tCo = 5.0 nm and tPt = 3 nm). Figure 1a,c display the as-deposited samples, and Fig. 1b,d display the annealed samples. The HRTEM images show that the stacks consist of a well-developed layered structure with atomically sharp interfaces. A detailed analysis of the images indicated that the Ru seed-layer has a hexagonal close-packed (hcp) structure and the lower Pt layer, located on top of Ru, has a face-centered cubic (fcc) structure. However, the crystalline structure of the Co layer could not be identified from the present HRTEM results because the d-spacing of hcp (0001) was nearly identical to that of fcc (111). It is rather difficult to identify a thin Pt layer (tPt = 0.25 nm) from the HRTEM images in Fig. 1a,b. However, our numerous results carried out on [Pt/Co] multilayers and [Pt/Co/Pt] trilayers using very thin Pt layers down to 0.2 nm4,5,11 clearly demonstrate that the Pt layer forms a continuous coverage and its thickness is accurate. The main aim of the HRTEM experiments was to observe the difference in the flatness and intermixing of the Pt/Co and Co/Pt interfaces as a function of tPt and their variation upon annealing. It was observed that the PMA strength of the top Co/Pt interface decreases upon annealing11,13, indicating that an intermixing occurs at the interface. However, no conclusive results could be drawn from the HRTEM images, except that the two interfaces became more blurred upon annealing. Therefore, the magnetic properties of the samples could not be adequately studied from the interface microstructural characterization.
Figure 1.

Cross-sectional HRTEM images of the [Pt/Co/Pt] structures with two tPt values in both as-deposited and annealed samples. Results of the samples with (a,b) tPt = 0.25 nm and (c,d) tPt = 3.0 nm. Results for the (a,c) as-deposited samples and (b,d) annealed samples.
MDL plots
Consequently, a systematic magnetometry study was performed, which mainly involved plotting the magnetic moment as a function of tCo. These results are shown in Fig. 2a,b over a wide tCo range for the samples with tPt = 0.25 and 3.0 nm, respectively. The upper set of results in each figure represents for the as-deposited samples, whereas the lower set represents the annealed samples. In these figures, not the magnetic moment itself but its normalized value according to the sample area (emu/cm2) is plotted as a function of tCo so that the slope corresponds to the magnetization value. An obvious analytical equation describing the results in the high tCo range is . Coefficient a is identical to the saturation magnetization value (Ms in emu/cm3), and the x value at which y = 0 (viz., − b/a) indicates the magnetic dead layer (MDL) thickness. Notably, the MDL thickness obtained in this way is of little physical significance because the magnetic moment is not zero at the MDL thickness. This linear behavior indicates that the Ms value can be determined in this tCo range. For the samples with tPt = 0.25 nm, Ms = 1379 emu/cm3 for both samples in the as-deposited state and after annealing. However, for the samples with tPt = 3.0 nm, this Ms value is reduced substantially to 1333 emu/cm3 in the as-deposited state, even though it increased slightly to 1355 emu/cm3 after annealing. All these values are lower than those reported for bulk Co: 1422 emu/cm3 for hcp Co and 1450 emu/cm3 for fcc Co14. This reduction in Ms is because the thin Co layers accommodate a substantial proportion of atoms at the interfaces. Another possibility is the interpenetration of Pt atoms into the Co layer during sputtering. The lower Ms values for the samples with tPt = 3 nm could be attributed to the greater interpenetration for a sample with a thicker Pt layer. However, for the samples with tPt = 3 nm, the slight increase in Ms after annealing is unexpected because Pt atoms are likely to diffuse into the Co layer during annealing, causing a further decrease in the Ms value. This unexpected increase in Ms may indicate an opposite behavior of de-mixing during the annealing, which is likely to occur if the Co layer has an hcp structure unlike the fcc structure of the interpenetrated Pt atoms. A similar de-mixing behavior was reported for the systems of a Co–Pt alloy and [Pt/Co] multilayers, and it is contradictory to the behavior observed for the samples with tPt = 0.25 nm, where no change in Ms occurs upon annealing. This indicates that the interpenetration of Pt atoms into the Co layer in this case is minimal, at least in the thickness range of tCo ≥ 4 nm.
Figure 2.

Results for Ms·tCo as a function of tCo at (a) tPt = 0.25 nm and (b) tPt = 3.0 nm in as-deposited and annealed samples. Blue solid lines show the linear fits for the results of tCo ≤ 4 nm, whereas red solid lines show the linear fits for the results of tCo ≥ 4 nm; all the broken lines represent the extrapolated lines for the blue and red solid lines. The Ms values extracted from the fits are also given in the figures.
A deviation from the linear behavior is visible in the low tCo range. As the tCo value decreases, all the plots show an upward deviation, which contrasts with the conventional MDL plot showing a linear behavior. Considering that the slope of the plot is identical to the Ms value, the upward deviation indicates that the Ms value in this low tCo range decreases with decreasing tCo. This could be due to the interpenetration of nonmagnetic Pt atoms into the Co layer. A similar upward deviation was not observed in the MDL plots for [Pt/Co/Cu] trilayers15, indicating that the saturation magnetization of Co is constant in the Co thickness range considered in the MDL plots. As the relative portion of the interpenetrated region over the entire Co layer will increase with decreasing tCo, the observed results show a lower Ms value at a lower tCo. For quantitative analysis, significant results could be obtained using an analytical equation. Although the choice for the analytical equation in the low tCo range is not so obvious, the following equation accurately describes the results: , where parameters a, b, and c are summarized in Table 1. In this equation, exponent c denotes the deviation from the linear behavior. When , this equation converges into its linear form for the high-tCo region. The extracted c values were very close to 1, indicating that the deviation from the linear behavior is not large. For the as-deposited samples, c = 1.057 (tPt = 0.25 nm) and 1.061 (tPt = 3.0 nm), and these slightly increased to 1.085 (tPt = 0.25 nm) and 1.094 (tPt = 3.0 nm) for the annealed samples, indicating an increased deviation from the linear behavior after annealing. Furthermore, the c values for the stacks with tPt = 0.25 nm are smaller than those for the stacks with tPt = 3.0 nm for both as-deposited and annealed samples, indicating that the Pt penetration affects the magnetic properties.
Table 1.
Summary for the parameters of the equation; .
| tPt = 0.25 nm | tPt = 3.0 nm | |||
|---|---|---|---|---|
| As-deposited | Annealed | As-deposited | Annealed | |
| a | 1069.6 | 1094.5 | 1042.7 | 1032.6 |
| b | − 7.8 × 10⁻¹¹ | − 1.5 × 10⁻¹⁰ | − 2.3 × 10⁻⁹ | − 2.8 × 10⁻¹⁰ |
| c | 1.057 | 1.085 | 1.061 | 1.094 |
Magnetic properties in Co layer derived from MDL plots
Based on the analytical equations, magnetization (which is identical to the derivative of the equation, according to tCo (x)) can be obtained. Figure 3a shows the results for M (magnetization) as a function of the position in the Co layer. The schematics of the stack structure (left) and a typical variation of M with the position in the Co layer (right) are shown in Fig. 3b. For the bottom Pt/Co interface, where the intermixing level during sputtering is negligible, leading to a well-defined interface, the M value is close to the bulk value11. Notably, for all the cases, M ≠ 0 at tCo = 0, indicating the existence of an interface magnetization. A probable reason for the interface magnetization is that nonmagnetic Pt atoms can have a magnetic moment when they are in contact with magnetic Co atoms; this is known as the proximity effect16,17. Mukhopadhyay et al.18 reported that the induced magnetic moment does not differ significantly between the Pt/Co and Co/Pt interfaces; however, Kim et al.19 reported that the proximity effect from the top interface is stronger than that from the bottom one. In this paper, no evidence is observed on the relative strength of the proximity effect between the bottom and top interfaces. Therefore, only the amount of proximity effect is considered. The interface magnetization values were not small, i.e., the values were 301.7 emu/cm3 (for tPt = 0.25 nm) and 328.8 emu/cm3 (for tPt = 3.0 nm) for the as-deposited samples and 174.5 emu/cm3 (for tPt = 0.25 nm) and 143.5 emu/cm3 (for tPt = 3.0 nm) for the annealed samples.
Figure 3.

(a) Results for the M values as a function of the position in Co region at Pt thicknesses of 0.2 and 3.0 nm in the as-deposited and annealed samples. (b) Schematic illustration of the [Pt/Co/Pt] trilayers system (left) and the M values as a function of the position in the Co region (right).
These interface magnetization values due to the proximity effect can be converted into the magnetic moment possessed by one Pt atom magnetized using the following simple relation:
The magnetic moments obtained are in the range of 0.25 to 0.54 μB, which agree with the reported values16,17.
Estimation of impurity profiles in Co layer
Based on the magnetometry results and their analysis, a schematic showing the concentration of interpenetrated impurity atoms in the Co layer can be drawn as a function of its location if the following two simplifying assumptions are made. First, intermixing during sputtering occurs only at the Co/Pt interface. Second, for the samples with tPt = 0.25 nm, in addition to the Pt atoms, the Ru atoms (the capping layer), deposited on the top Pt layer, can penetrate the Co layer; this is likely as the Pt thickness is low. In this case, the penetration of Ru atoms is assumed to occur during the deposition of a 2.75 nm Ru capping layer so that the total thickness (3 nm) affecting the interpenetration can be identical to that of the sample with tPt = 3 nm. While converting the results of M into the impurity concentration, it is necessary to have information on the variation of Ms with respect to the concentration of the impurities (Pt and Ru); this has been detailed in20–22 for Pt and in23 for Ru. A simple linear assumption in the required composition range is considered reasonable for the following two reasons. First, Co can have an fcc structure for a very thin Co layer. Therefore, Co atoms are likely to be miscible with Pt with an fcc structure24–26. Second, the Co–Ru binary phase diagram indicates that the atoms are miscible in the range up to 6 at.% of Ru. An equation used for the conversion is as follows.
Here, Ms,Co and Ms,sample are, respectively, Ms values of a pure Co and the Co layer interpenetrated with impurity atoms. Aimputiry indicates the decrease of Ms with an addition of 1 atomic percent impurity, whereas Cimpurity denotes the impurity composition. Figure 4 shows the calculated results for the concentration of interpenetrated impurity atoms in the Co layer. The results are related to the position in the Co/Pt interface. As observed in Fig. 4, the concentration of interpenetrated impurities in the Co layer is not small. At the interface, the impurity level for the samples with tPt = 3.0 nm is as high as 37.2 at.% (as-deposited) or 43.7 at.% (annealed). The impurity level is lower for the sample with tPt = 0.25 nm, which is 14.5 at.% (as-deposited) or 16.2 at.% (annealed). The impurity concentrations of the annealed samples with tPt = 0.25 and 3.0 nm are higher than those of the as-deposited ones, indicating the diffusion of impurity atoms from the neighboring layers during annealing. Another possibility is the de-mixing of interpenetrated impurities from the deep region. The crossover occurs at positions of 0.2 and 0.5 nm for the samples with tPt = 0.25 and 3.0 nm, respectively. The crossover should depend on the amount of the interpenetrated atoms and the diffusion upon annealing. Although the crossover points are of interest, we do not performed a detailed analysis in this study, as our main concern is to know the level of impurity and its change upon annealing. As expected, the concentration of impurities decreases monotonically as it is located away from the interface. For example, at a position of 0.5 nm, which is relevant to the tCo value in [Pt/Co] multilayers with the inverted structure4,5, the impurity concentration is 23 at.% for the samples with tPt = 3.0 nm. In contrast, at the same position, the impurity concentration is estimated to be 8 at.% for the samples with tPt = 0.25 nm, which is an optimum Pt thickness in the inverted [Pt/Co] multilayers. This explains the deteriorating effect of the interpenetrated Pt atoms on the PMA strength of the [Pt/Co] multilayers.
Figure 4.
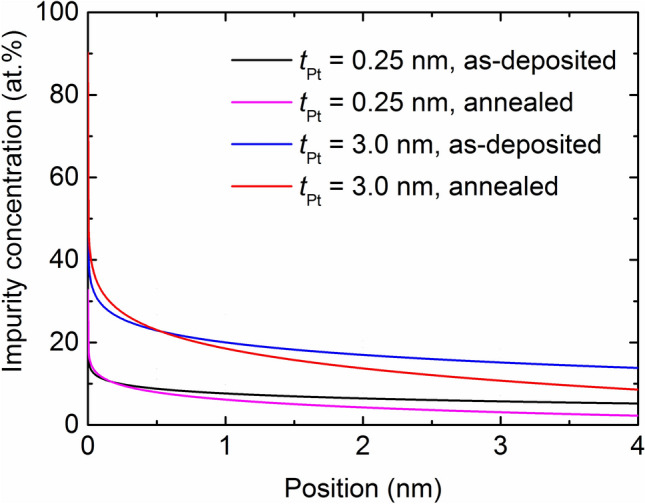
Results for the impurity (Pt or Ru or both) contents as a function of the position in the Co region at Pt thicknesses of 0.2 nm and 3.0 nm in the as-deposited and annealed samples.
Discussion
The effects of the top Pt layer thickness and annealing on the interface quality of [Pt/Co/Pt] trilayers were systematically investigated. Even with the cross-sectional HRTEM, it is difficult to identify the exact location of a very thin layer such as tPt = 0.25 nm. However, the HRTEM images, as shown in Fig. 1a–d, clearly show that the layer forms a continuous structure and its interfaces are atomically flat. These features are duly reflected by the magnetic properties and in this sense, the magnetometry can be a good tool to examine the interface properties of ultrathin magnetic films. From the MDL plots, the Co layer can be broken down into two parts that show different magnetic properties. In the high tCo range, a linear behavior was observed. However, a nonlinear behavior was observed in the low tCo range. Further, the proximity effect was detected in the low tCo range. The nonlinearity in the M values can be converted to the Co-layer impurity concentration by using an analytical equation. The interpenetration and inter-diffusion depth were found to be sensitive to tPt and the annealing process. Specifically, for the samples with tPt = 0.25 nm, the impurity concentrations near the top Co/Pt interface are significantly smaller than that for the samples with tPt = 3.0 nm. This explains the relationship between the interface quality and PMA strength of the [Pt/Co] multilayers system. Although the impurity levels can vary depending on the assumptions made earlier, the relative impurity level is minimally affected by these assumptions. Therefore, the magnetometric investigation of the interfacial properties will aid in analyzing the interface quality of the magnetic multilayers system.
Methods
The stack structure examined in this study consisted of the following: Si substrate (wet-oxidized)/Ta (5 nm)/Pt (10 nm)/Ru (30 nm)/Pt (3 nm)/Co (tCo)/Pt (tPt)/Ru (3 nm). The two variables were tCo (the thickness of the Co layer between the two Pt layers) and tPt (the thickness of the Pt layer on top of the Co layer). Thickness tCo varied between 0.5 and 10 nm, whereas tPt was fixed at 0.25 or 3 nm. The samples were fabricated using an ultrahigh vacuum magnetron sputtering system with a base pressure of 8 × 10⁻⁸ Torr. All the layers were deposited at a constant Ar pressure of 2 × 10⁻³ Torr. No specific substrate cooling or heating was applied during the sputtering process. The thicknesses of the constituent layers were measured using a surface profiler. The deposition rate of the layers was adjusted to ~ 0.03 nm/s by varying the sputtering power. This deposition rate was used to calculate the thicknesses of the layers. The samples were annealed at 400 °C for 1 h under a vacuum pressure of 1 × 10⁻⁶ Torr. The magnetic moment was measured using a vibrating sample magnetometer (VSM), and the microstructure was examined using high-resolution transmission electron microscopy (HRTEM).
Acknowledgements
This work was supported by the Creative Materials Discovery Program of the National Research Foundation of Korea (2015M3D1A1070465).
Author contributions
Y.C.W. carried out all the sample fabrications and magnetic and structural characterization. Y.C.W. and S.H.L. analysed the experimental data. Y.C.W. and S.H.L. prepared and designed the manuscript. Correspondence for materials should be addressed to S.H.L.
Competing interests
The authors declare no competing interests.
Footnotes
Publisher's note
Springer Nature remains neutral with regard to jurisdictional claims in published maps and institutional affiliations.
References
- 1.Mangin S, et al. Current-induced magnetization reversal in nanopillars with perpendicular anisotropy. Nat. Mater. 2006;5:210–215. doi: 10.1038/nmat1595. [DOI] [Google Scholar]
- 2.Ikeda S, et al. A perpendicular-anisotropy CoFeB-MgO magnetic tunnel junction. Nat. Mater. 2010;9:721–724. doi: 10.1038/nmat2804. [DOI] [PubMed] [Google Scholar]
- 3.Yakushiji K, et al. Ultrathin Co/Pt and Co/Pd superlattice films for MgO-based perpendicular magnetic tunnel junctions. Appl. Phys. Lett. 2010;97:232508. doi: 10.1063/1.3524230. [DOI] [Google Scholar]
- 4.Lee TY, Son DS, Lim SH, Lee SR. High post-annealing stability in [Pt/Co] multilayers. J. Appl. Phys. 2013;113:216102. doi: 10.1063/1.4809130. [DOI] [Google Scholar]
- 5.Lee TY, Won YC, Son DS, Lim SH, Lee SR. Effects of Co layer thickness and annealing temperature on the magnetic properties of inverted [Pt/Co] multilayers. J. Appl. Phys. 2013;114:173909. doi: 10.1063/1.4829024. [DOI] [Google Scholar]
- 6.den Broeder FJA, Hoving W, Bloemen PJH. Magnetic anisotropy of multilayers. J. Magn. Magn. Mater. 1991;93:562–570. doi: 10.1016/0304-8853(91)90404-X. [DOI] [Google Scholar]
- 7.Johnson MT, Bloemen PJH, Den Broeder FJA, De Vries JJ. Magnetic anisotropy in metallic multilayers. Rep. Prog. Phys. 1996;59:1409–1458. doi: 10.1088/0034-4885/59/11/002. [DOI] [Google Scholar]
- 8.Mattox DM. Handbook of Physical Vapor Deposition (PVD) Processing. 2. Elsevier; 2009. pp. 237–246. [Google Scholar]
- 9.Zarefy A, et al. Influence of Co layer thickness on the structural and magnetic properties of Pt/(CotCo)3/PttPt/IrMn multilayers. J. Phys. D. Appl. Phys. 2010;43:215004. doi: 10.1088/0022-3727/43/21/215004. [DOI] [Google Scholar]
- 10.Bandiera S, Sousa RR, Rodmacq BB, Dieny B. Asymmetric interfacial perpendicular magnetic anisotropy in Pt/Co/Pt trilayers. IEEE Magn. Lett. 2011;2:3000504. doi: 10.1109/LMAG.2011.2174032. [DOI] [Google Scholar]
- 11.Lee TY, Won YC, Son DS, Lim SH, Lee SR. Strength of perpendicular magnetic anisotropy at bottom and top interfaces in [Pt/Co/Pt] trilayers. IEEE Magn. Lett. 2014;5:1000104. doi: 10.1109/LMAG.2014.2321350. [DOI] [Google Scholar]
- 12.Bandiera S, Sousa RC, Rodmacq B, Dieny B. Enhancement of perpendicular magnetic anisotropy through reduction of Co-Pt interdiffusion in (Co/Pt) multilayers. Appl. Phys. Lett. 2012;100:142410. doi: 10.1063/1.3701585. [DOI] [Google Scholar]
- 13.Gweon HK, Lim SH. Relative strength of perpendicular magnetic anisotropy at bottom and top interfaces in Pt/Co/MgO trilayers. Jpn. J. Appl. Phys. 2018;57:030301. doi: 10.7567/JJAP.57.030301. [DOI] [Google Scholar]
- 14.Kong LT, Zhang RF, Li ZC, Liu BX. Magnetic properties of Co and Co-Ag alloys in equilibrium/nonequilibrium structures studied by ab initio calculations. Phys. Rev. B Condens. Matter Mater. Phys. 2003;68:134446. doi: 10.1103/PhysRevB.68.134446. [DOI] [Google Scholar]
- 15.Gweon HK, Yun SJ, Lim SH. A very large perpendicular magnetic anisotropy in Pt/Co/MgO trilayers fabricated by controlling the MgO sputtering power and its thickness. Sci. Rep. 2018;8:1266. doi: 10.1038/s41598-018-19656-9. [DOI] [PMC free article] [PubMed] [Google Scholar]
- 16.Lv QL, Cai JW, He SL, Sun L. Perpendicular magnetic anisotropy and magnetic proximity effect in Pt1-δFeδ/Co multilayer films. J. Magn. Magn. Mater. 2011;323:465–470. doi: 10.1016/j.jmmm.2010.09.048. [DOI] [Google Scholar]
- 17.Lu YM, et al. Pt magnetic polarization on Y3Fe5O12 and magnetotransport characteristics. Phys. Rev. Lett. 2013;110:147207. doi: 10.1103/PhysRevLett.110.147207. [DOI] [PubMed] [Google Scholar]
- 18.Mukhopadhyay A, et al. Asymmetric modification of the magnetic proximity effect in Pt/Co/Pt trilayers by the insertion of a Ta buffer layer. Phys. Rev. B. 2020;102:144435. doi: 10.1103/PhysRevB.102.144435. [DOI] [Google Scholar]
- 19.Kim DO, et al. Asymmetric magnetic proximity effect in a Pd/Co/Pd trilayer system. Sci. Rep. 2016;6:25391. doi: 10.1038/srep25391. [DOI] [PMC free article] [PubMed] [Google Scholar]
- 20.Weller D, Brandel H, Gorman G, Lin C-J, Notarys H. Magnetic and magneto–optical properties of cobalt–platinum alloys with perpendicular magnetic anisotropy. Appl. Phys. Lett. 1992;61:2726–2728. doi: 10.1063/1.108074. [DOI] [Google Scholar]
- 21.Kikuchi N, et al. Influence of 5d transition elements on the magnetocrystalline anisotropy of hcp-Co. J. Phys. Condens. Matter. 1999;11:L485. doi: 10.1088/0953-8984/11/43/103. [DOI] [Google Scholar]
- 22.Shimatsu T, et al. Large uniaxial magnetic anisotropy by lattice deformation in CoPt/Ru perpendicular films. J. Appl. Phys. 2006;99:08G908. doi: 10.1063/1.2167351. [DOI] [Google Scholar]
- 23.Idigoras O, Palomares U, Suszka AK, Fallarino L, Berger A. Magnetic properties of room temperature grown epitaxial Co1-xRux-alloy films. Appl. Phys. Lett. 2013;103:102410. doi: 10.1063/1.4820189. [DOI] [Google Scholar]
- 24.Weller D, et al. Structural transitions and magnetic anisotropy in ultrathin Co wedges on Pt(111) investigated with the magneto-optical Kerr effect. J. Phys. Chem. Solids. 1995;56:1563–1566. doi: 10.1016/0022-3697(95)00129-8. [DOI] [Google Scholar]
- 25.Rooney PW, Shapiro AL, Tran MQ, Hellman F. Evidence of a surface-mediated magnetically induced miscibility gap in Co-Pt alloy thin films. Phys. Rev. Lett. 1995;75:1843–1846. doi: 10.1103/PhysRevLett.75.1843. [DOI] [PubMed] [Google Scholar]
- 26.Rath C, Prieto J. Hcp-to-fcc stacking switch in thin cobalt films induced by Cu capping. Phys. Rev. B Condens. Matter Mater. Phys. 1997;55:10791–10799. doi: 10.1103/PhysRevB.55.10791. [DOI] [Google Scholar]