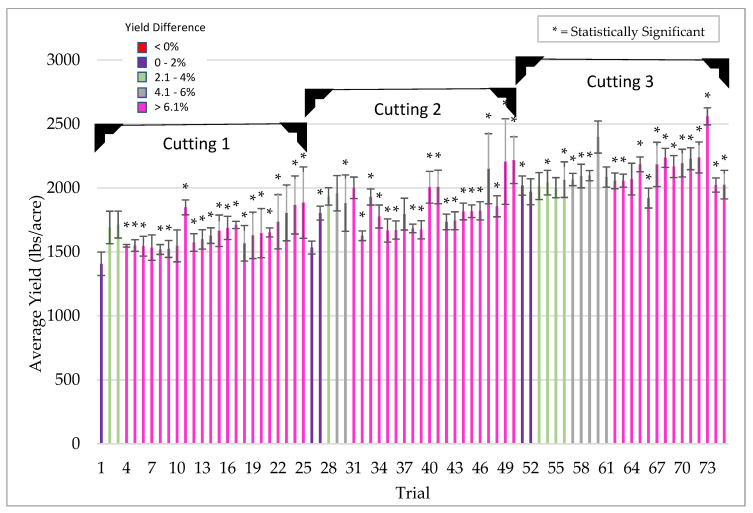
Figure 10.
Alfalfa yield response of treated (ThMS3a) vs untreated controls plants under low stress conditions. From 2016–2020, 75 trials were performed in four US states (WI, SD, NV, AZ) on commercial varieties with standard PPP’s. Each bar is a separate trial and plots sizes varied from 10 ft × 50 ft to 10 acres with 4–8 replications/trial. In each trial, there were three successive cuttings every 1–1.5 months and is indicated as the average yield (lbs/acre). Bars are color coded according to yield differences indicated in the legend (upper left of graph). Bars with an asterisk symbol (*) indicate yield significance (t test, p-value < 0.05). Cooperators: farmers, CRO’s, universities.

