Abstract
Rhus chinensis Mill. is a traditional Chinese medicine (TCM) which is commonly used for cancer treatments. Our previous work had proven that triterpenoids of Rhus chinensis (TER) could effectively regulate glycolysis involved in colorectal cancer (CRC) and play an important role in the prevention of T-cells dysfunction. This study aimed to systematically investigate the effects and mechanisms of TER on glucose metabolism in CRC, while the regulatory mechanisms of TER on restoring T-cells function and activity in CRC were explored as well. The extract of triterpenoids from Rhus chinensis was obtained, and production of lactic acid and glucose uptake were assayed. Also, the expression of CD8+ T-cells surface markers, cytokines secreted by CD8+ T cells, and the expression of key glycolytic enzymes and glucose deprivation induced by tumor cells were further examined. Notably, results showed that TER prevented the dysfunction in CD8+ T cells by enhancing mTOR activity and subsequent cellular metabolism. Furthermore, our findings also demonstrated that TER promoted glycolytic gene expression in CD8+ T cells in vivo, and significantly inhibited tumor growth. Altogether, our studies suggested that TER not only reversed effector CD8+ T-cells dysfunction and enhanced T-cells recognition, but also improved tumor microenvironment, thereby providing new insight into the prevention and treatment of CRC with TCM.
Keywords: colorectal cancer, Rhus chinensis Mill, triterpenoids, glycolysis, CD8+ T-cells
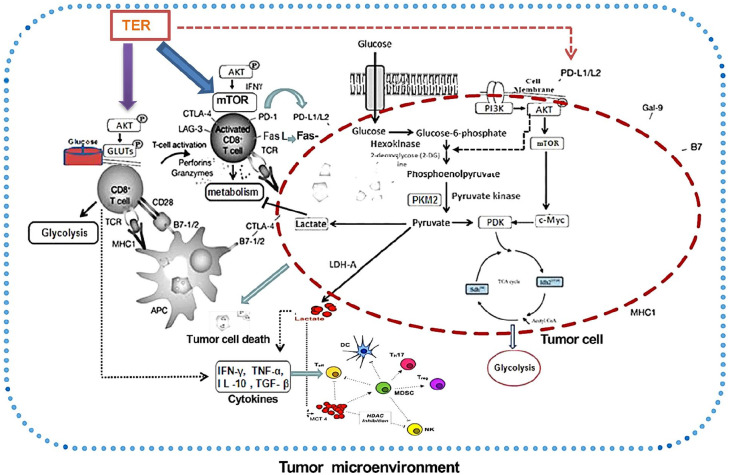
Graphical Abstract.
Introduction
Previous studies had shown that the etiology and pathogenesis of colorectal cancer (CRC) were closely related to the dysregulated cell metabolism, which played a key role in tumor initiation and immune system regulation, particularly affecting T-cell functions.1 Moreover, the dysregulation of glycolytic enzymes activity and glucose deprivation induced by tumor cells were associated with tumor progression, and most of them disturbed T-cell glycolysis as well.2 Furthermore, CD8+ T-cells were one of the most important immune cells in tumor immunity, while the acidic microenvironment caused by abnormal glucose metabolism in the tumor in turn weakened the immune surveillance and immune defense functions of CD8+ T-cells, ultimately leading to the malignant development of cancer.3
Triterpenoids derived from Chinese herbal medicines have been demonstrated to be a very promising drug candidate against cancer. Studies suggested that triterpenoids not only enhanced the effector cell-mediated immune response, antigen presentation, and T-cell recognition, but also reversed the tumor acidic microenvironment.4 Rhus chinensis is a Chinese herbal medicine used for cancer treatments in some regions of China, and mainly contains triterpenoids, tannins, flavonoids, and other components.5-7 Our previous study had confirmed the capacity of triterpenoids of Rhus chinensis (TER) to regulate the level of glycolysis and lactic acid metabolism in the formation of acidic products.8 However, the mechanism of TER’s anti-cancer effects underlying the regulation of acidic microenvironment and CD8+ T-cells activity remained vague.
In the present study, the effects and mechanisms of TER on the glycolytic enzymes and glucose deprivation induced by CRC cells, which affected T-cell glycolysis and immunogenic functions were expored. This study further investigated the effects of TER in preventing the inactivity of T-cells, such as anergy and exhaustion. Also, the mechanism of how to maintain the T-cells functions by limiting mTORC1 activity and subsequent cellular metabolism, and whether TER prevented CD8+ T-cells dysfunction via targeting PD-L1/mTORC1 and PKM2 were studied.
Materials and Methods
Reagents and Antibodies
Betulonic acid (BTOA, PubChem CID: 122844), betulin (BT, PubChem CID:72326), and betulinic acid (BTA, PubChem CID: 64971) were purchased from the National Institute for the Control of Pharmaceutical and Biological Products (NICPBP, Beijing, China). 2-deoxy-D-glucose (2-DG) was bought from Wako Chemicals (Osaka, Japan). Fetal bovine serum (FBS), trypsin-EDTA, Dulbecco’s modified Eagle’s medium (DMEM), L-glutamine, and penicillin-streptomycin were supplied by the GIBCO BRL (Invitrogen Corp., Carlsbad, CA, USA). Cell Counting Kit-8 (CCK-8) was acquired from Dojindo Laboratories (Tokyo, Japan). Both Annexin V and pyridine iodide (PI) were provided by Sigma Chemical Co. (St. Louis, MO, USA). Antibodies used for intracellular and cell-surface staining were as follows: anti-IFN-γ-allophycocyanin (APC) mAb (BD Bioscience, San Jose, CA, USA), anti-IFN-γ-fluorescein isothiocyanate (FITC) mAb (BD Bioscience), anti-TNF-α-fluorescein isothiocyanate (FITC) mAb (BD Bioscience), anti-TGF-β-fluorescein isothiocyanate (FITC) mAb (BD Bioscience), IL-10-APC mAb (TONBO Biosciences, San Diego, CA, USA), anti-Phospho-S6 (Ser240/244) Alexa Fluor 647 mAb (Cell Signaling Technology), anti-AKT-PE mAb (TONBO Biosciences), anti-GLUT1-PE mAb (BioLegend, San Diego, CA, USA), anti-Granzyme B-PE mAb and anti-PD-1-PE mAb (BD Bioscience), anti-CD28 antibodies, Gal9 PerCP, TIM3 FITC, and LAG3 PerCP were obtained from Bio-Legend (San Diego, CA, USA). The antibodies for Western blotting were used as follows: anti-Akt Ab (Cell Signaling Technology), anti-Phospho-Akt (Ser473) Ab (Cell Signaling Technology), anti-Phospho-Akt (Thr308) Ab (Cell Signaling Technology), anti-mTOR pAb (Cell Signaling Technology), anti-PD-L1 mAb, anti-PD-L2 mAb, anti-Rictor mAb, and anti- Raptor mAb, were supplied by Santa Cruz Biotechnology (Santa Cruz, CA, USA). Anti-PDK1 mAb was supplised by Active Motif, Carlsbad, CA, USA; anti-LDHA pAb was supplied by Abcam, Cambridge, CA, USA; anti-PKM2 pAb, anti-GUT1 mAb, anti-c-myc mAb, and anti-HK2 mAb, anti-IFN-γ mAb, anti-GZMB mAb, anti-β-Actin and anti-α-tubulin were supplied by Cell Signaling Technology. The bicinchoninic acid (BCA) protein assay kit was purchased from Thermo Scientific (Rockford, IL, USA). The anti-bodies were diluted by 50 times for flow cytometry analysis and by 1000 times for immunoblotting, respectively.
Extraction of Triterpenoid from Rhus chinensis
The Rhus chinensis Mill. (Anacardiaceae) plant material was obtained from Jiangsu University of the College of Pharmacy and was identified by Prof. Jin Gao. The plants were collected at Jiujiang City, Jiangxi Province, China, on December 11, 2016. This specimen was stored in the Center of the Plant Specimen at Jiangsu University for study on herbal medicine (Registration number: Jiaoxuebiaoben-2619C0009V000 2016). Dried roots and stems were ground to powders through an 80 mesh sieve, and the powders were extracted with 60% ethanol by a liquid-liquid extraction method. Briefly, 100 g crushed powders from the branches and stems were extracted with 2000 mL 60% ethanol for 5 hours at 90°C. Then, the alcohol extract was ultrasonicated for 1 hour after 5 hours of heating extraction. The samples were applied to a suction filter, and then to stress to concentrate the filtrate at 50°C. This process was repeated twice and the concentrate was combined. The concentrate was then extracted with dichloromethane, ethyl acetate, n-butanol, and petroleum ether.
Dichloromethane extraction was performed on an aliquot of the 300 to 400 mesh mixed sample, after drying, using a wet packing column (the maximum absorption quantity was 1.15 g herbs per mL macroporous resin) and eluted with 95% ethanol (elution volumes, 10-20 BV). Mother liquor of 95% ethanol was partially centrifuged and then extracted with ethanol to remove the insoluble fraction. The reversed-phase C-18 silica gel chromatography column was used to separate and purify after adjustment to appropriate concentration. The methylene chloride methanol 50:1 gradient elution was used, and the 15:1 fraction was collected as the sample of triterpenoid extract.
Ingredient Identification
For high-performance liquid chromatography (HPLC) analysis, the HPLC system (Shimadzu LC-10AT; Shimadzu Corporation, Japan) was applied and absorption wavelength was 205 nm. The separations were performed on a Diomand C18 column (150 × 3.2 mm, 5 µm). A mixed gradient solvent system of deionized water (eluent A)-acetonitrile (eluent B)-1.0% (v/v) with phosphoric acid in water (eluent C) was used. Using a flow rate of 0.8 mL/min, the absorbance was measured at 365 nm wavelength. Before application, all the test solutions were filtered through the 0.2 µm Millex nylon membrane syringe filters. The content of triterpenoids was calculated by standard substance curves and characterized using HPLC spectrometry analysis. The main components of TER were evaluated using ultra high performance liquid chromatography (UHPLC) tandem mass spectrometry analysis, via Thermo fisher U3000 UHPLC and Thermo Scientific Q active mass spectrometer with ESI source and the parameters were as follow: mobile phase (A) acetonitrile and (B) water (0.1% formic acid) = 89:11; injection volume 1.0 μL; column temperature 20°C; and gradient elution mode. The running time was from 0 to 20 minutes. The UPLC system consisted of an Acquity UPLC HSS T3 column (2.1 × 100 mm, 1.8 μm) (Waters, USA) with a flow rate of 0.3 mL/min.
Tumor Cell Culture
DLD1 and CT26 colon carcinoma cell lines were obtained from American Type Culture Collection (ATCC; Manassas, VA, USA). The cells were cultured in DMEM with 10% FBS and penicillin/streptomycin (100 U/mL) in a humidified atmosphere at 37°C and 5% CO2.
Assay of Lactic Acid Level and Glucose Uptake
For lactic acid detection, TER and BTA were used to treat DLD1 or CT26 cells for 48 hours, and the media was collected to determine the production of lactic acid using a detection kit (Randox Laboratories Co. Ltd., United Kingdom) with 0.1% DMSO as a control. The amount of lactic acid was measured with a spectrophotometer at absorption wavelength of 570 nm (Thermo, Waltham, MA). The DLD1 or CT26 cells were trypsinized with dilutions in deionized water after being treated with TER, or BTA alone, while the glucose level was measured with Glucose Uptake Cell-Based Assay Kit in order to determine the rate of glucose uptake (Cayman Chemicals, Ann Arbor, MI). Methods for detecting lactic acid level were used according to published studies.9,10 Briefly, DLD1 or CT26 cells were extracted in glycylglycine buffer (pH = 7.4) after treatment. The supernatant was centrifuged at 12 000g for 10 minutes. Then, the reaction medium was mixed with supernatant samples and was measured immediately at 560 nm. The reference standards were used for comparison to all the absorbance values.
Isolation of Murine Splenocytes
Spleens obtained from 8 to 12-week-old male BALB/c nude mice were excised and transferred to 5 mL ice-cold RPMI 1640 medium without FBS. Tissue was ground over a nylon cell strainer (70 µm; BD Biosciences, Heidelberg, Germany). The cell suspensions were centrifuged at 500g for 5 minutes at 4°C and resuspended in 2 mL 0.83% NH4Cl for 2 minutes at room temperature. Red blood cell lysis was inhibited via adding cold RPMI 1640 medium without FBS. Splenocytes were prepared by centrifugation, washed once with RPMI 1640 and resuspended in RPMI 1640, supplemented with 10% heat-inactivated FBS, 100 U/mL penicillin and 100 µg/mL streptomycin. Next, cells were seeded in 24 well polystyrene plates (Greiner) with 0.5 mL media at a concentration of 6 × 10⁶ cells/mL.
T-cells Purification and Stimulation
Murine splenocytes were cultured in complete RPMI 1640 with 10% FBS, 1% Pen-Strep and stimulated by adding anti-CD3 with or without anti-CD28 to the cell cultures (eBioscience). For some selected experiments, murine splenocytes were cultured with 0.03 μg/mL IFN-γ (eBioscience). In some cases, T-cells were purified using T-cell isolation kits (Miltenyi Biotec) and stimulated with plate-bound anti-CD3 and anti-CD28 (eBioscience) or anti-CD3, anti-CD2 and anti-CD28 coated beads (Miltenyi Biotec).
CD8+ T-cell Stimulation and Analysis In Vitro
The CD8+ T-cells were isolated from spleens by magnetic bead separation (Miltenyi) and cultured under standard conditions. Then, the CD8+ T-cells were incubated in the absence or presence of L-lactic acid (Sigma-Aldrich) or HCl or sodium L-lactate (Sigma-Aldrich). For cytokine and IFN-γ mRNA expression analysis, the cells were stimulated with 20 ng/mL phorbol-12-myristate-13-acetate (PMA, Calbio-Chem) and 1 M Ionomycin (Enzo Biochem) for 3 hours. The CD8+ T-cells were cultured with or without 2 ng/mL murine IFN-γ for the co-culture experiments. After 24 hours, the stimulated CD8+ T-cells were added for cultivation with tumor cells.
Cultivation of CD8+ T-cells and Tumor Cells
The CD8+ T-cells were seeded on 6-well polystyrene plates (Greiner) at a density of 2.5 × 10⁶ cells/mL and were cultured in RPMI 1640 (Life Technologies) supplemented with 100 U/mL penicillin, 100 µg/mL streptomycin, and 10% heat-inactivated FCS (Life Technologies). Next, the CT26 colon carcinoma cells were plated on 6-well polystyrene plates and were maintained in DMEM supplemented with 100 U/mL penicillin, 100 µg/mL streptomycin, and 10% heat-inactivated FBS. Based on the protocol employed, the CD8+ T-cells were cultivated in parallel at 30°C, 33°C, or 37°C incubator temperatures, which were switched occasionally in order to exclude incubator effects on cell behavior different from incubator temperature.
Then, the CD8+ T-cells were added for the cultivation with CT26 tumor cells (CC-CD8+ T-cells), and individual culture of CD8+ T-cells (IC-CD8+ T cells) without cultivation of CT26 tumor cells.
Flow Cytometry
The expression of CD8+ T-cell surface markers was measured by flow cytometry (MacsQuant, Miltenyi Biotec). The following anti-mouse antibodies were used: CD8 Peridinin chlorophyll (PerCP; all Miltenyi Biotec), CD28 Allophycocyanin (APC), IFN-γ FITC, and IL-10 FITC. The CD8+ T-cells were differentiated in vitro and stimulated with an immobilized anti-TCR-β mAb (3 μg/mL, BioLegend) for 16 hours with monensin (2 μM, Sigma-Aldrich, St. Louis, MO, USA) for the intracellular staining of cytokines. Next, intracellular cytokine production was measured after 5-hour stimulation with PMA (50 ng/mL, Sigma-Aldrich) and ionomycin (750 ng/mL, Calbiochem) in the presence of GolgiPlug (eBioscience). The cells were permeabilized with Cytofix/Cytoperm Plus (BD) and stained with PE and APC antibodies. Transcription factor staining was performed using the Mouse Regulatory T-cells Staining Kit (eBioscience) and PE antibodies (eBioscience). The cell proliferation was measured using Cell Trace Violet (CTV; Invitrogen).
Subsequently, the intracellular staining was performed by FACS analysis, and intracellular staining was performed using the FITC-labeled anti-antibodies: anti-AKT, anti-Granzyme B, Gal9 PerCP, PD-1 APC, TIM3 APC, LAG3 PE, CD8 PerCP, CD8 APC, and CD28 PE (all eBioscience). During the intracellular staining of GLUT1, HK2, and phosphorylated S6 ribosomal proteins, the CD8+ T-cells were fixed and permeabilized with BD Phosflow Lyse/Fix Buffer (BD Bioscience) and BD Phosflow Perm III (BD Bioscience) in accordance with the manufacturer’s instructions. Flow cytometry was performed with a FACS Caliber instrument (BD Biosciences) and Gallios instrument (Beckman Coulter, CA, USA), and the results were analyzed using the FlowJo software program (Tree Star, Ashland, OR, USA).
Metabolic Assays of CD8+ T-cells
The glycolysis measurements were normalized to cell number as described earlier.11 Glucose uptake was measured using fluorescent glucose analog 2-[N-(7-nitrobenz-2-oxa-1,3- diazol-4-yl) amino]-2-deoxy-D-glucose (2-NBDG) as reported previously.12 Briefly, the CD8+ T-cells were pulsed with 50 μM 2-NBDG (Thermo Fisher Scientific) in no-glucose media (Wako Chemicals) for 30 minutes at 37°C, while the incorporation of 2-NBDG into the cells was assessed by flow cytometry.
Enzyme-Linked Immunosorbent Assay (ELISA) on Cytokine of CD8+ T-cells
The cytokines secreted by CD8+ T-cells were determined via ELISA according to the specifications of the manufacturer. The cells were stimulated with an immobilized anti-TCR-β mAb (3 μL/mL) for 16 hours. The concentrations of cytokines were determined using commercial ELISA kits (IL-10 and TNF-α, TGF-β; R&D Systems). The concentration of IFN-γ in the supernatants was determined as described previously after TER treatment in 1, 2, and 3 days.
Real-Time PCR Analysis
The total RNA of cells was isolated with TRIzol reagent (Thermofisher). Next, the cDNA was synthesized with a Bio-Rad iScript Reverse Transcription Supermix for RT-qPCR. The expressions of LDHA, IFN-γ, and granzyme B (GZMB) were detected via an SsoAdvanced™ Universal SYBR® Green Supermix, using the following primers: LDHA: The forward primer was 5′-ATGGCAACTCTA AAGGATCAGC-3′ and the reverse primer was 5′-CCAACCCCAACAACTGTAATCT-3′; IFN-γ: The forward primer was 5′-TCGGTAACTGACTTGAATGTCCA-3′, and the reverse primer was 5′-TCGCTTCCCTGTTTTAGCTGC-3′; GZMB: The forward primer was 5′-CCCTGGGAAAACA CTCACACA-3′, and the reverse primer was 5′-GCACAACTCAATGGTACTGTCG-3′; and β-actin: The forward primer was 5′-CATGTACGTTGCTATCCAGGC-3′, and the reverse primer was 5′-CTCCTTAATGTCACGCACGAT-3′. The relative expressions of the genes were calculated using the 2−ΔΔCt methods.
Western Blotting
The proteins were extracted from tissues or cultured cells using RIPA buffer containing phenylmethane-sulfonylfluoride (Beyotime, Nantong, China). Next, equal amounts of protein (100 µg) were separated by SDS-PAGE on a 8.0% to 12.0% gel and transferred to a polyvinylidene difluoride membrane. Primary polyclonal antibodies were: anti-Akt, anti-Phospho-Akt (Ser473), anti-Phospho-Akt (Thr308), anti-Phospho-mTOR (ser2448), anti-mTOR, anti-PD-L1, anti-PD-L2, anti-Rictor, anti-Raptor, anti-PDK1, anti-LDHA, anti- PKM2, anti-GUT1, anti-c-myc and anti- HK2, anti-IFN-γ, anti-GZMB mAb, anti-β-Actin, and anti-α-tubulin. The secondary antibodies used for this study were horseradish-peroxidase-conjugated anti-rabbit or anti-mouse antibodies (Santa Cruz Biotechnology). The blots were developed using ECL reagent (Millipore, Billerica, MA, USA). An equal amount of loaded protein in each lane was confirmed using a β-actin antibody, while protein signals were detected with the ECL detection system (Pierce Biotechonology, Rockford, IL, USA).
In Vivo Mouse experiments
Male BALB/c nude mice (8-12 weeks old) were obtained from Laboratory Animal Center of Putuo Hospital, Shanghai University of Traditional Chinese Medicine. Mice were housed at room temperature around 23°C ± 2°C, alternating 12 hours light-dark cycle, with food and water ad libitum.
CT26 cells (2 × 10⁶ cells per mouse) were suspended in PBS and injected into the right flank of mouse, and the tumor growth was regularly monitored. Once the tumor was accessible (approximately 100 mm3), the mice were randomized into 4 groups (5 mice per group). The groups were as follows: (1) nutrient-rich vehicle group, normally fed and administered with saline i.p. daily; (2) TER group, normally fed and administered with 25 mg/kg TER i.p. daily; (3) BTOA group, fed normal food intake and administered with 25 mg/kg BTOA i.p. daily; and (4) BTA group, fed normal food intake and administered with 25 mg/kg BTA i.p. daily.
The tumors were measured daily with a caliper while the tumor volume was calculated using the formula: (a × b2)/2, where “a” is the smallest diameter and “b” is the diameter perpendicular to “a.” Also, the general health of other indicators, such as feeding behavior, weight, and motor activity of each animal were monitored. Two weeks after the administration of triterpenoids or saline, the mice were were euthanized by an intravenous (IV) injection of 10% potassium chloride (100 mg/kg) under anesthesia (10% chloral hydrate 350 mg/kg). Animal death was verified by indicating mouse is either alive or respiratory arrest or cardiac arrest was observed for 15 minutes after euthanasia, while the tumor xenografts were immediately weighed and fixed for storage.
Statistical Analysis
Statistical analyses were carried out using Prism 5.0 (GraphPad, La Jolla, CA, USA). Data were presented as median or means ± standard deviation.The D’Agostino–Pearson normality test was used to assess data distribution. Statistical analysis was performed on raw data as indicated in the legends using 1-way ANOVA with post hoc Bonferroni correction, unpaired Student’s t-test, or Mann–Whitney U-test. The diferences between groups were considered signifcant when P value <.05.
Results
Identification of TER
An UPLC-MS is a kind of intelligent, reliable, and accurate technique for identifying the chemical compositions in Chinese medicines. In this work, the ingredients of TER were identified with HPLC/UPLC-MS. The top 4 compounds of TER identified were BTA, 1.07 mg/mL BTOA, 5.49 mg/mL, BT, 6.32 mg/mL, and semialactic acid (10.49 mg/mL). These 4 compounds in TER were compared with the retention time and accurate quality standard substances for further characterization (see Supplemental Material for the ingredients of TER).
TER Inhibited Glycolysis in CRC Cells
As BTA was a compound identified and described in the TER, it might be related to the glycolysis in tumor cells. For lactic acid detection, TER and BTA were used to treat DLD1 and CT26 cells for 48 hours. The influence of TER or triterpenoid on aerobic glycolysis of colon carcinoma cells was investigated. Both TER and BTA inhibited glucose uptake and lactic acid production in the DLD1 and CT26 cells (Figure 1A and B).
Figure 1.
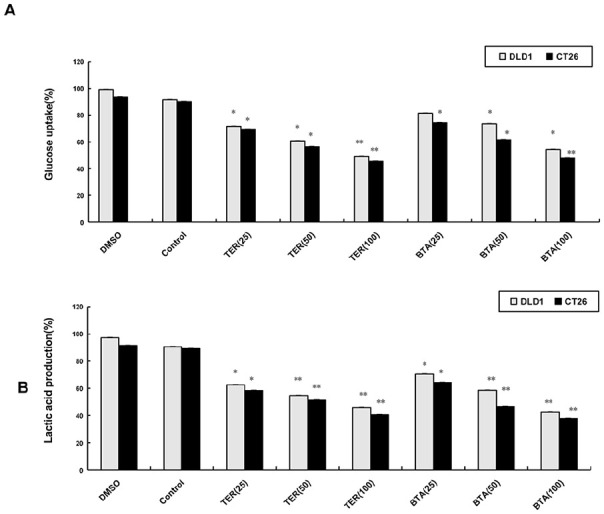
The influence of TER on glycolysis of CRC cells. (A) DLD1 and CT26 cells grown on coverslips were treated with TER (25, 50, and 100 μg/mL), or BTA (25, 50, and 100 µM) alone. The glucose uptake was determined with glucose uptake cell-based assay kit. (B) The lactic acid production was measured by a spectrophotometer. The data are presented as the means ± SD.
*P < .05. **P < .01 compared with the control group.
Expression of PD-L1/PD-L2 and Rictor and Raptor Protein in Tumor Cells
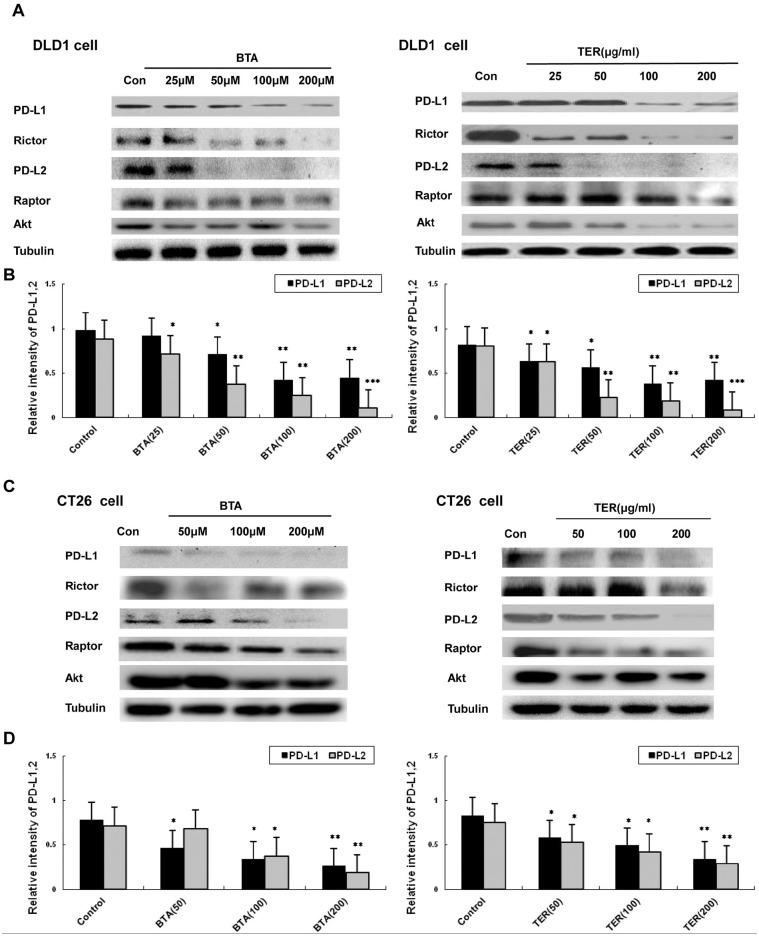
In order to test whether TER or BTA regulated the expression of PD-L1/PD-L2 and mTOR complex related proteins of Rictor and Raptor in the CRC cells, PD-L1 expression was first measured. The result revealed that the expression of PD-L1 was significantly down-regulated by TER or BTA in DLD1 cells compared with the control group (Figure 2A and B). According to investigation on different cell types, the expression of PD-L2 was similar in different types of tumor cells, and the high expression of PD-L2 was both observed in the DLD1 and CT26 CRC cells. Western blot analysis revealed that, in DLD1 and CT26 cells, PD-L2 expressions were significantly down-regulated by TER or BTA treatment (Figure 2C and D), suggesting that the dysregulated expression of PD-L1 and PD-L2 could be down-regulated by TER or BTA.
Figure 2.
The expressions of PD-L1, PD-L2, and Akt/mTORC in CRC cells. (A and B) Expression levels of PD-L1, PD-L2, and expressions of total amount of mTOR and total Akt were detected by Western blot analysis in DLD1 cells. (C and D) The expressions of PD-L1, PD-L2, and total amount of mTOR and total Akt in CT26 cells, and levels of glycolytic proteins and genes were detected by western blot. n = 3 and data was presented as means ± SD.
*P < .05. **P < .01. ***P < .001 compared with the control group.
Glucose and glucose-derived acetyl-CoA, which promoted the acetylation of Rictor protein, a protein component of mTORC2. Rictor protein is essential for mTORC2 activity and Raptor is unique to mTORC1. In this study we found that DLD1 and CT26 tumor cells expressed high levels of Rictor protein, while BTA significantly decreased the levels of Rictor protein. Also, TER could down-regulate Rictor protein at the concentrations of 100 to 200 μg/mL, suggesting that the tumor expression of Rictor protein asscociated with glycolysis was regulated by TER (Figure 2C). Moreover, the down-regulation of the expression of Raptor protein was induced by TER. Altogether, the mTOR complex (mTORC 1 and 2) is associated with Rictor and Raptor, which were down-regulated by TER treatment in DLD1 or CT26 tumor cells. Furthermore, the amount of tolal Akt was slightly decreased by TER in DLD1 or CT26 tumor cells.
TER Inhibited the Glycolytic Targets
To test whether glycolytic proteins expressions in the CT26 cells were regulated by TER, glycolytic proteins were detected in the CT26 cells treated with TER. As shown in Figure 3, TER at different concentrations (100-200 μg/mL) significantly inhibited the expression of hexokinase 2 (HK2) in the CT26 cells in a dose-dependent manner, while BTA (100-200 μM) inhibited the expression of HK2 without dose-dependence (Figure 3A). The glycolytic proteins such as glucose transporter GLUT-1, lactate dehydrogenase A (LDHA), HK2, PKM2, C-myc, and PDK1 (Figure 3A-D), which were TCA cycle related genes, were partially inhibited by TER or BTA. 2-DG had also been reported to inhibit glycolysis via TCA, and the highly glycolytic metabolic profile in the CT26 CRC cells was restrained by TER or BTA, indicating that TER or BTA was involved in the TCA-mediated activation of the glycolysis in CT26 tumor cells.
Figure 3.
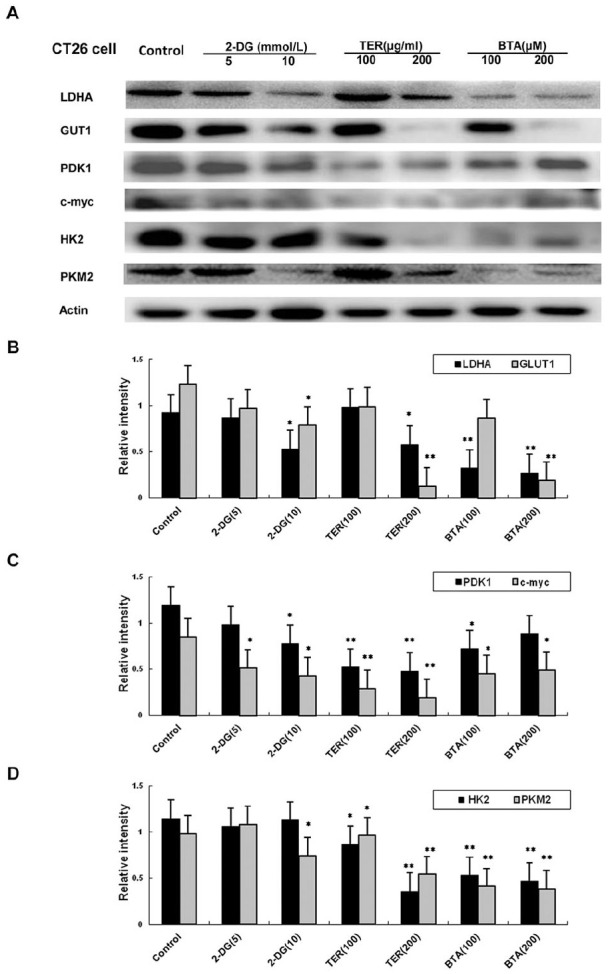
Expression of glycolytic genes in CT26 cells. (A) Glycolytic dependent genes (LDHA, GLUT-1, HK2,PKM2, c-myc, and PDK1, β-Actin to detect the levels of glycolytic proteins and genes by western blot. (B) The expressions of LDHA, GLUT-1 regulated by TER treatment in CT26 tumor cells. (C) The expressions of c-myc, and PDK1 regulated by TER treatment in CT26 tumor cells. (D) The expressions of HK2,PKM2 regulated by TER treatment in CT26 tumor cells, and levels of glycolytic proteins and genes were detected by western blot. n = 3 and data was presented as means ± SD.
*P < 0.05, **P < 0.01 compared with the control group.
TER Promoted the Metabolic Process of CD8+ T-cell
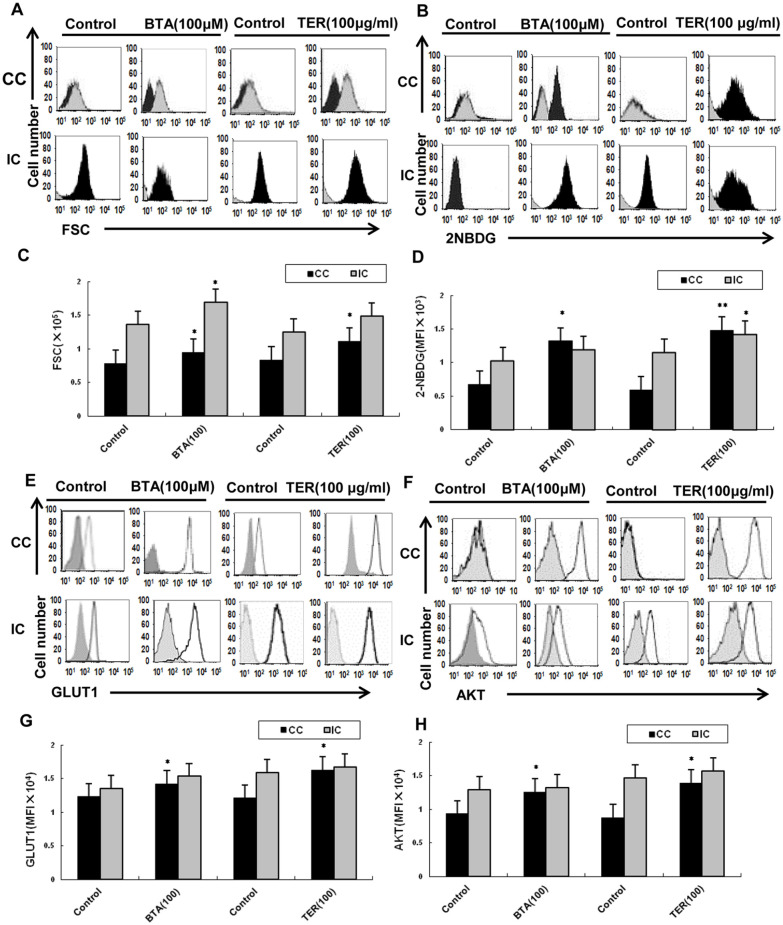
Since Akt-mediated GLUT1 signaling was a metabolic cue for proper maintenance and activation of T-cells,9,13,14 we detected whether TER could regulate the metabolic process via this signaling in effector T-cells. The results showed that the proliferative capacity of CC-CD8+ T-cells (co-culturing of CT26 cells with CD8+ T-cells) was reduced, and incapable of robust proliferation upon CC-CD8+ T-cells versus IC-CD8+ T-cells (individual culture CD8+ T-cells without cultivation of CT26 cells) in vitro. Moreover, the tumor microenvironment contributed to the metabolic dysfunction of T-cells: our results showed that the CC-CD8+ T-cells were affected and failed to increase the cell size and glucose uptake upon co-culturing of CT26 cells in vitro, compared to the IC-CD8+ T-cells which showed elevated stimulation-induced glucose uptake and cell size. The proliferative capacity of CC-CD8 T-cells rapidly increased and they acquired effector functions from TER treatment, compared with IC-CD8 T-cells in vitro (Figure 4A and C). More importantly, the proliferative capacity of CD8+ T-cells was increased with the restoration of CC-CD8+ T-cell function after treating with TER. Moreover, the incorporation of 2-NBDG in CC-CD8+ T-cells was partially promoted by TER or BTA, (Figure 4B and D). Altogether, both the proliferative capacity and incorporation of 2-NBDG in CC-CD8+ T-cells were partially promoted by TER or BTA.
Figure 4.
CD8+ T-cells metabolic process regulated by TER in vitro. (A and C) The CD8+ T-cells that were isolated from CT26 tumor-bearing murine splenocytes were co-cultured with CT26 cells (CC-CD8+ T cells), and IC-CD8+ T-cells were cultured without CT26 cells. The proliferative capacity of CC-CD8+ T-cells increased and acquired effector functions after TER treatment, compared with IC-CD8+ T-cells in vitro. (B and D) 2-NBDG incorporation. (E-H) GLUT-1, total Akt protein were analyzed by flow cytometry in TER treatment. Glucose uptake and cell size was measured by flow cytometry. Data were representative of 2 samples, each pooled from CC-CD8+ T-cells or IC-CD8+ T-cells. Data are means ± SD.
*P < .05. **P < .01.
Furthermore, this study explored the effect of TER on glycolysis up-regulation in the CD8+ T-cells via Akt-mediated GLUT1 signaling. Compared with the control, TER or BTA stimulated CD8+ T-cells to increase GLUT1 and activate the Akt in the CC-CD8+ T-cells (Figure 4E and F). Altogether, these results indicated that TER was involved in the GLUT1 and Akt mediated activation of the CD8+ T-cells in the tumor microenvironment of CRC cells (Figure 4G and H).
Effect of TER on Akt/mTOR Signaling in Effector T-cells
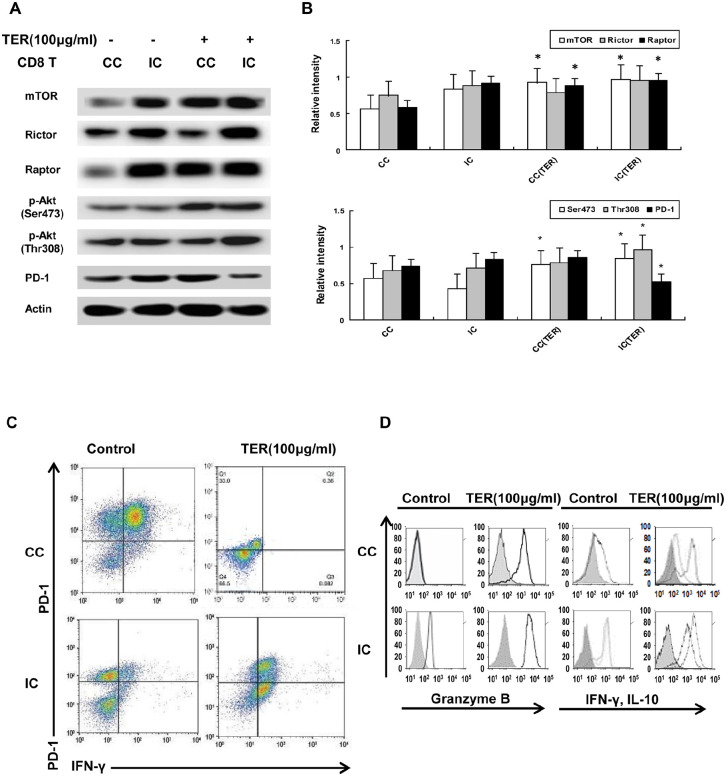
To ascertain whether the inhibitory glycolysis in T-cells attributed to the Akt/mTOR signaling could be regulated by TER, the effect of TER on the activity of CD8+ T-cells was further investigated. According to results, the total amount of mTOR and phosphorylation of Akt substrates (Ser473 and Thr308) was upregulated by TER treatment in the CC-CD8+ T-cells, compared with the control (Figure 5A and B). Furthermore, the mTORC complex1 (mTORC1, Raptor protein) and the expression of p-Akt (Ser473) was upregulated by TER in the CC-CD8+ T-cells. In comparison, treatment with TER upregulated the expressions of mTORC1 and p-Akt (Ser473 and Thr308) in the IC-CD8+ T-cells. Consequently, we verified the effect of TER in upregulating the Akt/mTORC1 signaling in CD8+ T-cells in the tumor microenvironment, in which the Akt/mTOR signaling played an important role in the stimulation of the effector functions of CD8+ T-cells.
Figure 5.
Effect of TER on Akt/mTOR signaling in effector T-cells. (A and B) The amount of mTOR and phosphorylation of Akt substrates (Ser473 and Thr308) in CD8+ T-cells was detected via Western blot analysis. (C) The expression levels of PD-1 and IFN-γ on CC-CD8+ T-cells were analyzed by flow cytometry. (D) The flow cytometry analysis of IL-10 and IFN-γ production, and the expression of GZMB in CC-CD8+ T-cells with the treatment of TER. Representative results were showed. The percentages of cells were indicated in each quadrant. n = 3 and data was presented as means ± SD.
*P < 0.05, **P < 0.01 compared with the control group.
Also, the ability of TER to regulate the PD-1 activity in the CD8+ T-cells was assessed. Flow cytometric analysis revealed that the CC-CD8+ T-cells could express increased PD-1 levels compared with the individual cultured CD8+ T-cells (Figure 5C), suggesting that co-culturing of CD8+ T-cells with CT26 cells inactivated CD8+ T-cells and promoted PD-1 expression. Furthermore, the expression level of PD-1 was significantly decreased by TER in the IC-CD8+ T-cells compared with the control (Figure 5A), and the flow cytometric analysis indicated that the expression levels of PD-1 and IFN-γ were significantly decreased in the CC-CD8+ T-cells after TER treatment, compared to the control (Figure 5C). These findings suggested that TER might activate CD8+ T-cells by inhibiting PD-1 and IFN-γ expression. Furthermore, these results indicated that TER augmented the activity of IL-10 and IFN-γ production (Figure 5D). The expression of granzyme B (GZMB) in the CC-CD8+ T-cells or IC-CD8+ T-cells rapidly acquired the ability to produce IFN-γ by TER treatment (Figure 5D). These results indicated the stimulation of GZMB and IFN-γ production in the CD8+ T-cells by TER via the Akt/mTORC1 signaling in the tumor microenvironment.
LDHA, IFN-γ, and GZMB Expression in CD8+ T-cells
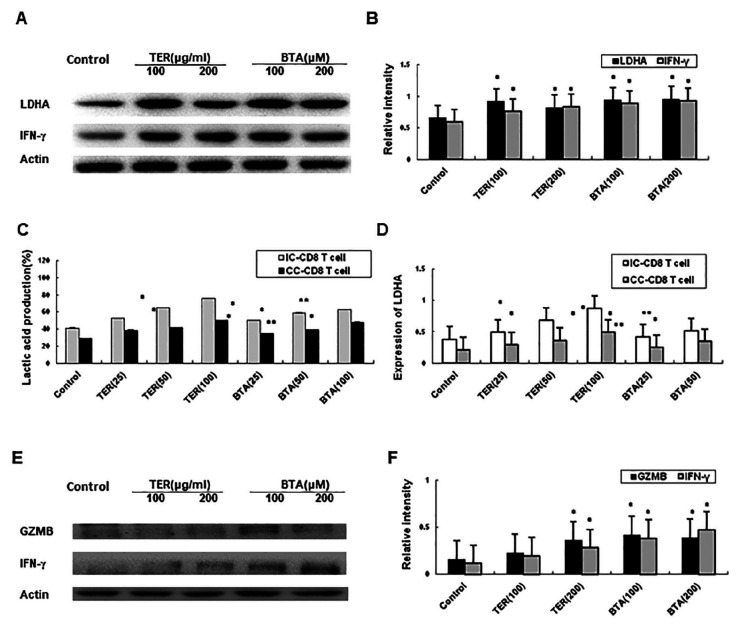
The CD8+ T cell co-cultured with CT26 cells were activated using 5 μg/mL Con A, 5 mM lactate and hypoxia (1% O2) respectively. Effects of TER on the expression of LDHA and IFN-γ in CD8+ T-cells were tested as well. The expressions of LDHA and IFN-γ were upregulated in the IC-CD8+ T-cells by treating with TER or BTA (Figure 6A and B). Moreover, the lactate level was significantly increased with TER or BTA, as well as its restoration via the enhanced expression of LDHA in the IC-CD8+ T-cells (Figure 6C). The TER or BTA was revealed to increase IFN-γ and GZMB expression which restored the expression of LDHA in the IC-CD8+ T-cells (Figure 6D-F). In summary, our study indicated that TER treatment increased IFN-γ and GZMB expression and the expression of LDHA in the CD8+ T-cells. In this way, TER may restore CD8+ T-cell immune surveillance and the dysfunction in effector T-cells by reversing the lactate-abundant tumor microenvironment.
Figure 6.
Effect of TER on dysfunction in effector T-cells. (A and B) The expression of LDHA and increased expression of IFN-γ in CC-CD8+ T-cells were detected through Western blot analysis. (C) Lactate level in T-cells was assessed. (D) The effect of TER treatment on LDHA was detected by real-time PCR and lactate levels were compared between different groups. (E and F) Transcription and protein expression of IFN-γ and GZMB in CC-CD8+ T-cells were assessed using western blotting, respectively. All the experiments were performed for 3 times. Comparison of lactate levels were performed between the TER treated control IC-CD8+ T-cells and TER treated CC-CD8+ T-cells. n = 3 and data was presented as means ± SD.
*P < 0.05, **P < 0.01 and ***P < 0.001 compared with the control group.
Cytokine Production in CD8+ T-cells
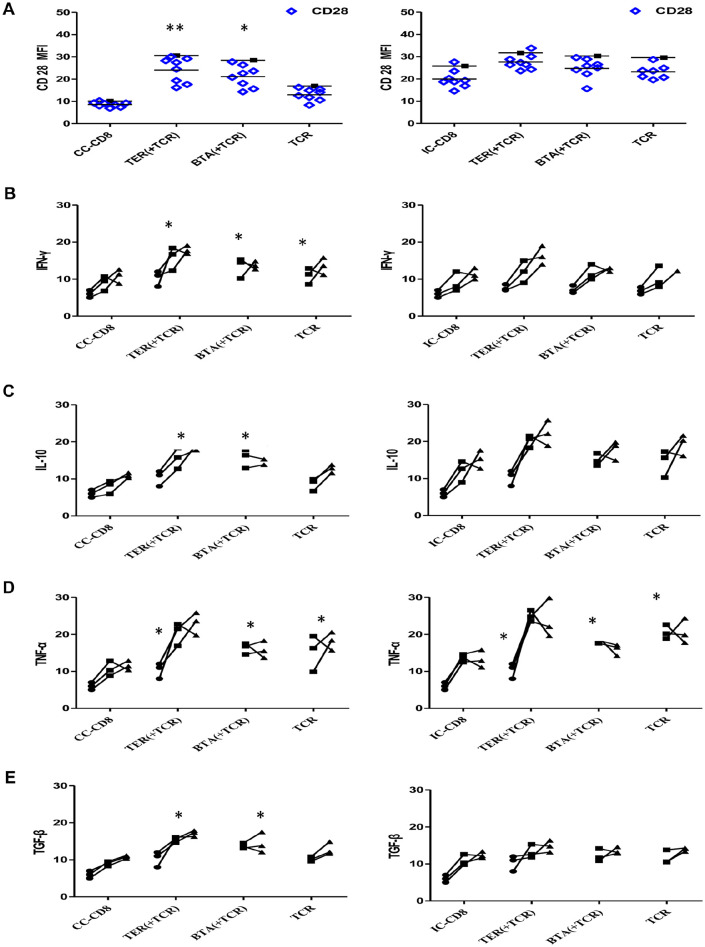
TER treatment was performed during TCR stimulation before the cells were expanded with IFN-γ and IL-10. The decreased expression of CD28 in the CC-CD8+ T-cells was restored by TER or BTA (Figure 7A). The expression of CD28 in IC-CD8+ T-cells was also increased by TER or BTA. Next, cytokine productions in CD8+ T-cells were assessed. The CC-CD8+ T-cells, but not the IC-CD8+ T-cells, produced more IFN-γ after the restoration of CD28 (Figure 7B). The increased production of IL-10, and TNF-α (Figure 7C and D) as well as the TGF-β in effector CD8+ T-cells was partially restored by TER treatment (Figure 7E).
Figure 7.
Effect of TER on cytokine production of effector T-cells. (A) Quantification of the CD28 expression levels for the indicated TCR-transduced primary CD8+ T-cells in the unstimulated culture conditions. Representative data were presented. Each TCR variant was depicted by a distinct symbol and color code. The dots, squares, and triangles represented the cytokine production after TER treatment at 1, 2, 3 days. (B-E) The effect of co-stimulation on cytokine production of TILs was assessed with overnight stimulation. The frequencies of IFN-γ (B), IL-10(C), TNF-α (D), and TGF-β (E) were quantified. Data were presented as means ± SD.
*P < .05. **P < .01.
TER Downregulated PD-1 Signaling in CD8+ T-cells
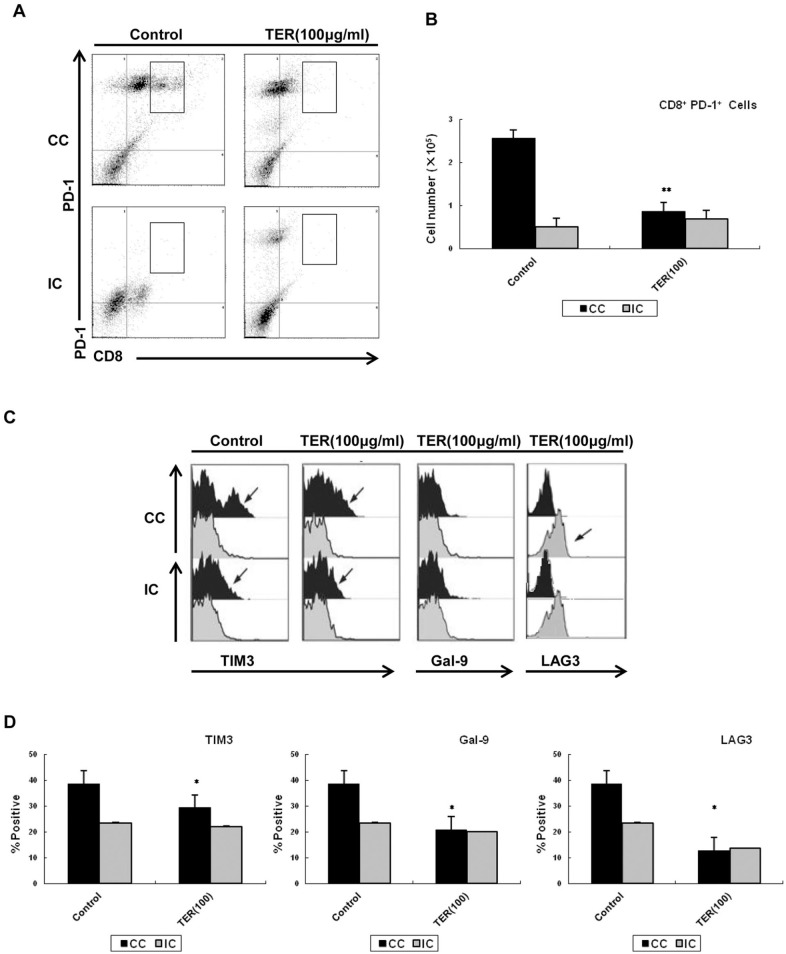
Next, we assessed the effect of TER on the PD-1 signaling in CD8+ T-cells. A population of PD-1-high CD8+ T-cells was found during the co-culturing with CT26 cells, and the decreased percentage of PD-1 upon TER treatment in CC-CD8+ T-cells was detected (Figure 8A and B). Compared with the control, the IC-CD8+ T-cells expressed lower levels of PD-1. Furthermore, the levels of LAG-3 and T cell immunoglobulin mucin 3 (TIM-3) and its ligand galectin-9 (Gal-9) were similarly expressed in the CC-CD8+ T-cells, which were predominantly from PD-L1-high CT26 cells. In contrast, the increased expression of LAG-3, Gal-9, and TIM3 in the CD8+ T-cells that were co-cultured with CT26 cells was reversed by TER treatment (Figure 8C and D). Collectively, these data showed restored effects on CD8+ T-cells activation mainly through PD-1 and TIM3 signaling.
Figure 8.
Effect of TER on PD-1 signaling in CD8+ T-cells. (A and B) The expression of PD1 by TER in CD8+ T-cells. (C) Dot plots showing the proportions of CD8+ T-cells based on LAG-3, Gal-9, and TIM3 expression. (D) Pooled data showed the proportions of CD8+ T-cells based on LAG-3, Gal-9, and TIM3 expressions. Values indicated the percentages of CD8+ T-cells among LAG-3, Gal-9, and TIM3. Each data point represented the proportion of CC-CD8+ T-cells or IC-CD8+ T-cells. Data were presented as means ± SD.
*P < .05. **P < .01.
Effect of TER on Immune and Tumor Cells In Vivo
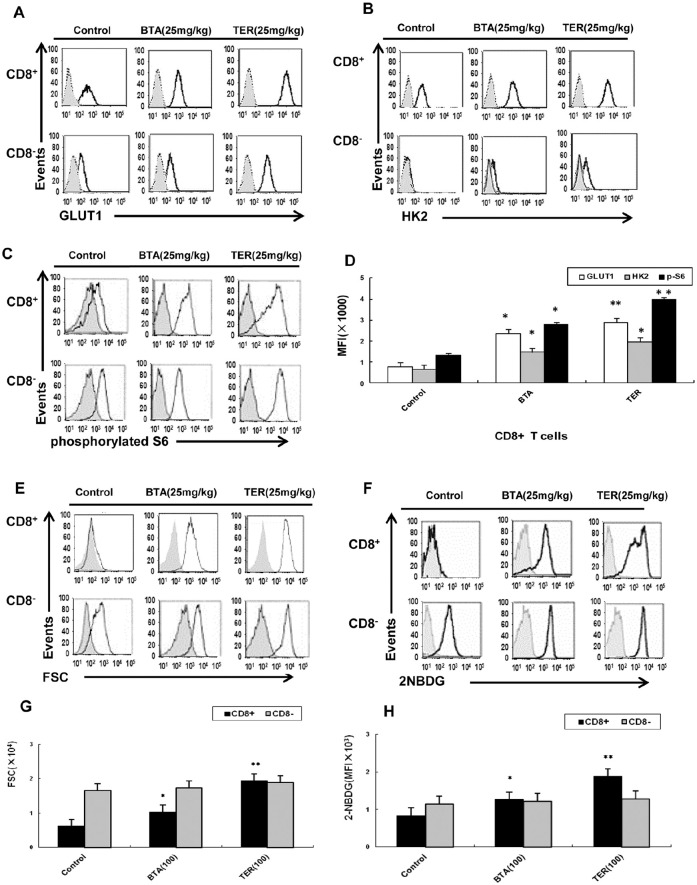
The CT26 tumor-bearing mice treated with TER or BTA demonstrated that the enhanced expression of GLUT-1 and HK2 as well as higher levels of phosphorylated S6 were detected upon stimulation in CD8+ T-cells (Figure 9A-D). The CD8+ T-cells of CT26 tumor-bearing mice were shown to be capable of robust proliferation and restored glucose uptake upon treatment with TER or BTA (Figure 9E-H); it was observed that the expression of GLUT-1 and HK2 were sufficient to partially rescue the glycolytic ability of CD8+ T-cells.
Figure 9.
Effect of TER on T-cells metabolic dysfunction in vivo. BALB/c mice were treated with TER or BTA and splenic T-cells were analyzed on the indicated days. (A-C) Expression of specified markers was measured on CD8+ T-cells derived from the control animals (n = 3) or animals treated with TER or BTA (n = 6 per group) and the expressions of GLUT-1, HK2, and S6 phosphorylation were analyzed by flow cytometry. (D) GLUT-1, HK2 expressions and S6 phosphorylation were analyzed by flow cytometry in CD8+ T-cells in CT26 mice (n = 6 per group). The bar graphs represented values from controls. (E and F) CD8+ T-cells were treated with TER or BTA after enrichment via magnetic bead isolation and flow-sorting. 2-NBDG incorporation, glucose uptake, and cell size were measured by flow cytometry. (G and H) The capability of robust proliferation and glucose uptake of T-cells by treatment with TER was measured by flow cytometry. Data were presented as means ± SD.
*P < .05. **P < .01.
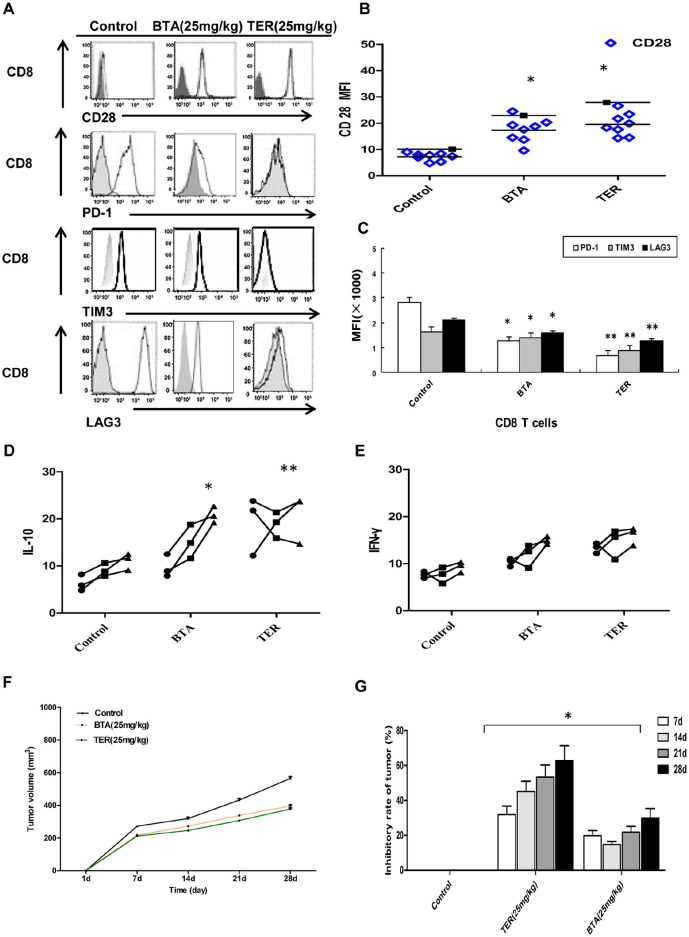
Moreover, the expression of CD28 that could boost cytokine production was restored after TER or BTA treatment (Figure 10A and B). Baseline expression of the inhibitory receptors such as LAG3, PD-1, and TIM3 also changed in the CD8+ T-cells upon TER or BTA treatment in the CT26 tumor-bearing mice (Figure 10A and C). The production of IL-10 by the stimulated CD8+ T-cells was also significantly increased and the IFN-γ production showed an increasing trend in CD8+ T-cells in the TER-treated group (Figure 10D and E).
Figure 10.
Effect and mechanism of TER on CRC in vivo. (A and B) Expression of specified markers (CD28) was measured on CD8+ T-cells from animals treated with TER or BTA (Control, n = 3) by flow cytometry. CD8+ T-cells from control animals (n = 3) or animals treated with TER or BTA (n = 6 per group) and the expressions of specified markers (PD-1, TIM3, and LAG-3) were analyzed by flow cytometry. (C) PD-1, TIM3, and LAG-3 expressions were analyzed by flow cytometry. The bar graphs represented values from controls. (D and E) Production of IL-10 and IFNγ in CD8+ T-cells from CT26 mice. (F and G) BALB/c nude mice were transplanted with CT26 colon carcinoma cells. Tumor volume was calculated daily.
*P < .05. **P < .01.
To investigate whether TER retarded tumor growth by regulating T-cells function in vivo, we inoculated nude mice with CT26 cells. After establishing a CT26 tumor-bearing mice model, the mice were fed normally and administered with 25 mg/kg TER or BTA i.p. daily. Therefore, tumor growth in xenograft-bearing nude mice was retarded by TER or BTA treatment compared with the control group (Figure 10F and G). This result showed that TER restored the capability of CD8+ T-cells obtained from CT26 tumor-bearing animals to properly inhibit tumor growth in the colon cancer mouse models. Altogether, TER treatment of CD8+ T-cells showed downregulation of the expression of PD-1 and LAG-3, as well as the the increased expression of CD28 and stimulation of cytokine production of IL-10 and IFN-γ. This was accompanied by downregulated expression of the inhibitory receptors (TIM3 and PD-1) on a subset of CD8+ T-cells.
Discussion
Emerging evidence has suggested that metabolic activity of T-cells was remarkably altered during T-cell receptor (TCR)-mediated activation.11,15,16 This change in the metabolic status was termed “metabolic reprogramming” and played an important role in regulating T-cell-mediated immune responses.10 Experimental studies have suggested that the metabolic pathways, especially for glucose metabolism, interacted tightly between CRC cell and T-cells.12,17 Furthermore, CD8+ T-cells were the most important effector cells in tumor immunity, and tumor cells relied on the acidic microenvironment caused by abnormal glucose metabolism in the Akt/mTOR pathway, while the acidic microenvironment could weaken the immune surveillance and immune defense functions of CD8+ T-cells, ultimately leading to the malignant development of cancer.3
It has been found that the triterpenoids derived from Chinese herbal medicines are very promising drug candidates against cancer that not only enhance the effector cell-mediated immune response, antigen presentation, and T cell recognition, but also improve tumor acidic microenvironment.18,19 Our previous study had confirmed that TER could regulate the level of glycolysis and lactic acid metabolism.8 However, the mechanism of TER in the maintenance of the T-cells functions via limiting mTOR activity and subsequent cellular metabolism remained unknown.
In order to clarify the mechanisms underlying the anti-cancer effect of TER or BTA on glycolysis, some of the crucial proteins in glycolysis were validated in the CRC cells. In this study, we examined the molecular mechanism of TER on inhibiting the induction of CD8+ T-cell dysfunction, including activity and exhaustion. Importantly, the critical role of TER, and its main triterpenoidic components like BTA on regulating the mTORC signaling and cellular metabolism was demonstrated. The TER or BTA dependent regulation of mTORC1 activity and cellular metabolism during the initial TCR-mediated activation phase seem to be important for preventing the induction of dysfunction in CD8+ T-cells.
The Akt/mTOR axis and GLUT1 seemed to form a positive feedback loop to sustain the glucose metabolism.13 Also, mTORC1 activity was required for the activation of glycolysis and lactate formation, while lactate and LDHA were in turn needed for sustaining activation of mTORC1 in activated CD8+ T-cells.20 Dysregulated T-cell metabolism was associated with impaired immunity in cancer cells. In this study, TER or BTA showed a regulatory effect on the expression of glycolytic targets in CD8+ T-cells as well as tumor cells. For example, TER upregulated the expression of GLUT1 and LDHA in CD8+ T-cells, suggesting that TER maintained the T-cell functions by enhancing glycolytic activity and subsequent cellular metabolism. Furthermore, our fndings also demonstrated that TER promoted glycolytic gene expression in CD8+ T-cells in vivo with increased expression of GLUT1, LDHA, and phosphorylated S6, while TER treatment significantly altered tumor growth in this setting.
Recent studies have revealed that mTORC1 is a major regulator of glycolysis.15 The mTORC1 could affect the effector cell function of CD8+ T-cells, while mTORC2 could regulate the memory ability of CD8+ T-cells. Glucose and glucose-derived acetyl-CoA promoted the acetylation of Rictor protein and enhanced the function of mTORC2, which in turn led to tumor resistance.11,16 Moreover, the PD-L1 and mTORC1 pathways affected a wide range of cellular functions, including the induction of GLUT-1 and glucose metabolism.21,22 T-cells from CRC hosts showed a trend toward increased expression of GLUT1 and CD8+ T-cells presented increased glucose uptake.23,24
To explore the mechanism of TER on the regulation of PD-L1 and mTORC expression, we investigated whether TER regulated PKM2 through binding to the same regions of the PD-L1 promoter as reported for PD-L2.25,26 Indeed, we observed a strong regulatory effect of TER or BTA on the interaction of PKM2, as well as PD-L2, with binding to the PD-L1 promoter in CT26 cells. In addition, we have demonstrated that TER or BTA simultaneously, reciprocally, and co-dependently regulated Akt/mTOR and PKM2 in CRC cells. Moreover, mTORC1 signaling and PKM2 were downregulated by TER or BTA treatments.
PD-1 and its ligand PD-L1 played an important role in regulating anti-tumor immune responses.27,28 Notably, PD-1 was upregulated on a subset of T-cells derived from CRC mice and led to a worse outcome in CRC. Our findings demonstrated the expression of PD-L1 in CT26 tumor and its upregulation in immune cells in the tumor microenvironment. The blockade of PD-1 with increased GLUT1 expression on CD8+ T-cells was observed in the BTA or TER treated group.
This study further focused on the critical role of TER in the regulation of cellular metabolism and the cytokine production derived from CD8+ T-cells. Results showed increased production of IFN-γ, IL-10 and TNF-α as well as TGF-β in the effector CD8+ T-cells after TER treatment. In addition, direct metabolic modulation of T-cells in vivo was also possible.29,30 The baseline expression of inhibitory receptors (LAG3 and TIM3) could improve the function of T-cells to properly inhibit tumor growth in CT26 mice. Most important, the progression of CRC was significantly delayed in TER treated CRC mice. Collectively, these findings gave insight into a novel mechanism of TER in the regulation of CD28, TIM3, and LAG3 expression in CD8+ T-cells in the tumor microenvironment.
Conclusion
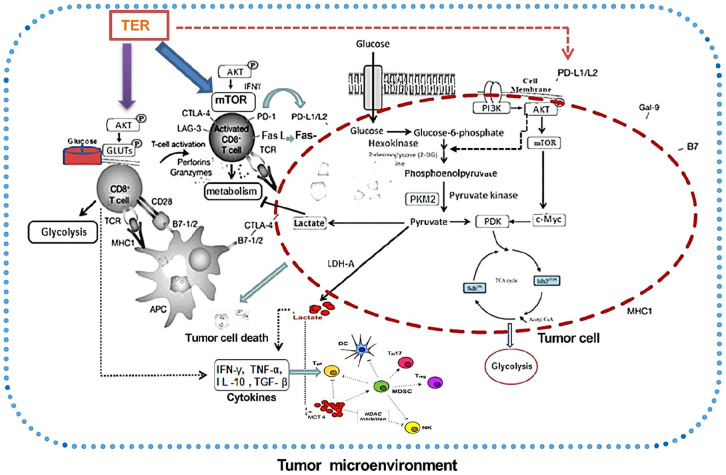
In this study, TER maintained T-cell functions by limiting mTORC1 activity and subsequently promoting cellular metabolism, and prevented CD8+ T-cell dysfunction via targeting the PD-L1/mTORC1 and PKM2 pathways (Figure 11). Moreover, TER regulated CD8+ T-cells in vivo and induced glycolytic activity coupled with increased expression of multiple metabolic receptors that promoted CD8+ T-cell metabolism and activation. More important, these findings gave insight into a novel mechanism of TER in downregulating CD28, TIM3, and LAG3 expression of CD8+ T-cells in the tumor microenvironment, thereby providing new insight into the expressional control of the important targets in colon cancer immunotherapy. Altogether, TER not only enhanced effector cell-mediated immune response, antigen presentation, and T-cell recognition, but also improved the tumor acidic microenvironment. This finding is expected to become a breakthrough in the prevention and treatment of CRC with Chinese medicine.
Figure 11.
The mechanism of TER on CD8+ T-cells and glycolysis in CRC. TER played an important role in regulating the cellular metabolism and the expression of PD-L1 in CD8+ T-cells and tumor cells. TER showed a dual regulatory effect on expression of PKM2 and PD-L1 in CD8+ T-cells as well as tumor cells in CT26 mouse model. TER regulated CD28, TIM3, and LAG3 expression in CD8+ T-cells in the tumor microenvironment. TER treatment prevented CD8+ T-cell dysfunction by targeting PD-L1/mTORC1 and PKM2 mediated glycolytic pathway, providing new insight for colon cancer immunotherapy.
Supplemental Material
Supplemental material, sj-tif-1-ict-10.1177_15347354211017219 for The Anti-Tumor Effect and Mechanism of Triterpenoids in Rhus chinensis Mill. on Reversing Effector CD8+ T-cells Dysfunction by Targeting Glycolysis Pathways in Colorectal Cancer by Gang Wang, Yu-Zhu Wang, Yang Yu, Pei-Hao Yin, Ke Xu and Heng Zhang in Integrative Cancer Therapies
Footnotes
Author Contributions: Gang Wang designed experiments; Yu-Zhu Wang and Yang Yu carried out experiments; Yu-Zhu Wang prepared Figures 1 to 4. Yang Yu analyzed experimental results and prepared Figures 5 to 10. Ke Xu, Pei-Hao Yin, and Jun-Jie Wang analyzed sequencing data and developed analysis tools. Gang Wang wrote the manuscript and prepared Figure 11 and Heng Zhang revised the manuscript.
Declaration of Conflicting Interests: The author(s) declared no potential conflicts of interest with respect to the research, authorship, and/or publication of this article.
Funding: The author(s) disclosed receipt of the following financial support for the research, authorship, and/or publication of this article: This work was supported by the National Natural Science Foundation of China (No. 81673827), the Shanghai Health Development Planning Committee Chinese Medicine Research Project (No. 2016JP008), and the Shanghai Xuhui Science and Technology Committee Research Project (SHXH201640). The terms of this document are distributed on any media in accordance with non-commercial use, distribution and reproduction, provided that both the original author and the source have been credited.
Ethics Statements: All the animal experiments complied with the guidelines and were conducted in accordance with the care and use of laboratory animals as well as Animal Studies Committee established by the Laboratory Animal Center of Putuo Hospital, Shanghai University of Traditional Chinese Medicine. The animal housing and care guidelines were in line with the guide for the care and use of Laboratory Animals Shanghai University of Traditional Chinese Medicine of which the authors have indicated in the manuscript.
ORCID iD: Gang Wang  https://orcid.org/0000-0002-0027-2001
Supplemental Material: Supplemental material for this article is available online.
References
- 1. You S, Li W, Guan Y. Tunicamycin inhibits colon carcinoma growth and aggressiveness via modulation of the ERK-JNK-mediated AKT/mTOR signaling pathway. Mol Med Rep. 2018;17:4203-4212. [DOI] [PMC free article] [PubMed] [Google Scholar] [Retracted]
- 2. Williams MD, Zhang X, Park JJ, et al. Characterizing metabolic changes in human colorectal cancer. Anal Bioanal Chem. 2015;407:4581-4595. [DOI] [PubMed] [Google Scholar]
- 3. Wang Gang, JunJie Wang, Rui Guan, et al. Strategy to targeting the immune resistance and novel therapy in colorectal cancer. Cancer Med. 2018;7:1578–1603. [DOI] [PMC free article] [PubMed] [Google Scholar]
- 4. Sun LL, Lin LZ. Effect of yiqi dephlegm recipe on epithelial interstitial transformation and P4HB expression of A549 cells in hypoxic microenvironment. J Chin Med. 2013;9:454-457. [Google Scholar]
- 5. Djakpo O, Yao W. Rhus chinensis and Galla Chinensis–folklore to modern evidence: review. Phytother Res. 2010;24: 1739-1747. [DOI] [PMC free article] [PubMed] [Google Scholar]
- 6. Gao XM, Xu ZM, Li ZW. Traditional Chinese Medicines. People’s Health Publishing House; 2000:263-266. [Google Scholar]
- 7. Singer K, Gottfried E, Kreutz M, Mackensen A. Suppression of T-cells responses by tumor metabolites. Cancer Immunol Immunother. 2011;60:425-431. [DOI] [PMC free article] [PubMed] [Google Scholar]
- 8. Wang G, Wang YZ, Yu Y, Wang JJ. Inhibitory ASIC2-mediated calcineurin/ NFAT against colorectal cancer by triterpenoids extracted from Rhus chinensis Mill. J Ethnopharmacol. 2019;235:255-267. [DOI] [PubMed] [Google Scholar]
- 9. Wang R, Dillon CP, Shi LZ, et al.The transcription factor Myc controls metabolic reprogramming upon T lymphocyte activation. Immunity. 2011;35:871-882. [DOI] [PMC free article] [PubMed] [Google Scholar]
- 10. Assmann N, Finlay DK. Metabolic regulation of immune responses: therapeutic opportunities. J Clin Invest. 2016;126:2031-2039. [DOI] [PMC free article] [PubMed] [Google Scholar]
- 11. Chi H. Regulation and function of mTOR signalling in T cell fate decisions. Nat Rev Immunol. 2012;12:325-338. [DOI] [PMC free article] [PubMed] [Google Scholar]
- 12. Nelson Ho, Coomber BL. Pyruvate dehydrogenase kinase expression and metabolic changes following dichloroacetate exposure in anoxic human colorectal cancer cells. Exp Cell Res. 2015;331:73-81. [DOI] [PubMed] [Google Scholar]
- 13. Buck MD, O’Sullivan D, Pearce EL. T cell metabolism drives immunity. J Exp Med. 2015;212:1345-1360. [DOI] [PMC free article] [PubMed] [Google Scholar]
- 14. Vander Heiden MG, Cantley LC, Thompson CB. Understanding the Warburg effect: the metabolic requirements of cell proliferation. Science. 2009;324:1029-1033. [DOI] [PMC free article] [PubMed] [Google Scholar]
- 15. Waickman AT, Powell JD. mTOR, metabolism, and the regulation of T-cells differentiation and function. Immunol Rev. 2012;249:43-58. [DOI] [PMC free article] [PubMed] [Google Scholar]
- 16. Wu XL, Wang LK, Yang DD, et al. Effects of Glut1 gene silencing on proliferation, differentiation, and apoptosis of colorectal cancer cells by targeting the TGF-β/PI3K-AKT-mTOR signaling pathway. J Cell Biochem. 2018;119:2356-2367. [DOI] [PubMed] [Google Scholar]
- 17. Ho PC, Bihuniak JD, Macintyre AN, et al. Phosphoenolpyruvate is a metabolic checkpoint of anti-tumor T cell responses. Cell. 2015;162:1217-1228. [DOI] [PMC free article] [PubMed] [Google Scholar]
- 18. Zheng W, Yang JK. Tumor microenvironment and pathogenesis of TCM. Chin Med J. 2015;56:1720-1724. [Google Scholar]
- 19. Radwan FF, Hossain A, God JM, et al. Reduction of myeloid-derived suppressor cells and lymphoma growth by a natural triterpenoid. J Cell Biochem. 2015;116:102-114. [DOI] [PMC free article] [PubMed] [Google Scholar]
- 20. Nunes C, Wong R, Mason M, Fegan C, Man S, Pepper C. Expansion of a CD8(+)PD-1(+) replicative senescence phenotype in early stage CLL patients is associated with inverted CD4: CD8 ratios and disease progression. Clin Cancer Res. 2012;18:678-687. [DOI] [PubMed] [Google Scholar]
- 21. Kimmelman AC, White E. Autophagy and tumor metabolism. Cell Metab. 2017;25:1037-1043. [DOI] [PMC free article] [PubMed] [Google Scholar]
- 22. Siska PJ, Rathmell JC. T cell metabolic fitness in antitumor immunity. Trends Immunol. 2015;36:257-264. [DOI] [PMC free article] [PubMed] [Google Scholar]
- 23. Brand A, Singer K, Koehl GE, et al. LDHA-associated lactic acid production blunts tumor immunosurveillance by T and NK cells. Cell Metab. 2016;24:657-671. [DOI] [PubMed] [Google Scholar]
- 24. Snyder JP, Amiel E. Regulation of dendritic cell immune function and metabolism by cellular nutrient sensor Mammalian Target of Rapamycin (mTOR).Front Immunol. 2019;9:3145. [DOI] [PMC free article] [PubMed] [Google Scholar]
- 25. Wyss J, Dislich B, Koelzer VH, et al. Stromal PD-1/PD-L1 expression predicts outcome in colon cancer patients. Clin Colorectal Cancer. 2019;18:e20-e38. [DOI] [PubMed] [Google Scholar]
- 26. Wu F, Gao P, Wu W, et al. STK25-induced inhibition of aerobic glycolysis via GOLPH3-mTOR pathway suppresses cell proliferation in colorectal cancer. J Exp Clin Cancer Res. 2018;37:144. [DOI] [PMC free article] [PubMed] [Google Scholar]
- 27. Zeng H, Yang K, Cloer C, Neale G, Vogel P, Chi H. mTORC1 couples immune signals and metabolic programming to establish T(reg)-cell function. Nature. 2013;499:485-490. [DOI] [PMC free article] [PubMed] [Google Scholar]
- 28. Ryan AE. Stromal cell PD-L1 inhibits CD8+ T-cells antitumor immune responses and promotes colon cancer. Cancer Immunol Res. 2018;6:1426-1441. [DOI] [PubMed] [Google Scholar]
- 29. Long AH, Haso WM, Shern JF, et al. 4-1BB costimulation ameliorates T cell exhaustion induced by tonic signaling of chimeric antigen receptors. Nat Med. 2015;21:581-590. [DOI] [PMC free article] [PubMed] [Google Scholar]
- 30. Keir ME, Liang SC, Guleria I, et al. Tissue expression of PD-L1 mediates peripheral T cell tolerance. J Exp Med. 2006; 203:883-895. [DOI] [PMC free article] [PubMed] [Google Scholar]
Associated Data
This section collects any data citations, data availability statements, or supplementary materials included in this article.
Supplementary Materials
Supplemental material, sj-tif-1-ict-10.1177_15347354211017219 for The Anti-Tumor Effect and Mechanism of Triterpenoids in Rhus chinensis Mill. on Reversing Effector CD8+ T-cells Dysfunction by Targeting Glycolysis Pathways in Colorectal Cancer by Gang Wang, Yu-Zhu Wang, Yang Yu, Pei-Hao Yin, Ke Xu and Heng Zhang in Integrative Cancer Therapies


