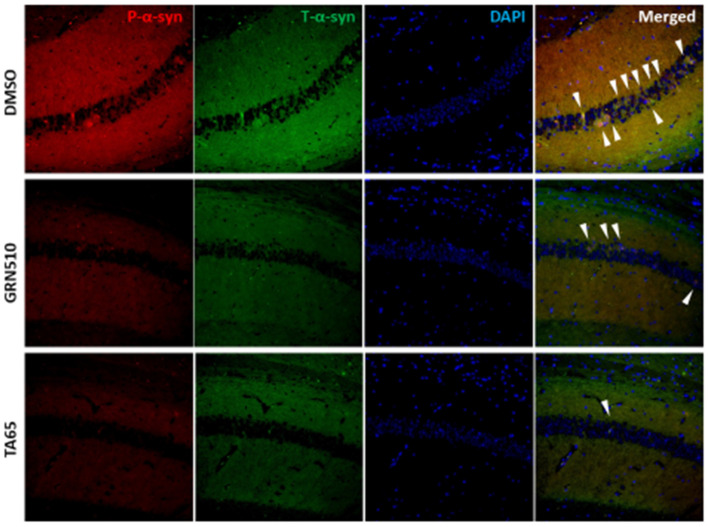
Figure 1.
Phosphorylated (red signal) and total (green signal) α-synuclein in the CA1 region of the hippocampus of DMSO-treated (control), GRN510 and TA-65 treated mice. White arrowheads show merged signals of phosphorylated and total α-synuclein. Blue signals are DAPI for nuclear staining. For details and quantification, see [67].

