Abstract
Here, we report a facile and efficient approach for the large-scale synthesis of highly fluorescent sulfur quantum dots (SQDs) from inexpensive elemental sulfur under a pure oxygen (O2) atmosphere. The important finding of this work is that the polysulfide (Sx2−) ions could be oxidized to zero-valent sulfur (S[0]) by O2, which is the accelerator of the reaction. The SQDs prepared by this method possess nearly monodisperse size (1.5–4 nm), high fluorescence quantum yield (21.5%), tunable emission, and stable fluorescence against pH change, ionic strength variation and long-term storage. Moreover, the reaction yield of SQDs reached as high as 5.08% based on the content of S element in SQDs, which is much higher than other reported approaches (generally <1%). The prepared SQDs could be easily processed for widespread applications thanks to their low toxicity and superior dispersibility both in water and common organic solvents. These high-quality SQDs may find applications similar to or beyond those of carbon QDs and silicon QDs.
Highly fluorescent sulfur quantum dots could be rapidly and massively synthesized from inexpensive elemental sulfur under a pure O2 atmosphere.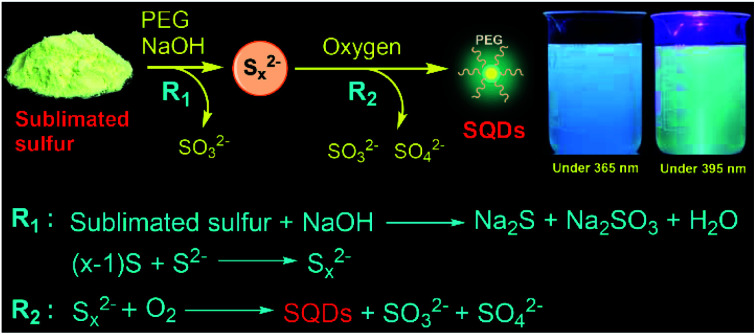
Introduction
Fluorescent nanodots, combining unique optical properties and small size, have been widely studied for various applications ranging from bio-labelling to optoelectronic devices.1 In the past decade, particular attention has been focused on nonmetal element nanodots such as carbon dots (CDs) and silicon quantum dots (SiQDs) due to their low toxicity.2,3 Although sulfur is a typical nonmetal element and about seven million tons of elemental sulfur are produced annually,4 sulfur quantum dots (SQDs) have far less been investigated because of the challenge in synthesizing high-quality fluorescent SQDs through a viable approach.
The first report on the synthesis of fluorescent SQDs is through etching the Cd component of CdS QDs with nitric acid at the interface of water and hexane.5 The complex reaction process and very low fluorescence quantum yield (QY, 0.19%) of the resulting SQDs significantly limit the widespread application of this approach. Recently, Shen and coworkers developed a one-step method to prepare SQDs based on the reaction between the bulk sulfur powder and NaOH in the presence of polyethylene glycol (PEG) as the ligand.6 They ascribed the formation of SQDs to the assembly-fission process. Considering that elemental sulfur is abundant and inexpensive,4,7 this method opens a new door for straightforward preparation of fluorescent SQDs from inexpensive elemental sulfur. However, an extremely long reaction time is required even for preparing SQDs with a low QY. For example, preparation of SQDs with a QY of 0.19% and 3.8% required reaction for 30 and 125 h, respectively. Furthermore, this method generally exhibits a very low product yield value (<3%). Very recently, Wang et al. reported that the QY of SQDs prepared according to Shen's approach could be greatly enhanced by treating the SQDs with hydrogen peroxide.8 However, rapid and high yield production of highly fluorescent SQDs remains a big challenge. To this end, there is an urgent need of an efficient approach to synthesize fluorescent SQDs which simultaneously possess high QY and process yield. To address this challenge, we report herein a simple and fast approach for the synthesis of highly fluorescent SQDs from elemental sulfur through oxidation of divalent polysulfide (Sx2−) ions to zero-valent sulfur (S[0]) under a pure O2 atmosphere (Scheme 1). We found that O2 is an essential reactant for the rapid and scalable production of strongly emissive SQDs.
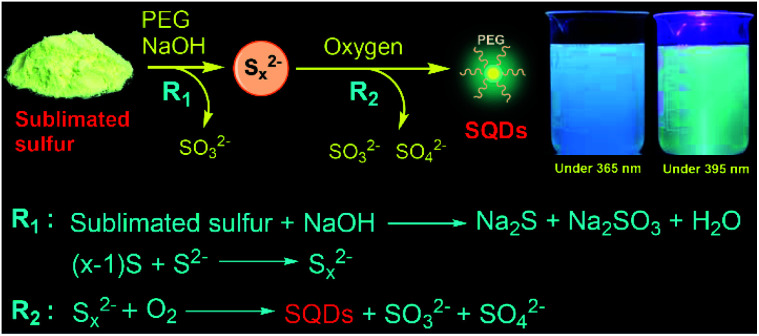
Scheme 1. Synthetic procedure and formation mechanism of the fluorescent SQDs under an O2 atmosphere. Insets: photographs of the prepared SQDs in water under illumination with 365 nm (left) and 395 nm (right) light.
Results and discussion
The procedure for the synthesis of fluorescent SQDs is illustrated in Scheme 1. Experimentally, 1.6 g of sublimated sulfur, 4 g of NaOH, and 3 g of PEG (Mn = 400 Da) were added to 100 mL of water in a flask and the mixture was stirred at 90 °C under an O2 atmosphere. After stirring for 8–10 h, the transparent reaction mixture obtained from the pure O2 atmosphere could emit bright blue fluorescence under illumination with 365 nm ultraviolet (UV) light (Fig. 1). It should be pointed that no fluorescence could be detected if the sublimated sulfur was not added even if the mixture of PEG and NaOH was stirred at 90 °C for 10 h under an O2 atmosphere (see Fig. S1†).
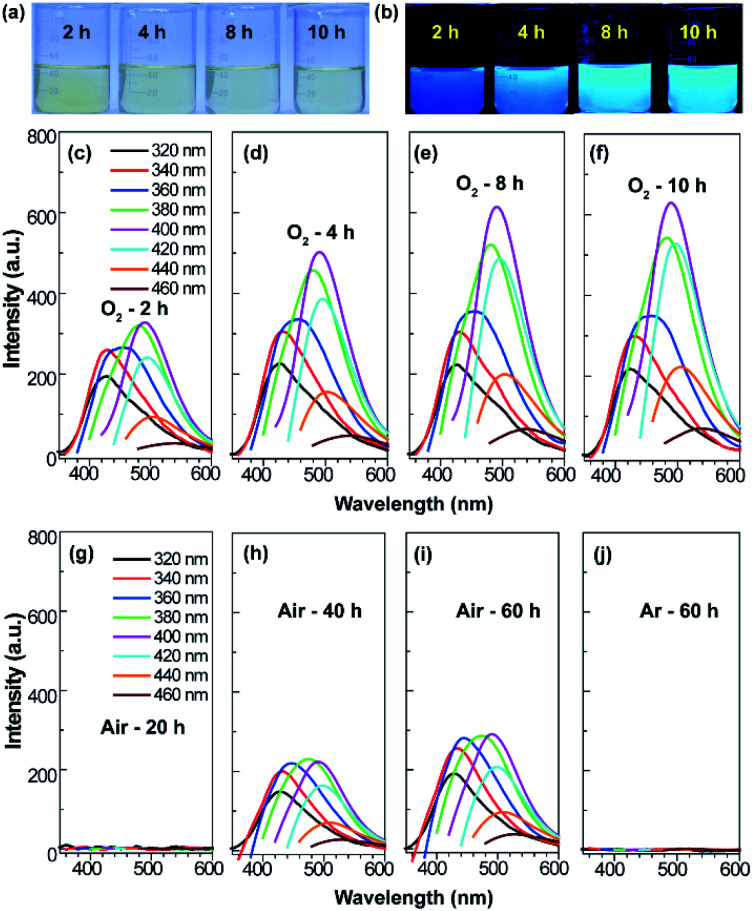
Fig. 1. Photographs of the reaction mixture obtained from an O2 atmosphere with different reaction times under daylight (a) and a 365 nm UV lamp (b). Emission spectra of the reaction mixture obtained from O2 (c–f), air (g–i), and Ar (j) atmosphere with different reaction times.
To probe the effect of the reaction atmosphere, the reaction process under O2, air and argon (Ar) atmospheres was monitored using a fluorescence spectrometer (Fig. 1 and S2, S3†), respectively. Under the O2 atmosphere, after reaction for only 1.5 h (Fig. S2b†), obvious emission peaks appeared. Further increasing the reaction time led to gradual enhancement of emission intensity, which reached equilibrium at about 10 h (Fig. 1 and S2†). Moreover, the emission peaks could be tuned from 424 to 542 nm by adjusting the excitation wavelength from 320 to 460 nm (Fig. 1f), respectively, suggesting that multicolor fluorescence could be easily achieved by manipulating the excitation wavelength. As can be seen in the inset of Scheme 1, the aqueous dispersion of SQDs emits strong blue and cyan fluorescence under illumination with 365 and 395 nm light, respectively. The maximum emission peak appeared at about 490 nm with an excitation wavelength of 400 nm, which agrees well with the excitation spectrum (Fig. 1f and S2h†). Interestingly, the excitation peak associated with the maximum emission peak only slightly shifted with increasing reaction time (Fig. 1c–f and S2h†). It is worth noting that the absolute fluorescence QY of the 10 h sample was determined to be as high as 21.5%, which compares favorably to other reported SQDs, while under air conditions, the reaction mixture did not present any emission peak or fluorescence even after reaction for 20 h (Fig. 1g and S3, S4a†). At least 30 h is required for the observation of emission peaks (Fig. S3†), which is in accordance with Shen's report and it is much slower than that under an O2 atmosphere.6 Although the reaction mixture under air conditions also showed enhanced fluorescence with increasing reaction time, the fluorescent intensity of the 60 h sample was still lower than that of the 2 h sample obtained from the O2 atmosphere (Fig. 1c and i). Furthermore, no emission peak or fluorescence was detected even when the mixture was stirred under an Ar atmosphere for 60 h (Fig. 1j and S4b†). To understand the role of O2 in the formation of fluorescent SQDs, a control experiment was carried out by stirring the reaction mixture in a closed flask, which was filled with pure O2. After stirring for 10 h, the interior pressure of the flask decreased by 0.042 MPa (Fig. 2a), confirming that O2 was involved in the reaction. These data concluded that O2 is an essential reactant for the formation of fluorescent SQDs.
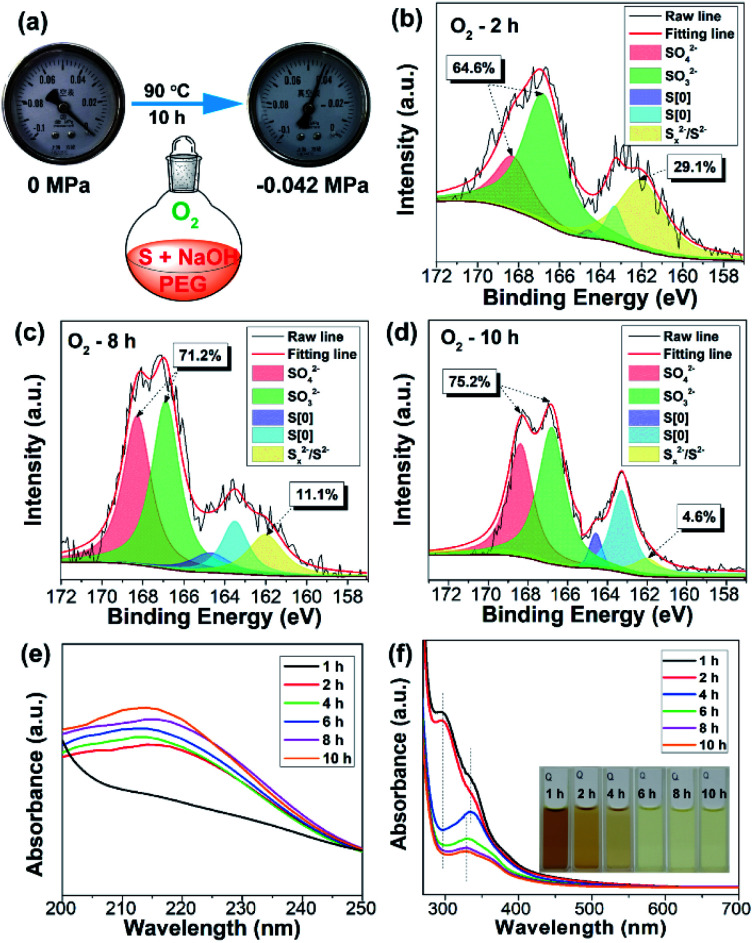
Fig. 2. (a) The interior pressure of the flask before and after reaction for 10 h under an O2 atmosphere. XPS S 2p spectra of the reaction mixture with reaction times of 2 h (b), 8 h (c), and 10 h (d). (e) Time-dependent UV-vis absorption spectra of the reaction mixture after diluting 1000 (e) and 60 times (f) with water. Inset of (f): photographs of the reaction mixture with different reaction times.
In order to investigate the reaction mechanism, the reaction process was monitored by X-ray photoelectron spectroscopy (XPS), which is a powerful tool that can reveal the type of chemical bond. After reaction for 2 h, the reaction mixture exhibited four kinds of sulfur including SO42− (168.4 eV), SO32− (167.2 eV), S[0] (164.4 eV and 163.3 eV), and divalent sulfur ions (S2− and Sx2−) (161.5 eV), respectively (Fig. 2b).5,9 S2−, SO32−, and Sx2− were formed by the reaction between elemental sulfur and NaOH as illustrated in Scheme 1. The existence of SO42− ions is possibly attributed to the oxidation of Sx2− and SO32− ions by O2. The content of high oxidation state sulfur ions (SO42− and SO32−), S[0], and divalent sulfur ions (S2−/Sx2−) was determined to be 64.6%, 6.3%, and 29.1%, respectively. Upon further increasing the reaction time to 8 and 10 h, the content of high oxidation state sulfur ions increased by 6.6% and 10.6%, while the content of divalent sulfur ions decreased by 18% and 24.5%, respectively (Fig. 2c and d). Correspondingly, the content of S[0] respectively increased by 11.4% and 13.9%. These results demonstrate that the divalent sulfur ions have been gradually oxidized to S[0] and high oxidation state sulfur ions by O2. Meanwhile, the absorption spectra of the reaction mixture were also monitored. As presented in Fig. 2e, the reaction mixture after reaction for 2 h shows an obvious absorption peak at 216 nm, which is ascribed to the n–σ* transition of nonbonding electrons of S atoms.6 The emergence of this peak is possibly caused by the formation of SQDs since obvious fluorescence could be observed after reaction for 2 h (Fig. 1c). In addition, a strong absorption peak at 298 nm associated with the Sx2− ions can be clearly seen in the first two hours (Fig. 2f). With increasing reaction time, this peak decreased remarkably, while an obvious peak at about 334 nm corresponding to the direct band gap transition of S[0] appeared, indicating the presence of oxidation reaction from Sx2− ions to S[0]. Correspondingly, the color of the reaction mixture caused by the existence of Sx2− ions gradually faded with increasing reaction time (Fig. 2f). Additionally, upon increasing the reaction time to 10 h, the peaks at 216 and 334 nm slightly shifted to 213 to 329 nm, respectively, which is possibly caused by the effect of quantum confinement.5
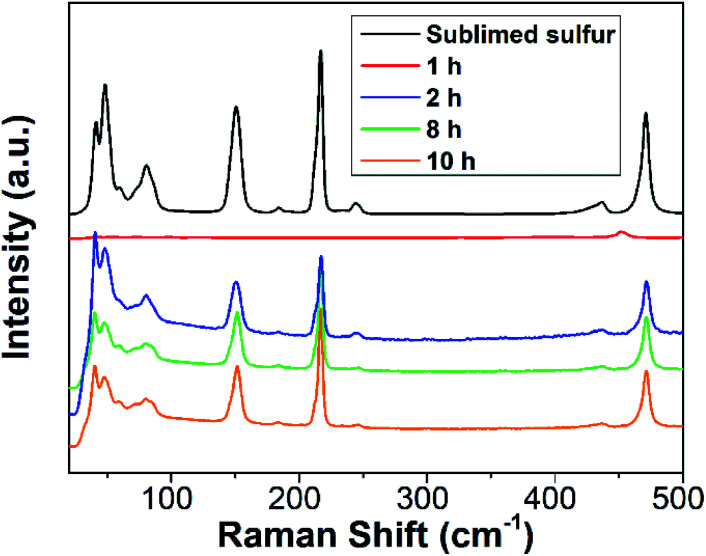
To further gain insight into the reaction process, Raman spectra of the reaction mixture with diverse reaction times were recorded. For comparison, the Raman spectrum of sublimed sulfur was also measured. As depicted in Fig. 3, the 1 h sample does not present any Raman peaks related to S[0]. After reaction for 2 h, the reaction mixture begins to exhibit characteristic peaks similar to those of sublimed sulfur, which is ascribed to the formation of SQDs. This result is well in agreement with the results of the emission and absorption spectra.
Fig. 3. Raman spectra of sublimed sulfur and the reaction mixture with diverse reaction times.
Based on the aforementioned results, herein we propose a possible formation mechanism of SQDs. First, part of bulk sulfur reacted with NaOH to form Na2S and Na2SO3 (Scheme 1). Then, the remaining bulk sulfur combined with Na2S to form Na2Sx.6 Finally, the formed Sx2− ions could react with O2 to form high oxidation state sulfur ions and S[0] as confirmed from the XPS, absorption and Raman spectra (Fig. 2 and 3). At the same time, the formed S[0] could assemble into fluorescent SQDs with the aid of a PEG stabilizer. Based on this reaction mechanism, providing enough O2 should be enough to ensure the complete oxidation of Sx2− to form SQDs. Therefore, efficient preparation of fluorescent SQDs could be readily achieved under a pure O2 atmosphere while no SQDs were obtained under an Ar atmosphere (Fig. 1).
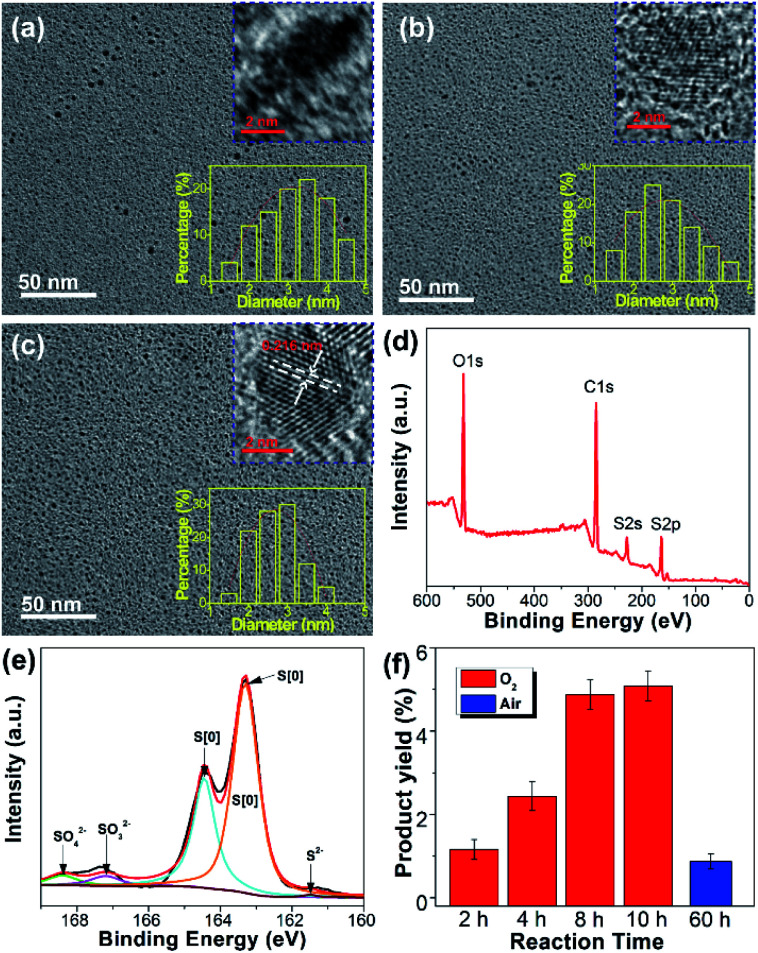
After purification by dialysis against water, the SQDs obtained from the O2 atmosphere were characterized systematically. The morphology of SQDs prepared with different reaction times was observed by transmission electron microscopy (TEM). As depicted in Fig. 4a–c, the sizes of all SQDs are below 6 nm. In particularly, the size of the 10 h sample is in the range of 1.5–4 nm (Fig. 4c), which is more uniform than previously reported SQDs.6,8,10 Consistent with the emission and absorption spectra, the reaction time has little influence on the mean size of SQDs. For example, the average diameter of SQDS with a reaction time of 2 and 10 h is 3.34 nm and 2.76 nm, respectively. Nevertheless, a long reaction time leads to SQDs with a uniform size distribution. From the corresponding high-resolution TEM (HRTEM) images, the crystalline properties of SQDs enhanced greatly with increasing reaction time. As can be seen in Fig. 4c, lattice fringes with a lattice parameter of 0.216 nm, which is consistent with other reports,6,11 can be clearly observed for the 10 h sample. The enhanced crystalline properties were also demonstrated by powder X-ray diffraction (XRD) measurement. In comparison with the 2 h sample, the XRD pattern of the 10 h sample presents more sharp peaks (Fig. S5a†), further indicating its better crystalline properties. The more uniform size distribution together with good crystalline properties of SQDs in this work should contribute to a high fluorescence QY as compared with previous reports. To gain insight into their surface information, the purified SQDs were characterized by Fourier transform infrared (FTIR) spectroscopy and XPS. As depicted in Fig. S5b,† the SQDs present similar FTIR spectrum to that of pure PEG, indicating the presence of PEG on the surface of SQDs. Herein, PEG was utilized as a ligand to endow the formed SQDs with superior dispersibility and colloidal stability. It is worth noting that the addition of PEG is essential and no fluorescent SQDs could be obtained if PEG was not added. The XPS survey spectrum shown in Fig. 4d indicates that the SQDs are composed of C, O, and S elements. The high content of C and O elements is due to the existence of the PEG ligand on the surface of SQDs, which is in accordance with the FTIR result. Compared with the unpurified SQDs with obvious peaks of SO42−, SO32−, and S2−/Sx2− ions (Fig. 2d), the dominant form of the S element in the XPS S 2p spectrum of purified SQDs is zero-valent sulfur (S[0]) (Fig. 4e) because the free SO42−, SO32−, and S2−/Sx2− ions were removed in the dialysis process. In addition, a slight blue-shift of the absorption peaks (from 213 and 319 nm to 212 and 327 nm, respectively) and emission peak (from 490 to 487 nm) of SQDs was observed after purification (Fig. S6†).
Fig. 4. Representative TEM and HRTEM images of SQDs prepared under an O2 atmosphere with a reaction time of 2 h (a), 8 h (b), and 10 h (c). XPS survey (d) and XPS S 2p (e) spectra of purified SQDs. (f) Product yield values of SQDs prepared under an O2 or air atmosphere with different reaction times.
Recently reported methods for SQDs preparation are seriously limited by the product yield.5,6,8,12 In comparison, the yield of SQDs prepared under an O2 atmosphere with a reaction time of 10 h could reach as high as 5.08%, which is more than five-fold that of the SQDs prepared under an air atmosphere with a reaction time of even 60 h (0.87%). This indicates that reaction under an O2 atmosphere could greatly increase the product yield value of SQDs (Fig. 4f). To the best of our knowledge, such a high product yield value has never been reported before.
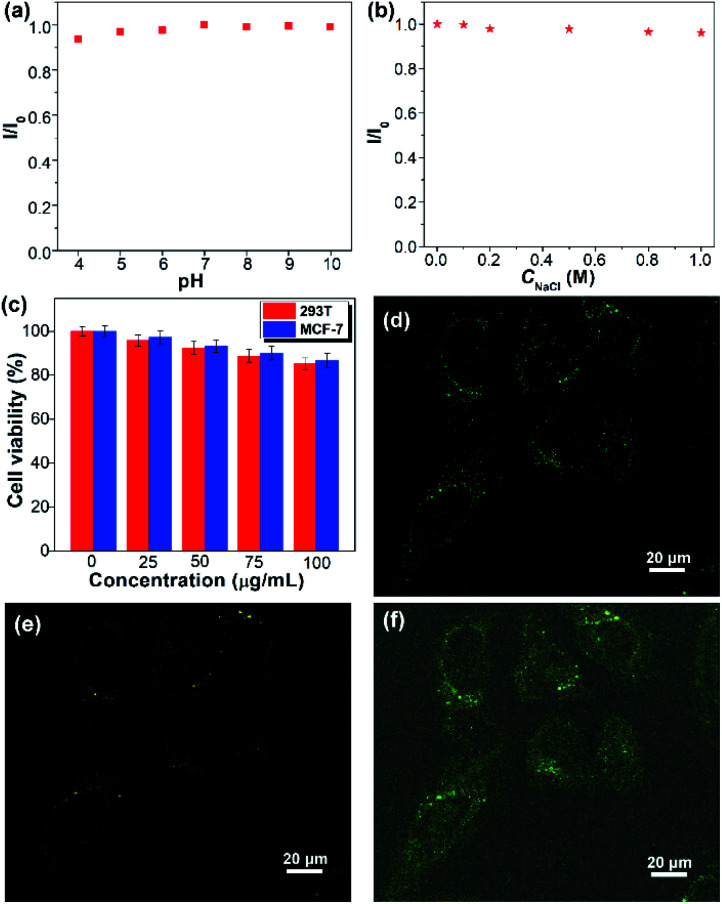
The colloidal stability of SQDs in an aqueous medium was then evaluated by considering the solution pH, electrolyte, and duration of storage. The SQDs present stable aqueous fluorescence against variation of pH from 4 to 10 and the concentration of NaCl from 0 to 1.0 M (Fig. 5a, b and S7†). Furthermore, the aqueous dispersion of SQDs is very stable and no precipitate could be observed even after being stored at room temperature for two months. The good colloidal stability indicates that the SQDs can be employed in complex aqueous environments. The cytotoxicity of SQDs was assessed utilizing the methyl-thiazolyldiphenyl-tetrazolium (MTT) assay. After 24 h of exposure to the SQDs, the cell viabilities of both human normal cells 293T and cancer cells MCF-7 are higher than 90% at 50 μg mL−1 and remain over 85% at 100 μg mL−1 (Fig. 5c), indicating the low cytotoxicity of SQDs. We then utilized SQDs (20 μg mL−1) as a fluorescent probe to stain MCF-7 cancer cells and evaluated them by confocal laser scanning microscopy (CLSM). After incubation for 2 h, obvious green and yellow fluorescence could be observed in the cytoplasm upon excitation at 458 and 514 nm, respectively (Fig. 5d–f), suggesting that the SQDs were efficiently internalized by the MCF-7 cells. In contrast, no fluorescence could be seen for the cells without incubation with SQDs (Fig. S8†). Therefore, the SQDs hold great promise for use as a fluorescent probe with low toxicity and strong fluorescence.
Fig. 5. pH (a) and NaCl concentration (b) dependent fluorescent intensity ratio (I/I0) of the SQDs. (c) Cell viability of 293T and MCF-7 cells after incubation with diverse concentrations of SQDs for 24 h. CLSM fluorescence images upon excitation at 458 nm (d) and 514 nm (e), and the merged image (f) of MCF-7 cells upon incubation with SQDs (20 μg mL−1) for 2 h.
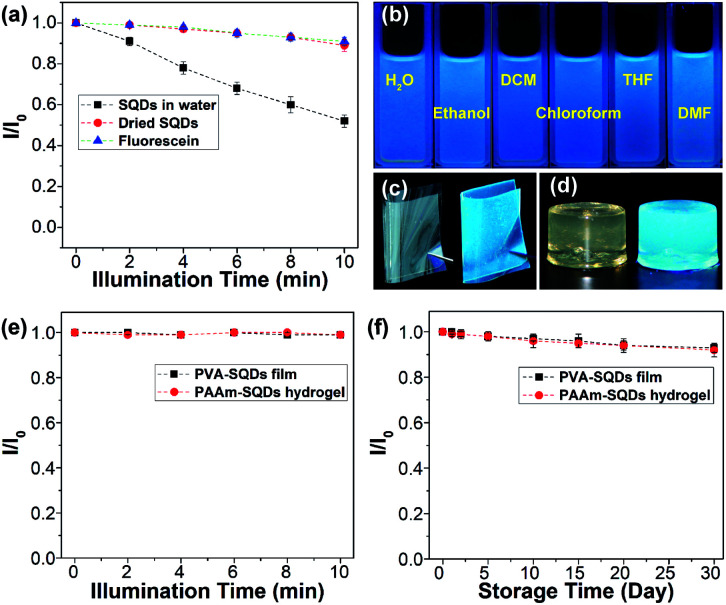
In addition, the photostability of the aqueous dispersion of SQDs and dried SQDs was evaluated by illumination with 365 nm UV light for 10 min. The dried SQDs after illumination with UV light for different times were dispersed in water for the measurement of emission spectra. For comparison, an aqueous solution of fluorescein was also studied under the same conditions. As depicted in Fig. 6a, the emission intensities of SQDs in water, dried SQDs, and fluorescein solution decrease by 48, 10, and 9%, respectively. These results suggest that the photostability of dried SQDs is comparable to that of commercially available fluorescein. On the other hand, the obvious decrease of the emission intensity of the SQDs in water is possibly caused by the aggregation of SQDs since some aggregates were observed after illumination with UV light.
Fig. 6. (a) Fluorescence intensity ratio (I/I0) of the aqueous dispersion of SQDs, dried SQDs and fluorescein under 365 nm UV light illumination for diverse times. (b) Photographs of SQDs in various solvents under a 365 nm UV lamp. Photographs of the PVA-SQD film (c) and PAAm-SQD hydrogel (d) under daylight (left) and a 365 nm UV lamp (right), respectively. (e) I/I0 value of the PVA-SQD film and PAAm-SQD hydrogel under 365 nm UV light illumination for diverse times. For (a) and (e), I0 and I are the emission intensities of samples without and with 365 nm UV light illumination for diverse times, respectively. (f) I/I0 value of the PVA-SQD film and PAAm-SQD hydrogel under daylight for different times.
In addition to water, the SQDs could also be well dispersed in hydrophilic organic solvents (i.e., ethanol and tetrahydrofuran (THF), and dimethylformamide (DMF)) and even in hydrophobic organic solvents (i.e., dichloroform (DCM) and chloroform) due to the presence of the amphiphilic PEG ligand on their surfaces (Fig. S9†). All of the dispersions could emit strong blue fluorescence under 365 nm UV light (Fig. 6b). It is reported that the optical properties of some fluorescent materials are susceptible to the external environment and they may completely lose their fluorescence during post-processing.13 Benefiting from the superior dispersibility, SQDs could be used to prepare light-emitting polymer composites. For instance, by blending the SQDs with polyvinyl alcohol (PVA) in water, followed by evaporation of water, a highly transparent and fluorescent PVA-SQD composite film was obtained (Fig. 6c and S10†), suggesting that the fluorescence properties of SQDs were well retained during processing. Moreover, the SQDs could retain their fluorescence properties even when used for synthesizing a fluorescent polyacrylamide (PAAm) composite hydrogel (Fig. 6d and the ESI†). Compared with the aqueous dispersion of SQDs, both the PVA-SQD film and PAAm-SQD hydrogel exhibit excellent photostability and their emission intensities decrease by no more than 1% after illumination with 365 nm UV light for 10 min. Furthermore, even under daylight for one month, no obvious decrease of the emission intensities of PVA-SQDs and PAAm-SQDs was determined. The significant enhancement of the photostability of SQDs in polymer composites should be attributed to the stabilization of the polymer matrix. Therefore, it is possible to improve the photostability of SQDs in water by coating the surface of SQDs with a polymer shell. This is in progress in our lab and will be reported later.
Conclusions
In summary, we for the first time discover that highly fluorescent SQDs could be facilely and massively prepared from elemental sulfur based on the oxidation of divalent polysulfide ions to zero-valent sulfur under a pure O2 atmosphere. The obtained SQDs simultaneously possess small and nearly monodisperse size, high fluorescence QY, tunable emission, superior dispersibility and colloidal stability, and low cytotoxicity, holding great promise for various applications as confirmed by cell imaging and fabrication of light-emitting polymer composites in this study. The insight that the polysulfide ions can be oxidized to S[0] to form high-quality SQDs will be an important asset for the large-scale preparation and widespread application of SQDs.
Conflicts of interest
There are no conflicts to declare.
Supplementary Material
Acknowledgments
This work was supported by the National Natural Science Foundation of China (No. 51663007), the Natural Science Foundation of Guangxi Province (No. 2017GXNSFFA198002), the Bagui Scholar Program of Guangxi Province, and the Project of Thousand Outstanding Young Teachers' Training in Higher Education Institutions of Guangxi.
Electronic supplementary information (ESI) available. See DOI: 10.1039/c9sc05019a
Notes and references
- (a) Alivisatos A. P. Science. 1996;271:933–937. doi: 10.1126/science.271.5251.933. [DOI] [Google Scholar]; (b) Michalet X. Pinaud F. F. Bentolila L. A. Tsay J. M. Doose S. J. J. L. Li J. J. Sundaresan G. Wu A. M. Gambhir S. S. Weiss S. Science. 2005;307:538–544. doi: 10.1126/science.1104274. [DOI] [PMC free article] [PubMed] [Google Scholar]; (c) Medintz I. L. Uyeda H. T. Goldman E. R. Mattoussi H. Nat. Mater. 2005;4:435–446. doi: 10.1038/nmat1390. [DOI] [PubMed] [Google Scholar]; (d) Smith A. M. Nie S. Nat. Biotechnol. 2009;27:732–733. doi: 10.1038/nbt0809-732. [DOI] [PMC free article] [PubMed] [Google Scholar]; (e) Kagan C. R. Lifshitz E. Sargent E. H. Talapin D. V. Science. 2016;353:aac5523. doi: 10.1126/science.aac5523. [DOI] [PubMed] [Google Scholar]; (f) Zhou L. Wu F. Yu J. Deng Q. Zhang F. Wang G. Carbon. 2017;118:50–57. doi: 10.1016/j.carbon.2017.03.023. [DOI] [Google Scholar]
- (a) Sun Y. P. Zhou B. Lin Y. Wang W. Fernando K. A. S. Pathak P. Meziani M. J. Harruff B. A. Wang X. Wang H. Luo P. G. Yang H. Kose M. E. Chen B. Veca L. M. Xie S. Y. J. Am. Chem. Soc. 2006;128:7756–7757. doi: 10.1021/ja062677d. [DOI] [PubMed] [Google Scholar]; (b) Zhu S. Meng Q. Wang L. Zhang J. Song Y. Jin H. Zhang K. Sun H. Wang H. Yang B. Angew. Chem., Int. Ed. 2013;52:3953–3957. doi: 10.1002/anie.201300519. [DOI] [PubMed] [Google Scholar]; (c) Zhu S. Song Y. Zhao X. Shao J. Zhang J. Yang B. Nano Res. 2015;8:355–381. doi: 10.1007/s12274-014-0644-3. [DOI] [Google Scholar]; (d) Hola K. Zhang Y. Wang Y. Giannelis E. P. Zboril R. Rogach A. L. Nano Today. 2014;9:590–603. doi: 10.1016/j.nantod.2014.09.004. [DOI] [Google Scholar]; (e) Zhou L. He B. Huang J. Chem. Commun. 2013;49:8078–8080. doi: 10.1039/C3CC43295E. [DOI] [PubMed] [Google Scholar]
- (a) Warner J. H. Hoshino A. Yamamoto K. Tilley R. D. Angew. Chem., Int. Ed. 2005;44:4550–4554. doi: 10.1002/anie.200501256. [DOI] [PubMed] [Google Scholar]; (b) Kang Z. Liu Y. Tsang C. H. A. Ma D. D. D. Fan X. Wong N. B. Lee S. T. Adv. Mater. 2009;21:661–664. doi: 10.1002/adma.200801642. [DOI] [Google Scholar]; (c) Erogbogbo F. Yong K. T. Roy I. Xu G. Prasad P. N. Swihart M. T. ACS Nano. 2008;2:873–878. doi: 10.1021/nn700319z. [DOI] [PMC free article] [PubMed] [Google Scholar]; (d) Meinardi F. Ehrenberg S. Dhamo L. Carulli F. Mauri M. Bruni F. Simonutti R. Kortshagen U. Brovelli S. Nat. Photonics. 2017;11:177–185. doi: 10.1038/nphoton.2017.5. [DOI] [Google Scholar]
- Lim J. Pyun J. Char K. Angew. Chem., Int. Ed. 2015;54:3249–3258. doi: 10.1002/anie.201409468. [DOI] [PubMed] [Google Scholar]
- Li S. X. Chen D. J. Zheng F. Y. Zhou H. F. Jiang S. X. Wu Y. J. Adv. Funct. Mater. 2014;24:7133–7138. doi: 10.1002/adma.201470287. [DOI] [Google Scholar]
- Shen L. Wang H. Liu S. Bai Z. Zhang S. Zhang X. Zhang C. J. Am. Chem. Soc. 2018;140:7878–7884. doi: 10.1021/jacs.8b02792. [DOI] [PubMed] [Google Scholar]
- (a) Boyd D. A. Angew. Chem., Int. Ed. 2016;55:15486–15502. doi: 10.1002/anie.201604615. [DOI] [PubMed] [Google Scholar]; (b) Chung W. J. Griebel J. J. Kim E. T. Yoon H. S. Simmonds A. G. Ji H. J. Dirlam P. T. Glass R. S. Wie J. J. Nguyen N. A. Guralnick B. W. Park J. Somogyi A. Theato P. Mackay M. E. Sung Y. E. Char K. C. Pyun J. Nat. Chem. 2013;5:518–524. doi: 10.1038/nchem.1624. [DOI] [PubMed] [Google Scholar]
- Wang H. Wang Z. Xiong Y. Kershaw S. V. Li T. Wang Y. Zhai Y. Rogach A. L. Angew. Chem., Int. Ed. 2019;58:7040–7044. doi: 10.1002/anie.201902344. [DOI] [PubMed] [Google Scholar]
- (a) Littlejohn D. Chang S. G. J. Electron Spectrosc. Relat. Phenom. 1995;71:47–50. doi: 10.1016/0368-2048(94)02244-5. [DOI] [Google Scholar]; (b) Siriwardane R. V. Cook J. M. J. Colloid Interface Sci. 1986;114:525–535. doi: 10.1016/0021-9797(86)90438-8. [DOI] [Google Scholar]
- Wang S. Bao X. Gao B. Li M. Dalton Trans. 2019;48:8288–8296. doi: 10.1039/C9DT01186B. [DOI] [PubMed] [Google Scholar]
- Qiao G. Liu L. Hao X. Zheng L. Liu W. Gao J. Zhang C. Wang Q. Chem. Eng. J. 2020;382:122907. doi: 10.1016/j.cej.2019.122907. [DOI] [Google Scholar]
- Zhang C. Zhang P. Ji X. Wang H. Kuang H. Cao W. Pan M. Shi Y. Wang Z. Chem. Commun. 2019;55:13004–13007. doi: 10.1039/C9CC06586E. [DOI] [PubMed] [Google Scholar]
- (a) Zhang T. Stilwell J. L. Gerion D. Ding L. Elboudwarej O. Cooke P. A. Gray J. W. Alivisatos A. P. Chen F. F. Nano Lett. 2006;6:800–808. doi: 10.1021/nl0603350. [DOI] [PMC free article] [PubMed] [Google Scholar]; (b) Derfus A. M. Chan W. C. W. Bhatia S. N. Nano Lett. 2004;4:11–18. doi: 10.1021/nl0347334. [DOI] [PMC free article] [PubMed] [Google Scholar]; (c) Zhou L. Gao C. Xu W. Wang X. Xu Y. Biomacromolecules. 2009;10:1865–1874. doi: 10.1021/bm9002877. [DOI] [PubMed] [Google Scholar]
Associated Data
This section collects any data citations, data availability statements, or supplementary materials included in this article.


