Abstract
Purpose
To evaluate the accuracy of relative stopping power and spatial resolution of images reconstructed with simulated helium CT (HeCT) in comparison to proton CT (pCT).
Methods
A Monte Carlo (MC) study with the TOPAS tool was performed to compare the accuracy of relative stopping power (RSP) reconstruction and spatial resolution of low‐fluence HeCT to pCT, both using 200 MeV/u particles. An ideal setup consisting of a flat beam source and a totally absorbing energy‐range detector was implemented to estimate the theoretically best achievable RSP accuracy for the calibration and reconstruction methods currently used for pCT. The phantoms imaged included a cylindrical water phantom with inserts of different materials, sizes, and positions, a Catphan phantom with a module containing high‐contrast line pairs (CTP528) and a module with cylindrical inserts of different RSP (CTP404), as well as a voxelized 10‐year‐old female phantom. Dose to the cylindrical water phantom was also calculated. The RSP accuracy was studied for all phantoms except the CTP528 module. The latter was used for the estimation of the spatial resolution, evaluated as the modulation transfer function (MTF) at 10%.
Results
An overall error under 0.5% was achieved for HeCT for the water phantoms with the different inserts, in all cases better than that for pCT, in some cases by a factor 3. The inserts in the CTP404 module were reconstructed with an average RSP accuracy of 0.3% for HeCT and 0.2% for pCT. Anatomic structures (brain, bones, air cavities, etc.) in the digitized head phantom were well recognizable and no artifacts were visible with both HeCT and pCT. The three main tissue materials (soft tissue, brain, and cranium) were well identifiable in the reconstructed RSP‐volume distribution with both imaging modalities. Using 360 projection angles, the spatial resolution was 4 lp/cm for HeCT and 3 lp/cm for pCT. Generally, spatial resolution increased with the number of projection angles and was always higher for HeCT than for pCT for the same number of projections. When HeCT and pCT scan were performed to deliver the same dose in the phantom, the resolution for HeCT was higher than pCT.
Conclusion
MC simulations were used to compare HeCT and pCT image reconstruction. HeCT images had similar or better RSP accuracy and higher spatial resolution compared to pCT. Further investigation of the potential of helium ion imaging is warranted.
Keywords: TOPAS, particle CT , stopping power, Monte Carlo, alpha‐particles
1. Introduction
Hadron radiotherapy, mainly with proton beams, is an alternative to photon radiotherapy that is rapidly expanding throughout the world. In some centers in Europe and Asia, carbon ion beams are also used for cancer therapy, and helium and oxygen ions are being considered. In particular at the Heidelberg Ion Beam Therapy Center (HIT), helium ions are available for research purposes. One of the main advantages of using charged particles for cancer treatment is their fixed range in matter. The depth penetration is characterized by the so‐called Bragg peak, a sharp, narrow LET and dose peak localized at the end of the particle path. The depth of the Bragg peak depends on the beam energy at the surface, and little dose is deposited at points distal to the peak. This feature is used to conform the dose to the tumor, sparing nearby organs, with minimal exit dose. Therefore, an accurate knowledge of the range of the ion species in the human body is crucial to fully exploit the potential of hadron radiotherapy in cancer treatments.
The ratio between the stopping power of a given material and the stopping power of water is nearly constant in the clinical range of energies.1 This quantity, called relative stopping power (RSP), is used in clinical practice for ion therapy treatment planning. Currently conventional x‐ray computed tomography (CT) scans are used to retrieve material densities and compositions for the calculation of RSP during treatment planning, converting the Hounsfield Units (HU) for each material into RSP using a calibration curve.2, 3 Since the physics underlying the interaction of photons (used for conventional CT) is different for charged particles (used for treatments), this calibration leads to intrinsic uncertainties in the range determination. To take these uncertainties into account, hadron therapy centers around the world use additional distal margins ranging from 2.5% + 1.5 mm to 3.5% +3 mm. These margins are added during treatment planning, leading to a deliberate overshoot of dose into healthy tissues.4 Recently, there have been many attempts to reduce these margins, such as introducing dual energy CT scans to obtain more accurate RSP data.1, 5, 6, 7 However, these studies were performed using computer simulations or phantom data, never on real patients. Recent studies on fresh animal meat showed for six different DECT acquisition methods that the root‐mean‐square errors for RSP evaluation over all tissue samples were between 0.9% and 1.5%, versus 2.8% for conventional x‐ray CT.8 On the other hand, computed tomography with charged particles (protons and ions) can provide a 3D map of RSP of the object under study, directly reconstructed from energy loss data without any conversion needed.9, 10, 11 Previously, the accuracy of proton CT (pCT) and its dependence on beam purity and technological complexity of a pCT scanner using particle tracking and energy loss or water equivalent path length (WEPL) measurements was evaluated and the maximum accuracy of the RSP reconstruction proved to be better than 1% in most cases.12 However, one disadvantage of pCT is its limited spatial resolution due to multiple Coulomb scattering (MCS), which causes the particle path inside the object to deviate from a straight line. Ions heavier than protons are affected much less by MCS than protons due to the smaller charge‐to‐mass ratio. Comparing protons, helium, lithium, beryllium, boron, and carbon ions of the same initial energy (350 MeV/u), the minimum RMS error of most likely path (MLP) estimates was found to be smallest for helium ions, and only a minor improvement for heavier ions than helium was seen when the comparison was made at the same range.13 Therefore, helium ions were hypothesized to be optimal for imaging and in particular, an increase in image resolution is expected for helium CT (HeCT) compared to pCT. Nonetheless, it is not clear from first principles that the implied benefit of HeCT over pCT is still present when applying iterative reconstruction methods that include a superiorization technique leading to improved spatial resolution. MC simulation or experimental results are needed to prove this hypothesis.
The prototype pCT scanner built by the US pCT collaboration (including Loma Linda University, University of California Santa Cruz, and Northern Illinois University) is composed of a tracking particle telescope consisting of two upstream and two downstream tracking planes followed by a five‐stage energy detector.14 In December of 2016, thanks to a collaboration established between the German Cancer Research Center (DKFZ) in Heidelberg, Germany and the pCT collaboration, this scanner was temporarily installed at the HIT hadron therapy facility in Heidelberg to be tested with helium beams. Although the initial results were promising, the system was, however, not optimized for HeCT and preprocessing as well as calibration can be further improved. In particular, the scintillator in the pCT energy detector was designed and tested for primaries with one quarter of the energy, resulting in saturation and pile‐up effects that need to be addressed in a scanner optimized for HeCT. In the absence of rigorous experimental data, we, therefore, resorted to Monte Carlo (MC) simulations to investigate the differences between pCT and HeCT, which is the main purpose of this work.
Images of various phantoms were obtained with an ideal source and detector system, such that uncertainties deriving from secondary production and detector saturation were disentangled from the problem. The sources of both ion species were 200 MeV/u and the same reconstruction algorithm previously used for pCT12 was employed for both HeCT and pCT. The ideal configuration of the energy detector adopted allowed for the understanding of the maximum potential accuracy obtainable for HeCT, with a specific beam energy of 200 MeV/u, when using a tracker system and reconstruction methods designed for protons.
2. Materials and methods
2.A. Simulation method
All the simulations, for both HeCT and pCT, presented in this study were produced using the simulation toolkit TOPAS15 release 2.0 patch 3, with Geant416, 17 version 10.01 patch 02. The physics list used in the present MC simulations is the default activated for TOPAS applications. This so‐called “Modular Physics List” comprises the following Geant4 classes:“G4EmStandardPhysics_option4”, “G4HadronPhysicsQGSP_BIC_HP”, “G4DecayPhysics”, “G4IonBinaryCascadePhysics”, “G4HadronElasticPhysicsHP”, and “G4StoppingPhysics”. This module was implemented to consider both electromagnetic and nuclear process and was comprehensively validated before.18
2.B. Simulated geometry
For the purpose of comparison of HeCT and pCT, an ideal configuration for the energy measurement was used. This consisted of setting the residual energy of each primary particle (helium ion or proton) to the difference in kinetic energies registered when crossing the two inner‐most plates of the trackers (Fig. 1) and equating this to the energy deposited in the ideal energy detector. This is equivalent to a totally absorbing energy detector. The ideal configuration was adopted to reduce potential errors associated with the complexity of the multistage scintillator, designed for proton energy measurements, which has not yet been optimized for helium ions. Moreover, an ideal rectangular flat ion source (200 × 100 mm2) was used, so that the beam coverage of each phantom was completely uniform. The energy of the helium ion beams was set to 200 MeV/u. Comparisons were made to previous simulations of pCT scans of the same phantoms, realized with proton beam at 200 MeV/u with the ideal energy detector, from configuration A of Piersimoni et al. 2017.12
Figure 1.
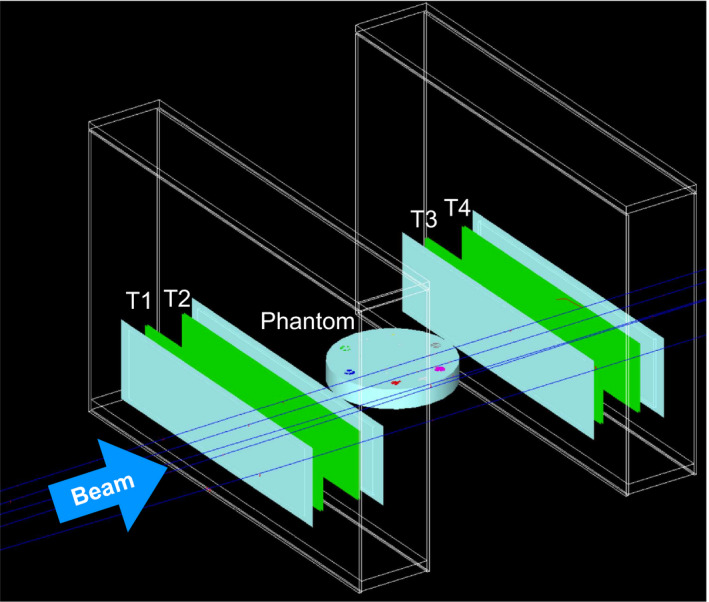
The particle CT scanner geometry for pCT and HeCT as implemented in the TOPAS simulations. The phantom, here a plastic cylinder with inserts, was positioned at the isocenter; the front and rear tracker planes (rectangular structures T1, T2, T3, T4) were symmetric with respect to the isocenter. The phantom was rotated about the vertical axis through the isocenter in a given number of discrete steps. [Color figure can be viewed at wileyonlinelibrary.com]
2.C. Simulated water equivalent path length calibration
The reconstruction code needs the water equivalent path length (WEPL) as input. The WEPL calibration of the scanner is therefore critical to the accuracy of pCT and HeCT reconstruction. For the previous experimental pCT scans, a polystyrene wedge phantom was developed to speed up and simplify the experimental calibration procedure.12 For the TOPAS simulations, a polystyrene wedge phantom was used to match the experimental setup, with thickness increasing from 0 to 50.8 mm over a length of 254 mm. The polystyrene composition for the simulation was taken from the NIST material database, with a density of 1.06 g/cm3 (Table 1). As illustrated in Fig. 2, in addition to the wedge, four polystyrene bricks (280.0 × 120.0 × 50.8 mm3 thick) stacked 1–4 bricks high were used for a total of five individual calibration runs. A passage of 2 million primary histories was simulated for each run, with an ideal rectangular flat ion source (360 × 90 mm2). Using the tracker information, it is possible to calculate the straight‐line path length of each single particle inside the polystyrene phantom (see Fig. 2). This length, multiplied by the RSP value calculated for polystyrene, corresponds to the WEPL of the particle crossing the phantom. In the ideal configuration adopted for this study, the energy loss (E f − E i ) was retrieved from the tracker information, for each single‐particle track. This yielded a collection of a continuous WEPL‐energy distribution, which was discretized into 250 WEPL steps of 1 mm. For each WEPL step, the energy distribution, well approximated by a Gaussian, was plotted. For each of these energy distributions, the mean and standard deviation were calculated from the Gaussian fit. Subsequently, the WEPL values were plotted in 1‐mm steps against the mean values of residual energy, with their standard deviations and fitted with 2nd and 4th degree polynomial curves. The 4th degree fit was chosen because its WEPL accuracy was ~10% better with respect to the 2nd degree curve. The calibration curve was then used in the preprocessing of data obtained from the HeCT and pCT simulations, to convert the residual energy for each single primary history into WEPL.
Table 1.
Material composition showing percentages by weight for the insert materials in the CTP404 phantom. The polystyrene was the same as for the calibration wedge phantom. Water was simulated as G4_Water; that is, H2O with I = 78 eV, with a density of 1.0 g/cm3
| Material | Element (Percentage by weight) | Density (g/cm3) | RSP (He) |
|---|---|---|---|
| Delrin | H (6.7), C (40.0), O (53.3) | 1.420 | 1.373 |
| Polymethylmethacrylate (PMMA) | H (8.1), C (60.0), O (31.9) | 1.190 | 1.174 |
| Polystyrene (G4_Polystyrene) | H (7.74), C (92.26) | 1.060 | 1.043 |
| LDPE (G4_Polyethylene) | H (14.37), C (85.63) | 0.940 | 1.002 |
| Polymethylpentene (PMP) | C (85.6), H (14.4) | 0.830 | 0.887 |
| Teflon (G4_Teflon) | C (24.02), F (75.98) | 2.20 | 1.846 |
| Epoxy | C (71.09), O (19.08), H (7.8), N (2.03) | 1.160 | 1.144 |
Figure 2.
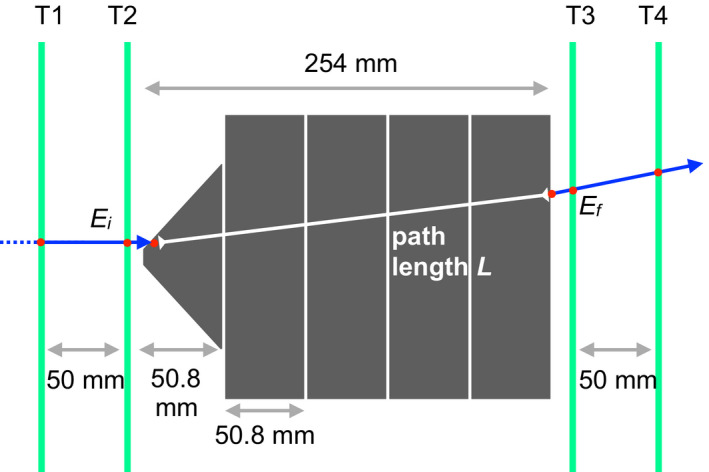
A sketch illustrating the WEPL calibration procedure. The polystyrene wedge (on the left‐hand side) provides a smooth variation in polystyrene thickness between 0 and 50.8 mm. Four polystyrene bricks, 50.8 mm thick, are added consecutively, so that with just five runs the full range of WEPL from 0 to 254 mm is covered. The straight‐line path length through polystyrene, L, is calculated using tracking information coming from planes T1, T2, T3, and T4. [Color figure can be viewed at wileyonlinelibrary.com]
2.D. Estimation of RSP reference values
The reference RSP values for the comparison with the reconstructed values, were calculated with the Geant4's Bethe–Bloch equation via the GetDEDX method in the G4EmCalculator class using an effectively infinite production cut, as described previously.12 The compositions and the reference RSP values for the bulk of the materials used in this work are reported in our previous publication,12 with the additional materials used in the present study reported in Table 1.
2.E. Simulated phantoms
Several phantoms were simulated to investigate the dependence of the reconstructed RSP accuracy on the insert material, the insert dimension, and its radial position. A detailed description is reported below.
Water cylinder of 150 mm diameter and 80 mm long.
Insert Phantom 1 (IP1): water cylinder with same dimensions as above, with five inserts (each insert 80 mm long, 15 mm radius) made of different materials; one insert made of tooth dentine was placed at the phantom center, the remaining four, made of brain tissue, trabecular bone, tooth enamel, and cortical bone, were placed with their centers 50 mm from the phantom center.
Insert Phantom 2 (IP2): water cylinder as above, with two series of six inserts each (one series made of brain tissue, the other made of cortical bone), 80 mm long, of different radii (2, 4, 6, 8, 10, and 12 mm) placed with their centers 50 mm from the center of the phantom.
Insert Phantom 3 (IP3): water cylinder as above, with five series of three inserts, 80 mm long, 8 mm radius, placed at three different distances (20, 40, 60 mm) from the phantom center. The materials of each series of inserts were the same as in IP1.
In addition to these phantoms, the Catphan® (The Phantom Laboratory, Salem, NY, New York) phantoms, sensitometry module CTP404, and high‐resolution module CTP528 were also simulated for HeCT and pCT. The Catphan phantoms are available for experimental runs; hence, a comparison between simulated and experimental scans will be possible in the future. The sensitometry module (henceforth CTP404 phantom) has a diameter of 150 mm, a thickness of 40 mm, and contains eight cylindrical cavities of 12.2 mm diameter, six of them filled with different materials, and two filled with air (Fig. 3, left). Material compositions and densities are reported in Table 1. The high‐resolution module (henceforth CTP528 phantom) has a diameter of 150 mm, a thickness of 80 mm, and contains 21 groups of high‐contrast aluminum bars ranging from 1 to 21 line pairs per cm, arranged such that all patterns share the same distance from the center of the phantom (Fig. 3, right). The pCT scans for the CTP404 in this study used the same simulation setup as described for HeCT, with the same energy of 200 MeV/u, simply by changing the particle type in the TOPAS simulation.
Figure 3.
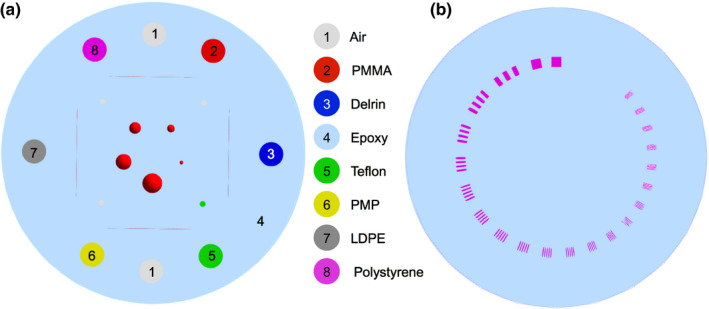
The CTP404 phantom (left) and the CTP528 phantom (right) as implemented in the TOPAS simulation. Details about the material compositions and densities are given in Table 1. [Color figure can be viewed at wileyonlinelibrary.com]
In addition, a digital head and trunk phantom of a 10‐year‐old human female was simulated.19 To fit the phantom in the pCT scanner in the simulation, only the head was scanned. The head phantom consisted of 84 × 104 × 103 cubic, 2 mm width voxels. Each voxel was assigned a specific material composition and density, according to ICRP report 110.20 Material compositions details are given in Table 5 of Lee et al., 2010.19
2.F. Image reconstruction
All pCT and HeCT simulations had 90 projections at 4° steps except for the CTP528 line pair phantom, which was scanned with 90, 180, and 360 projections; i.e., with angular steps of 4°, 2°, and 1°, respectively. This setup was chosen to match the reconstruction settings shown on our previous publication about pCT uncertainties. The limitation to 90 projections was made since previous works demonstrated the equivalency of this setting to a continuous scan, regarding the RSP reconstruction accuracy.21 The image reconstruction method for HeCT was the same as used previously for pCT.12 The simulated images were reconstructed with six iterations of the DROP‐TVS22 algorithm using a slice thickness of 1.25 mm and starting from a FBP‐reconstructed image as the initial iterate; the algorithm used 40 blocks, and a relaxation parameter of 0.1 for the block iterative reconstruction. The reconstructed images had a matrix of 256 × 256 pixels in an evenly spaced grid with 0.66 mm spacing for all phantom, except the CTP528 phantom and the digitized head phantom. For the CTP528 phantom 512 × 512 pixels with 0.33 mm spacing were used. For the reconstructed images of the anthropomorphic phantom, the original voxel size of the digital phantom (2 × 2 × 2 mm3) was kept. Knowing the material density and composition of each single voxel, a voxel‐by‐voxel comparison was possible for reference and reconstructed RSP values.
2.G. Modulation transfer function
For a more quantitative investigation of the impact of the number of projections taken for a full scan on the achievable image quality, the modulation transfer function (MTF) was evaluated using the line pair inserts of the CTP528 phantom. A profile of the RSP values averaged over a region of interest (ROI) was measured for the line pair inserts at different spatial frequencies f in lp/cm. For each line pair frequency, the contrast ratio of the ith maximum in the RSP profile (max i ) and its adjacent minimum (min i ) was computed. The value was then averaged over the total number (N) of maximum/minimum pairs in the profile, to give a robust value. The contrast ratio C(f) was calculated as:
| (1) |
A discrete MTF was then calculated by scaling the contrast ratio at each spatial frequency to the contrast ratio at zero lp/cm (C(0)):
| (2) |
C(0) was calculated using as max 0 the RSP peak value for the 1 lp/cm insert and as min 0 the average RSP value in a ROI close to the edge of the phantom, as far as possible from the same insert. A regression to a sigmoid function was performed to suppress noise. The MTF10% was used to characterize the spatial resolution of the imaging system, in lp/cm.23
2.H. Dose comparison for HeCT and pCT
The average absorbed dose from pCT and HeCT scans was calculated in the homogeneous water cylinder. The phantom was irradiated with a total number of 107 primary particles delivered from four cardinal angles to yield statistically independent measurements. Each of the simulated projections consisted of 2.5 × 10⁶ particles with an initial energy of 200 MeV/u. A uniform 150 × 80 mm2 source was used to fully cover the phantom proximal surface, with all particles hitting the phantom, in order to give an estimation of dose as function of the particle fluence. The average dose to water deposited in the phantom was calculated by summing the energy loss of all particles (both primaries and secondaries) within the phantom at each step of the simulation, and by dividing the sum by the total mass of the phantom.
3. Results
3.A. Accuracy of the reconstructed RSP values
The helium WEPL calibration curve, fit to the points representing the WEPL values as a function of the residual energy (see section 2.C), is shown in Fig. 4 with its associated accuracy. The curve was used for the conversion from energy to WEPL for all HeCT reconstructed images presented in this article. The WEPL average accuracy was 1.06 mm.
Figure 4.
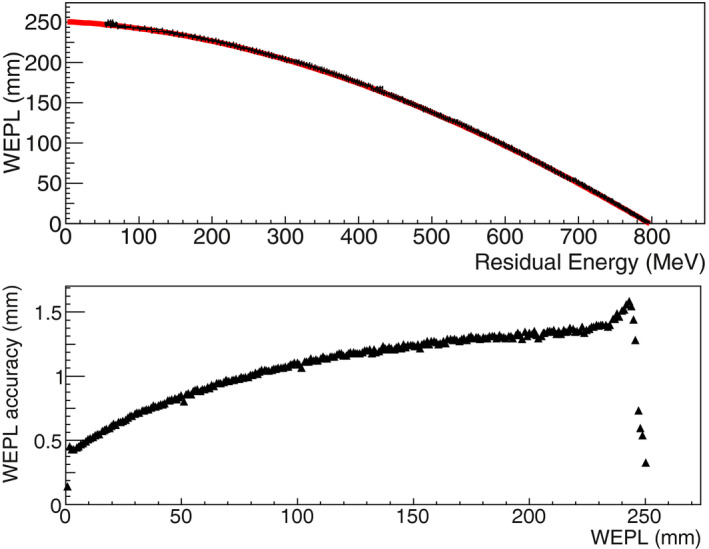
Top: The HeCT residual‐energy‐to‐WEPL 4th degree polynomial calibration curve (red line) calculated using a polystyrene wedge phantom and a monoenergetic rectangular helium source, shown with the average residual energy per each WEPL step of 1 mm (black points). Bottom: The accuracy, corresponding to the derivative of the curve calculated at each point, as a function of WEPL. [Color figure can be viewed at wileyonlinelibrary.com]
Fig. 5 shows the central axial HeCT slice of the reconstructed homogeneous water phantom (left) along with the profile of the RSP values along the line |z| ≤ 1 mm in comparison with the pCT result obtained previously with a similar method (right).
Figure 5.
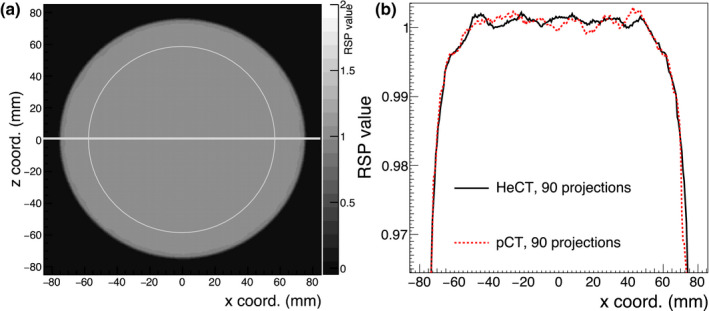
(a): Central axial slice through the HeCT reconstructed RSP images of the water cylinder. (b): Comparison of the profiles along a horizontal line through the center of the image, as shown on the left, for HeCT and pCT. The expected RSP in the phantom is unity. [Color figure can be viewed at wileyonlinelibrary.com]
The distributions of the water RSP values for HeCT and pCT are shown in Fig. 6. The distribution of RSP values was evaluated within a circular area of 60 mm radius (shown in Fig. 5, left) for 10 consecutive slices in the central region of the phantom. The average RSP value was 1.0002 ± 0.0014 for both HeCT and pCT. The uncertainties of the mean values were estimated as the root mean square of the reconstructed RSP distributions. The maximum error in the same circular area was 0.38% and 0.42% for HeCT and pCT, respectively.
Figure 6.
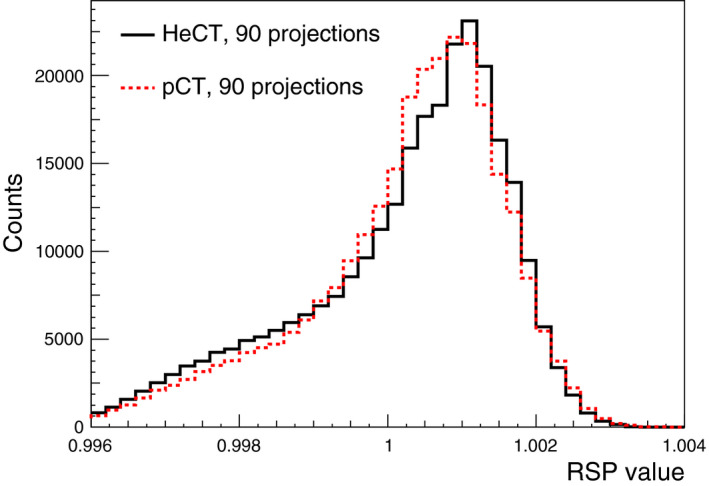
The RSP distribution in a circular area with a radius of 60 mm centered in the water phantom including the 10 slices from five slices below and four slices above the central slice shown in Fig. 5. [Color figure can be viewed at wileyonlinelibrary.com]
The HeCT reconstructed images for the IP1, IP2, and IP3 phantoms are shown in Fig. 7, from left to right, respectively. The colored circles indicate ROIs where the RSP values for each material insert were evaluated. For all three phantoms, the ROIs were chosen with a radius of half that of the inserts; that is, 7.5 mm radius for IP1, 4 mm for IP3, and 1–6 mm in 1 mm increments from the smallest to the largest insert for IP2. These radii were chosen to avoid the region of the inserts close to the edge, where MCS would cause systematic RSP error due to loss of spatial resolution.21 For each insert in phantoms IP1, IP2, and IP3, the reconstructed RSP values enclosed in the ROIs described above were averaged over ten consecutive axial slices. The percentage differences between these mean values and the reference values, normalized over the reference values, were used as an estimate of the accuracy of HeCT and pCT.
Figure 7.

HeCT central axial slice of the reconstructed IP1 (left), IP2 (middle), and IP3 (right) phantoms. The RSP values were measured within the ROIs indicated by the colored circles. The RSP values were averaged over ten consecutive tomographic slices, centered on the slice shown in the figure. [Color figure can be viewed at wileyonlinelibrary.com]
The comparison of HeCT and pCT reconstructed RSP errors is shown in Figs. 8, 9, and 10 for IP1, IP2, and IP3, respectively. For IP1 (Fig. 8), all the insert material RSP values were reconstructed with an accuracy better than 0.2% for HeCT, compared to 0.6% for pCT. The error for pCT was twice as big, or more, as the corresponding error for HeCT. For IP2 (Fig. 9) for the smallest inserts for both series (2 mm radius) the error for HeCT and pCT, respectively, was −2.9% and −3.6% for brain tissue, −5.6% and −6.5% for cortical bone. For the second smallest insert (4 mm radius), the error was about 0.7% for both HeCT and pCT for both materials, except for brain tissue reconstructed with pCT, which was ‐1.2%. For all inserts larger than 4 mm radius the error was smaller than 0.5% for HeCT, 0.8% for pCT. For IP3 (Fig. 10), the error in the reconstructed RSP values was lower than 0.4% for all of the inserts for HeCT, 0.75% for pCT. There was no obvious trend for accuracy versus radial position of the inserts in the phantom.
Figure 8.
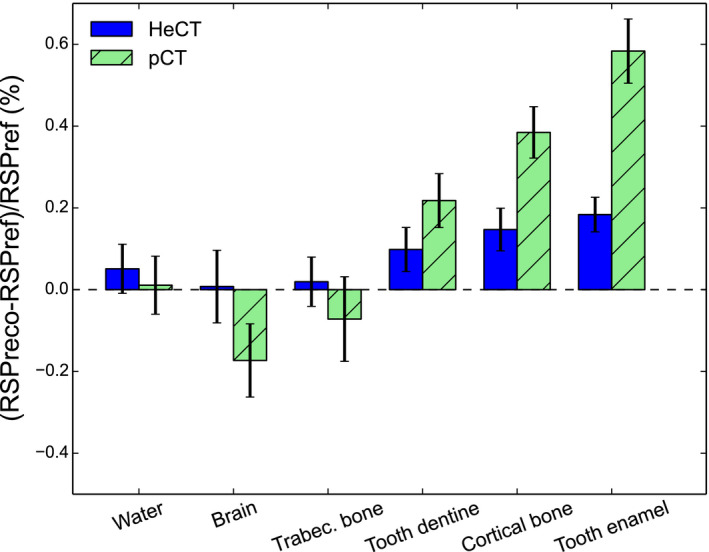
Comparison of the reconstructed RSP errors for the IP1 phantom using HeCT (dark bars) and pCT (dashed bars). As indicated on the vertical axis label, the RSP percentage error is calculated by subtracting the reference values from the reconstructed ones, and normalizing over the reference value. The black error bars represent the percentage relative standard deviations in each ROI (see Fig. 7). [Color figure can be viewed at wileyonlinelibrary.com]
Figure 9.
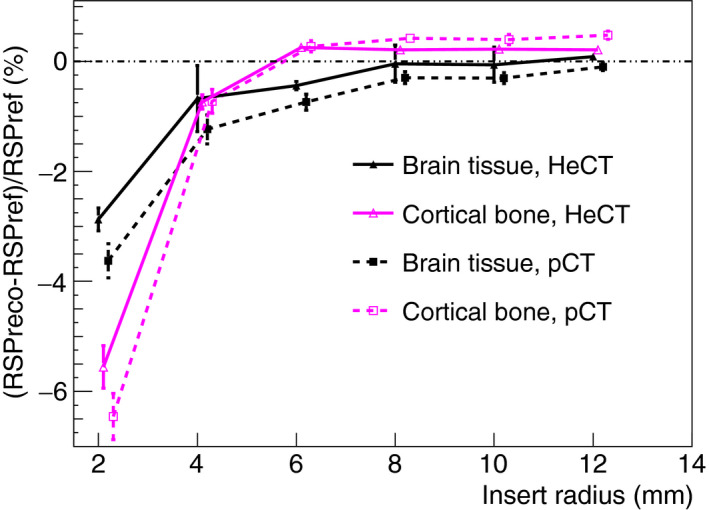
Comparison of RSP errors for HeCT and pCT versus insert radius, for the IP2 phantom. The error bars represent the percentage relative standard deviations. The insert radii for the points shown are 2, 4, 6, 8, 10, or 12 mm. In the graph, the points were slightly shifted to make the markers and error bars on the different points easier to see. [Color figure can be viewed at wileyonlinelibrary.com]
Figure 10.
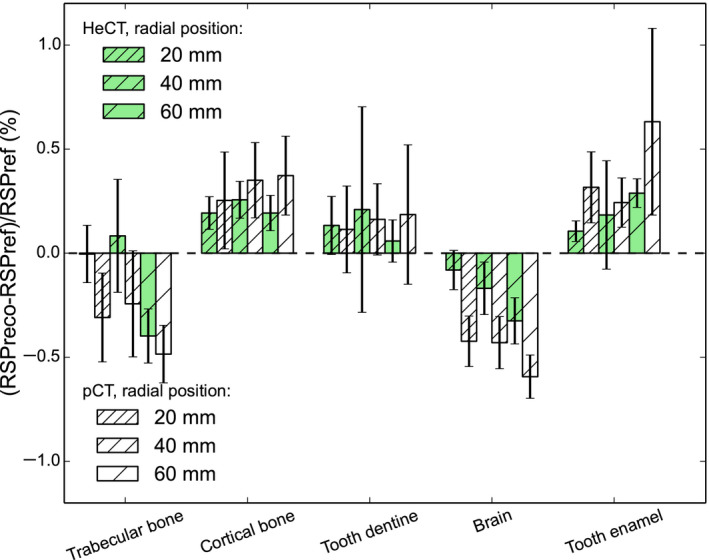
Error comparison for the reconstructed RSP values of the inserts in the IP3 phantom for HeCT (green bar) and pCT (white bar) for inserts at different distances from the phantom center, which correspond to the isocenter. The error bars represent the percentage relative standard deviations. The different shades represent the distances of the inserts along the radial dimension (20, 40, or 60 mm). [Color figure can be viewed at wileyonlinelibrary.com]
For the CTP404 phantom, the reconstructed image for HeCT and the comparison plot with the pCT result for an ROI radius of 3 mm are shown in Fig. 11. The errors for air inserts were around 50% or more for both HeCT and pCT, and they could not be plotted in the same graph. The errors for HeCT and pCT were, respectively, lower than 0.55% and 0.35% for all inserts other than air. The mean and range of the of the percentage errors, calculated as described above, for all inserts in the IP1, IP2, IP3, and CTP404 phantoms are reported in Table 2 for both HeCT and pCT. The smallest inserts in IP2, which had significantly higher RSP errors due to edge effects, were not included in the mean. The mean error for HeCT was one‐third that of pCT for IP1, about one half for IP2 and IP3. Conversely, the mean error for CTP404 was for HeCT was about five‐fourths that of pCT.
Figure 11.
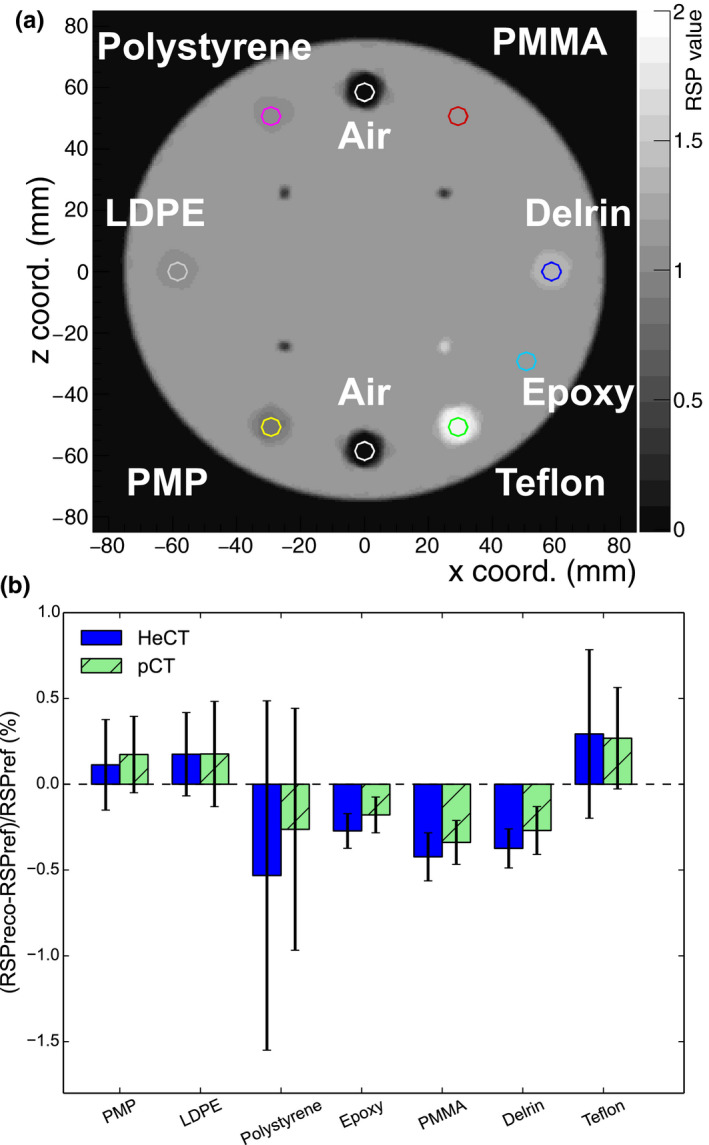
(a): An axial slice of the reconstructed CTP404 phantom using 90 projections. (b): RSP errors obtained for the different materials (except for air) of the CTP404 phantom with pCT and HeCT. [Color figure can be viewed at wileyonlinelibrary.com]
Table 2.
Mean percentage errors (evaluated as the absolute value of the difference between the reconstructed RSP value and the reference, divided by the reference) and range of the of the percentage errors for the material inserts in the different phantoms. The error in RSP for the smallest inserts in the IP2 phantom was excluded in the calculation of the mean, as well as for the air inserts in the CTP404 phantom
| HeCT | pCT | |||||
|---|---|---|---|---|---|---|
| Phantom | Mean (%) | Minimum (%) | Maximum (%) | Mean (%) | Minimum (%) | Maximum (%) |
| IP1 | 0.08 | 0.01 | 0.18 | 0.24 | 0.01 | 0.58 |
| IP2 | 0.29 | −0.04 | −0.74 | 0.50 | −0.10 | −0.73 |
| IP3 | 0.18 | 0.00 | −0.40 | 0.33 | 0.11 | 0.63 |
| CTP404 | 0.31 | 0.11 | −0.53 | 0.24 | 0.17 | −0.34 |
3.B. Head phantom reconstruction
Sagittal, coronal, and three axial views of the HeCT reconstructed digitized head phantom are shown in Fig. 12. The reconstruction voxel size was exactly the same as the voxel size of the digitized phantom. RSP distributions over the reconstructed HeCT, pCT volumes, and the reference RSP values are shown in Fig. 13. The main peaks correspond to the RSP values of soft tissue, brain tissue, and cranium.
Figure 12.
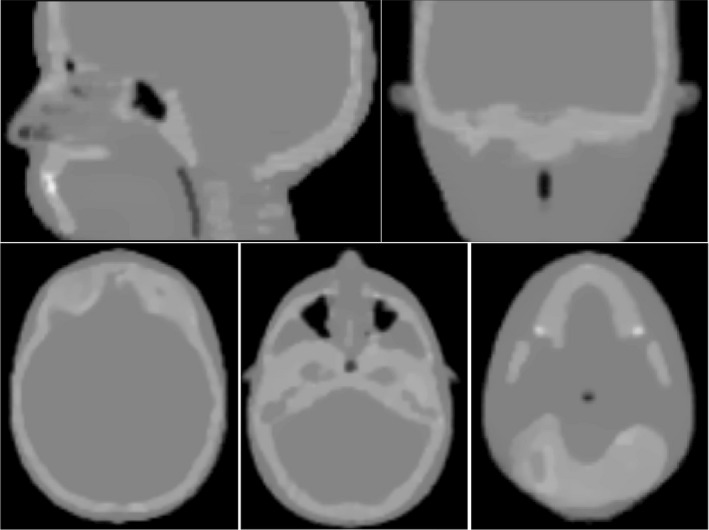
HeCT reconstructed images of the digitized head phantom. Each slice is 2 mm thick with 120 × 120 pixels of width 2 mm used for the reconstruction.
Figure 13.
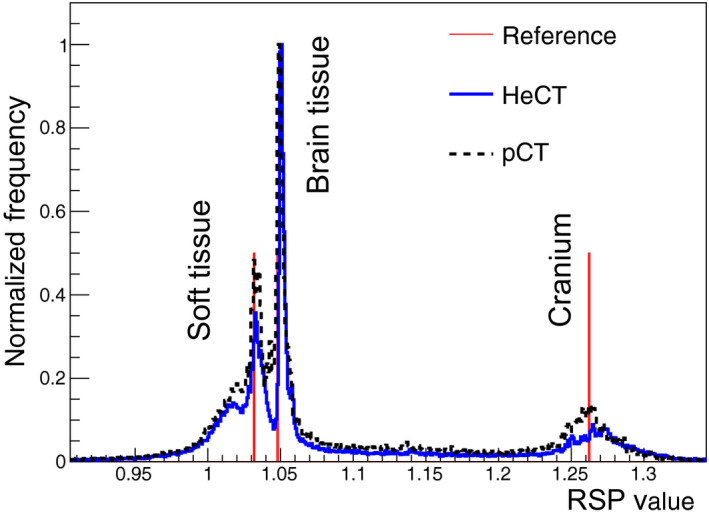
RSP‐value frequency distributions for the HeCT (solid blue line) reconstructed head phantom compared to pCT (dashed black line) and to the reference values (red lines). The normalization is such that the maximum frequency for brain tissue is unity. For the reference values, the vertical lines only indicate the value of the RSP, not the frequency. [Color figure can be viewed at wileyonlinelibrary.com]
3.C. CTP528 module reconstruction: evaluation of spatial resolution
Axial slices of the reconstructed CTP528 phantom are shown in Fig. 14 for HeCT and pCT for 90, 180, and 360 projection angles. The images in Fig. 14 were analyzed and, for each reconstructed image, the maximum value for the biggest aluminum insert, and an average value of the Epoxy material far from this insert, were used for the calculation of the C(0) value in equation (2). The MTF evaluated through the line pairs of the CTP528 phantom are shown in Fig. 15 with sigmoid functions fit to the data for the 90, 180 and 360 projections. For both HeCT and pCT, spatial resolution was improved with increasing number of projections. For 360 projections, the MTF50% was 2.00 lp/cm and 1.39 lp/cm, for HeCT and pCT, respectively, and the MTF10% was 3.70 lp/cm and 3.24 lp/cm, for HeCT and pCT, respectively.
Figure 14.
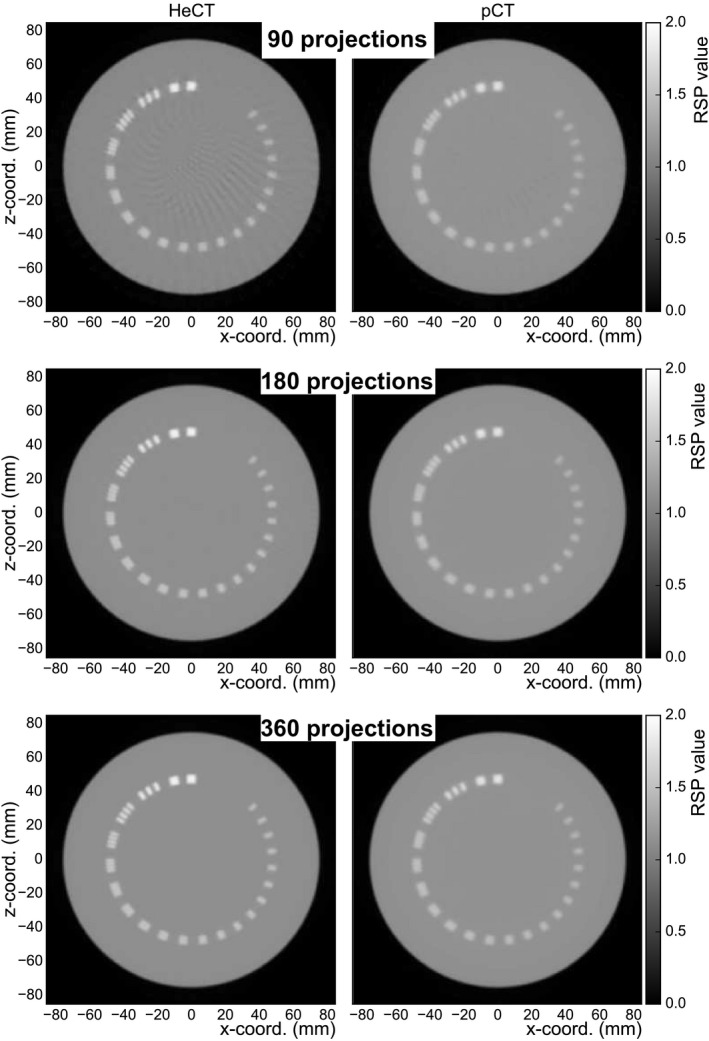
Axial slices of the reconstructed CTP528 phantom for HeCT (left) and pCT (right) with different number of projection angles. The reconstructed images have a slice thickness of 1.25 mm with 512 × 512 pixels in an evenly spaced grid with 0.33 mm spacing.
Figure 15.
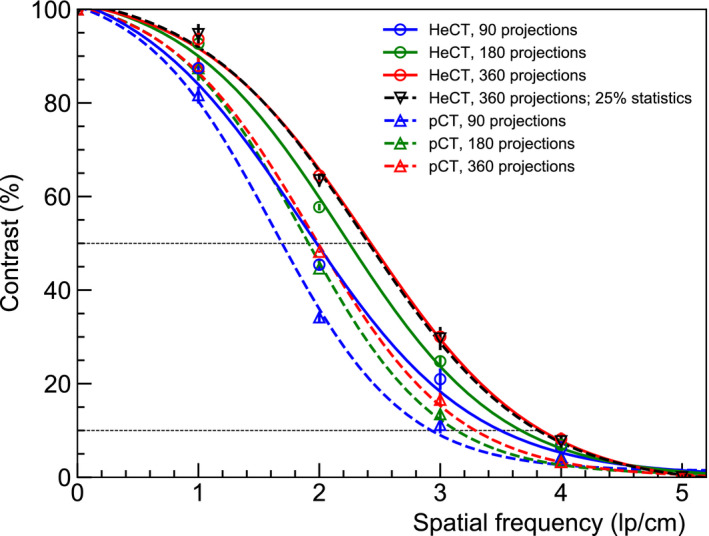
MTF for of HeCT (solid) and pCT (dashed) evaluated through the CTP528 phantom. The tomographic scans were acquired using 90 (red), 180 (green), and 360 (blue) projection angles. A regression to a sigmoid was performed to suppress noise. The black dashed line represents the MTF for the HeCT reconstruction image using only 25% of the original statistics. [Color figure can be viewed at wileyonlinelibrary.com]
3.D. Dose estimation
The dose was evaluated based on the homogeneous water phantom as described in section 2.H. The result was averaged over the four independent simulated projections. The estimated deposited dose was 66.385 ± 0.009 μGy per 2.5 × 10⁶ particles for HeCT and 17.522 ± 0.003 μGy per 2.5 × 10⁶ particles for pCT. The total dose given to the homogeneous water cylinder for acquiring the pCT and HeCT images presented in Fig. 5 can be extrapolated using this information. For both pCT and HeCT, a total of 1.08 × 10⁸ particles hit the water phantom. The overall dose to the water phantom was 2.87 mGy for the HeCT and 0.76 mGy for the pCT. The higher deposited dose for helium is expected because the total stopping power for helium ions at 200 MeV/u is about four times the stopping power of protons at the same energy.
To compare RSP images at the same dose deposition for HeCT and pCT, the spatial resolution was evaluated for HeCT with only 25% of the primary histories with respect to the original 2 million particles per projection used for HeCT and pCT. The reduction of the primary helium ions did not affect the image quality of HeCT, which still resulted visually better than pCT. For a more quantitative comparison, the MTF functions were calculated and are shown in Fig. 15. Since the spatial resolution for HeCT was not affected when reducing the statistics, it resulted in higher resolution than pCT at the same dose as well as with the same number of projections.
4. Discussion
In this work, the capabilities of HeCT were assessed using the MC method and compared to pCT. The ideal energy detector allowed the disentanglement of the energy detector performance and calibration and to test the functioning of the tracker and the reconstruction method. For the idealized energy‐to‐WEPL calibration curve of HeCT, shown in Fig. 4, an average WEPL error of 1.06 mm was obtained, whereas for pCT12 in the same condition it was 2.08 mm, which is almost double. This is an additional proof of the smaller deviation of helium beams with respect to protons. Moreover, the WEPL values for each single‐particle track, which are used as input for the reconstruction code, can be estimated with a double accuracy for HeCT than for pCT. On the plot the left of Fig. 4, a periodic data point below the general trend at 50, 100, 150, 200 mm WEPL can be observed. Since the wedge used for the calibration is smaller than the bricks, there are points having the same thickness crossed but with double statistics. For example, one particle could cross the thickest part of the wedge, that is 50.8 mm, and another one, in the next run, could cross just one brick and no wedge at all. The resulting thickness would be again 50.8 mm. This sort of resonance effect enhances the statistics for such thicknesses, consequently slightly improving the accuracy for those points. The average RSP value for water was closer to the expected value of unity for HeCT than for pCT. For example, for the IP1 phantom, as shown in Fig. 8 and Table 2, an average accuracy of 0.08% was obtained with HeCT, one‐third with respect to pCT. Overall, the RSP accuracy for HeCT for this phantom was always better than pCT. The accuracy for pCT showed a larger degradation with increasing density of the material than the results for HeCT. The plots for IP2 (Fig. 9) show how the accuracy for HeCT is better than pCT for all of the inserts. Particularly, for the smallest inserts (2 mm radius) HeCT was ~1% more accurate and for the second smallest (4 mm radius), the accuracy of HeCT was well below 1% while for pCT the error was still above 1% for one material. This can be considered a first demonstration of the effect on RSP of the hypothesized higher spatial resolution of HeCT with respect to pCT. Also for the IP3 phantom, the error for HeCT was smaller than for pCT in most cases (Fig. 10) and the average accuracy was about twice as better than pCT (Table 2). For the CTP404 phantom, the accuracy is slightly better for pCT than for HeCT. This tendency can be attributed to the fact that the latter phantom contains more inserts with higher density materials, which enhance the probability of nuclear reaction, corresponding to loss of primary helium particles and consequently loss of statistics and reconstruction accuracy. For a realistic human head phantom, the HeCT reconstruction led to good image quality: all anatomical structures (brain, skull, teeth, air cavities, etc.) were well recognizable without visible artifacts (Fig. 12). The three main tissue materials (soft tissue, brain, and cranium) were clearly identifiable in the reconstructed RSP frequency distribution (Fig. 13) and their mean RSP values agreed with the reference values to 1% or better.
The spatial resolution of HeCT was clearly better than that for pCT, regardless of the number of projections used, confirming improved spatial resolution with helium, due to a lower scattering power than for protons. For HeCT, the reconstructed image with 90 projections showed minor radial artifacts (Fig. 14 top left). These are typical artifacts in the presence of high‐density structures produced by the initial filtered back projection (FBP), which serves as the starting image for the iterative reconstruction algorithm. For pCT, these radial artifacts are washed out due to its poorer spatial resolution. Increasing the number of projections led to a visual improvement of the reconstructed images, as well as of the quantitative spatial resolution, which was about 4 lp/cm for the 360 projections. The best spatial resolution for pCT, with 360 projections, was no better than the spatial resolution for HeCT for only 90 projections. An increase in dose in the water phantom by a factor close to 4 was found for HeCT compared to pCT, explained by the higher stopping power of helium. It is, however, possible to reduce the number of projections used with HeCT by a similar factor without compromising the better spatial resolution of HeCT. Moreover, as shown in Fig. 15, reducing the number of primary helium ions for HeCT with 360 projections, so that roughly the same dose was deposited in the phantom, did not lead to a loss of spatial resolution. Therefore, at the same dose level, with the same number of projections, HeCT provides at least as high an RSP accuracy as pCT, a much higher accuracy for millimeter‐sized structures, and better spatial resolution.
5. Conclusions
The mean RSP error for all phantoms examined was 0.5% or better for HeCT, 0.8% for pCT, excluding the smallest inserts in the IP2 phantom. This can be considered the best possible accuracy achievable using a practical arrangement of track detectors and an ideal energy detector using the calibration method and reconstruction algorithm previously established for pCT. Thus, the reconstruction methods that have been developed for pCT with single‐particle tracking can be adopted for HeCT, leading to accurate RSP reconstruction results, which were similarly good for HeCT and pCT for the same particle fluence and also for the same dose deposition in the phantom or patient, despite the larger number of nuclear interactions with HeCT. In cases with millimeter‐sized objects embedded in a background material, where spatial resolution is important, the better performance of HeCT with respect to pCT leads to better RSP accuracy. The quality of the image reconstruction allowed a successful identification of relevant anatomical features in a pediatric head phantom. The most encouraging result with HeCT was its superior spatial resolution. Also, the HeCT images improved notably when increasing the number of projections from 90 to 180 or 360. The spatial resolution was always higher for HeCT, independent of the number of projections used. The best resolution obtained for protons with 360 projections corresponded to the spatial resolution for helium with only 90 projections. The higher dose from HeCT for the same source fluence can be compensated using a lower number of projections while achieving comparable spatial resolution, or the same number of projections but with 25% of the primary particles used for pCT.
The results shown in this paper demonstrate the value of further investigating the potential of HeCT. In particular, using helium in CT scanning could help to further improve the spatial resolution achievable for ion imaging and may then be preferred to using protons, if a dedicated HeCT system can be developed.
Conflict of interest
The authors have no relevant conflicts of interest to disclose.
Acknowledgments
We gratefully acknowledge grant support from the National Cancer Institute (NCI) of the National Health Institute (NIH), award number 1P20CA183640‐A101, and the United States – Israel Binational Science Foundation (BSF) grant number 2013003.
References
- 1. Yang M, Zhu XR, Park P, et al. Comprehensive analysis of proton range uncertainties related to patient stopping‐power‐ratio estimation using the stoichiometric calibration. Phys Med Biol. 2012;57:4095–4115. [DOI] [PMC free article] [PubMed] [Google Scholar]
- 2. Van Elmpt W, Landry G, Das M, Verhaegen F. Dual energy CT in radiotherapy: current applications and future outlook. Radiother Oncol. 2016;119:137–144. [DOI] [PubMed] [Google Scholar]
- 3. Schneider U, Pedroni E, Lomax A. The calibration of CT Hounsfield units for radiotherapy treatment planning. Phys Med Biol. 1996;41:111. [DOI] [PubMed] [Google Scholar]
- 4. Paganetti H. Range uncertainties in proton therapy and the role of Monte Carlo simulations. Phys Med Biol. 2012;57:R99–R117. [DOI] [PMC free article] [PubMed] [Google Scholar]
- 5. Hünemohr N, Paganetti H, Greilich S, Jäkel O, Seco J. Tissue decomposition from dual energy CT data for MC based dose calculation in particle therapy. Med Phys. 2014;41:061714. [DOI] [PMC free article] [PubMed] [Google Scholar]
- 6. Hansen C, Seco J, Sørensen TS, et al. A simulation study on proton computed tomography (CT) stopping power accuracy using dual energy CT scans as benchmark. Acta Oncol. 2015;54:1638–1642. [DOI] [PubMed] [Google Scholar]
- 7. Zhu J, Penfold S. Dosimetric comparison of stopping power calibration with dual‐energy CT and single‐energy CT in proton therapy treatment planning. Med Phys. 2016;43:2845. [DOI] [PubMed] [Google Scholar]
- 8. Taasti VT, Michalak GJ, Hansen DC, et al. Validation of proton stopping power ratio estimation based on dual energy CT using fresh tissue samples. Phys Med Biol. 2017;63:015012. [DOI] [PubMed] [Google Scholar]
- 9. Bashkirov VA, Johnson RP, Sadrozinski HF‐W, Schulte RW. Development of proton computed tomography detectors for applications in hadron therapy. Nuclear Instruments Methods Phys A. 2016;809:120–129. [DOI] [PMC free article] [PubMed] [Google Scholar]
- 10. Bashkirov VA, Schulte RW, Hurley RF, et al. Novel scintillation detector design and performance for proton radiography and computed tomography. Med Phys. 2016;43:664–674. [DOI] [PMC free article] [PubMed] [Google Scholar]
- 11. Giacometti V, Bashkirov VA, Piersimoni P, et al. Software platform for simulation of a prototype proton CT Scanner. Med Phys. 2017;44:1002–10015. [DOI] [PMC free article] [PubMed] [Google Scholar]
- 12. Piersimoni P, Ramos‐Mendez J, Geoghegan T, Bashkirov VA, Schulte RW, Faddegon BA. The effect of beam purity and scanner complexity on proton CT accuracy. Med Phys. 2017;44:284–298. [DOI] [PMC free article] [PubMed] [Google Scholar]
- 13. Collins‐Fekete C‐A, Volz L, Portillo SKN, Beaulieu L, Seco J. A theoretical framework to predict the most likely ion path in particle imaging. Phys Med Biol. 2017;62:1777–1790. [DOI] [PubMed] [Google Scholar]
- 14. Johnson RP, Bashkirov VA, Dewitt L, et al. A fast experimental scanner for proton ct: technical performance and first experience with phantom scans. IEEE Trans Nucl Sci. 2016;63:52–60. [DOI] [PMC free article] [PubMed] [Google Scholar]
- 15. Perl J, Shin J, Schümann J, Faddegon B, Paganetti H. TOPAS: an innovative proton Monte Carlo platform for research and clinical applications. Med Phys. 2012;39:6818–6837. [DOI] [PMC free article] [PubMed] [Google Scholar]
- 16. Agostinelli S, Allison J, Amako K, et al. GEANT4 – A simulation toolkit. Nuclear Instruments Methods Phys A. 2003;506:250–303. [Google Scholar]
- 17. Allison J, Amako K, Apostolakis J, et al. Geant4 developments and applications. IEEE Trans Nucl Sci. 2006;53:270–278. [Google Scholar]
- 18. Testa M, Schümann J, Lu HM, et al. Experimental validation of the TOPAS Monte Carlo system for passively scattering proton therapy. Med Phys. 2013;40:1217–1219. [DOI] [PMC free article] [PubMed] [Google Scholar]
- 19. Lee C, Lodwick D, Hurtado J, Pafundi D, Williams JL, Bolch WE. The UF family of reference hybrid phantoms for computational radiation dosimetry. Phys Med Biol. 2010;55:339–363. [DOI] [PMC free article] [PubMed] [Google Scholar]
- 20. ICRP Publication 110 . Adult reference computational phantoms. 30(2), 2009. [DOI] [PubMed]
- 21. Plautz TE, Bashkirov VA, Giacometti V, et al. An evaluation of spatial resolution of a prototype proton CT scanner. Med Phys. 2017;43:6291. [DOI] [PMC free article] [PubMed] [Google Scholar]
- 22. Penfold SN, Schulte RW, Censor Y, Rosenfeld AB. Total variation superiorization schemes in proton computed tomography image reconstruction. Med Phys. 2010;37:5887–5895. [DOI] [PMC free article] [PubMed] [Google Scholar]
- 23. Seco J, Oumano M, Depauw N, Dias MF, Teixeira RP, Spadea MF. Characterizing the modulation transfer function (MTF) of proton/carbon radiography using Monte Carlo simulations. Med Phys. 2013;40:091717. [DOI] [PubMed] [Google Scholar]


