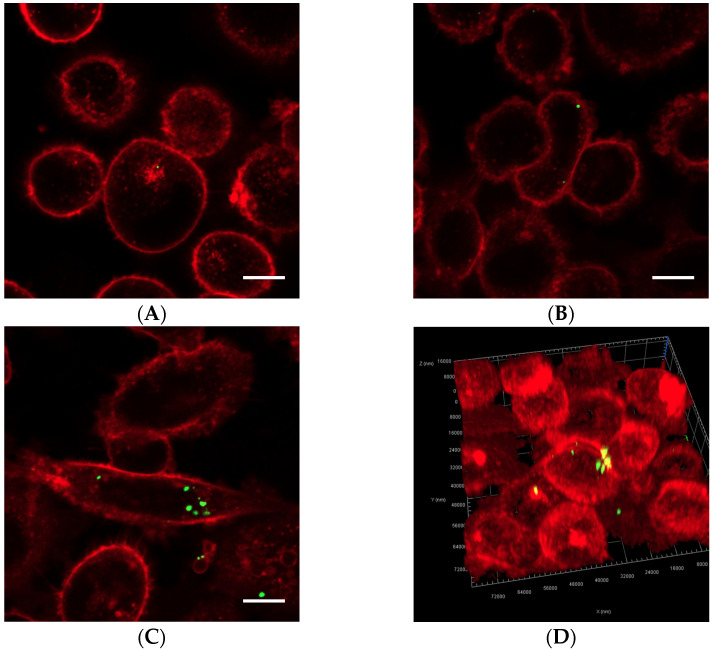
Figure 5.
Representative confocal images of cells displaying Cell Masks (red) and nanoparticles (green). In addition to the free nanoparticles, the cells were treated with (A) nanoparticle-loaded microbubbles but no ultrasound at 37 °C (control), (B) Sonazoid and ultrasound at 37 °C or (C) nanoparticle-loaded microbubbles and ultrasound at 37 °C. Both individual nanoparticles and groups of a few can be observed, as well as larger nanoparticle clusters in C. The scale bars are 10 µm. (D) 3D image of a cell where the nanoparticles inside the cell (green) and on the cell surface (yellow) are visualized.

