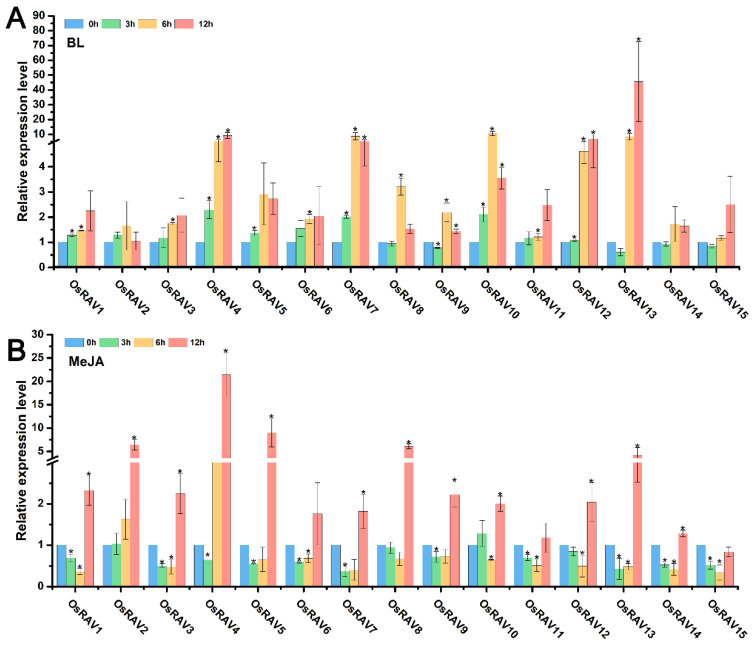
Figure 6.
Relative expression level of fifteen RAV genes following hormone treatments. Plants were treated with BL (10 μM) (A), MeJA (100 μM) (B) and sampled at 0, 3, 6, and 12 h. qPCR data were normalized using OsUBQ5. Results are the means ± standard deviation (SD) of three biological replicates. * indicates significant difference from the mock control at p ≤ 0.05 by Fisher’s least significant difference tests.

