Abstract
A recent remarkable study of the C–H oxidation of substituted fluorenyl-benzoates together with the transfer of a proton to an internal receiving group by means of electron transfer outer-sphere oxidants, in the noteworthy absence of hydrogen-bonding interactions, is taken as an example to uncover the existence of a mechanism crossover, making the reaction pass from a CPET pathway to a PTET pathway as the driving force of the global reaction decreases. This was also the occasion to stress that considerations based on “imbalanced” or “asynchronous” transition states cannot replace activation/driving force models based on the quantum mechanical treatment of both electrons and transferring protons.
Using the remarkable study of C–H oxidation of substituted fluorenyl-benzoates as an example, we have shown that a mechanism crossover takes place upon decreasing the driving force, from a CPET pathway to a PTET pathway.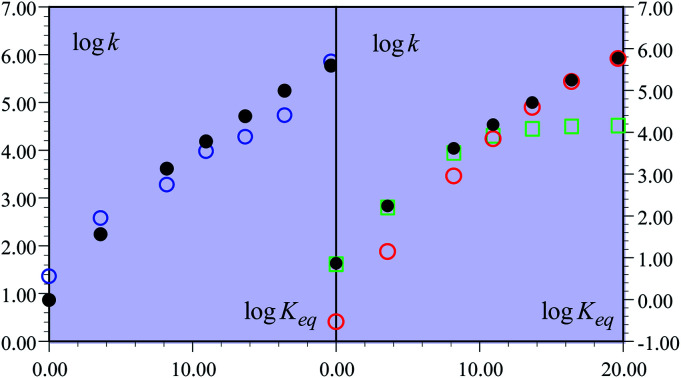
Introduction
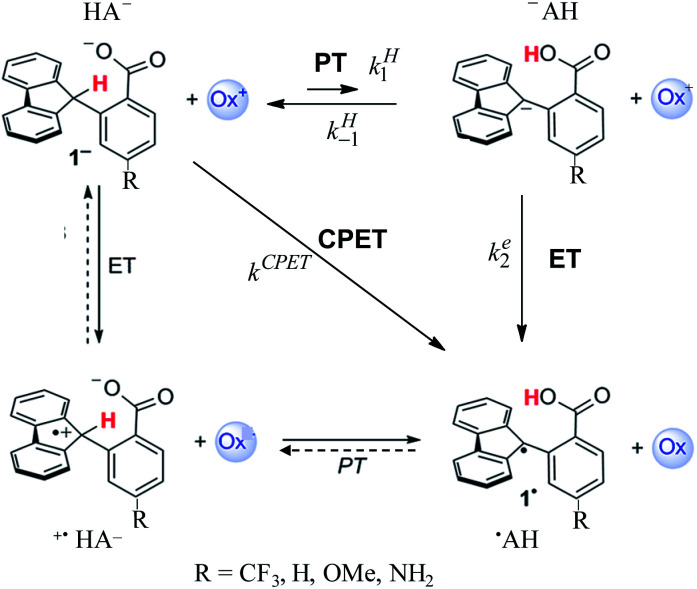
After a period of relative obscurity, the principle of imperfect synchronization (asynchronous or imbalanced transition states in hydrogen and proton exchange reactions) presently enjoys a marked renaissance,1–5 with or without specific mention of the historical development of this notion.6–8 In this context, the results reported in ref. 1b, concerning the system depicted in Scheme 1, are worth special attention. Not only is a large amount of carefully measured data provided, spanning a large variety of oxidants (ox+ in Scheme 1) but also several different substituents in the para-position of the benzoate moiety of the molecule. Even more important is the choice of these types of molecules for investigating the activation/driving force relationships in PCET reactions (as to the nomenclature, we use here the acronym PCET to designate coupled reactions with no indication of whether either ETPT or PTET stepwise mechanisms or a concerted pathway – noted CPET – are involved). With these types of molecules, the C–H bond is oxidized together with the transfer of a proton to an internal receiving group by means of electron transfer to an outer-sphere oxidant, “in the absence of classical hydrogen-bonding interactions”. The latter point is of paramount importance in the bookkeeping of various elements that may be used in the estimation of driving forces. Uncertainties at this level may indeed alter the comprehension of the otherwise interesting results, such as for example the PCET activation of ketones,2 which clearly warrants further investigations possibly helped by additional data that can be obtained from direct and mediated electrochemistry.
Scheme 1. PCET mechanisms.
In the following, we will first discuss the mechanism and kinetics of the system depicted in Scheme 1 and propose a reaction scheme (in bold in Scheme 1) that involves a mechanism crossover as the driving force of the system changes.
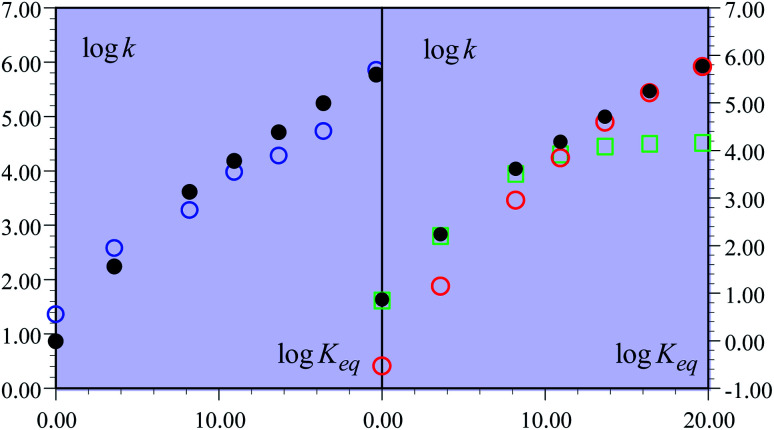
The experimental second order rate constant data are presented for a large series of oxidants encompassing cation radicals of triarylamines and several ferrocenium derivatives (see Table 1). They are displayed, in the case of the R = H substituent, as blue circles in Fig. 1 as a function of parameter log Keq, which is a measure of the driving force of the global reaction (from HA− to ˙AH in Scheme 1), ΔG0rxn (Keq = exp(−FΔG0rxn/RT), where ΔG0rxn is expressed in eV). Isotope effect data are provided for the same derivative, showing the appearance of a significant H/D kinetic isotope effect for values of log Keq above 10, corresponding to the triarylamine cation radical series.1a Rate data were also provided for the other substituents.
Kinetic and thermodynamic data.
| ox | log k exp(M−1 s−1) | ΔG0rxn (eV) | log Keq | E 0(V vs. FeCp+/02) | ΔG0ET (eV) |
|---|---|---|---|---|---|
| N(ArBr)3 | 7.2 × 10⁵ | −1.15 | 19.7 | 0.67 | −1.43 |
| N(ArOMe) (ArBr)2 | 5.4 × 10⁴ | −0.96 | 16.4 | 0.48 | −1.24 |
| N(ArOMe)2 (ArBr) | 1.9 × 10⁴ | −0.80 | 13.7 | 0.32 | −1.08 |
| N(ArOMe)3 | 9.5 × 10³ | −0.64 | 10.9 | 0.16 | −0.92 |
| FeCp2+ | 1.9 × 10³ | −0.48 | 8.2 | 0.00 | −0.76 |
| FeCp*Cp2+ | 3.8 × 10² | −0.21 | 3.6 | −0.27 | −0.49 |
| FeCp*2+ | 2.3 × 101 | 0.00 | 0.0 | −0.48 | −0.28 |
Fig. 1. Rate constants of the reaction of the non-substituted fluorenyl benzoate (Scheme 1, R = H) as a function of log Keq = −FΔG0rxn/RT ln 10. (left) Open blue circles: experimental data. Black dots: predicted rate constant of the global reaction. (right) Open red circles: predicted CPET rate constant. Open green squares: predicted PTET rate constant. Black dots: predicted rate constant of the global reaction.
One of the most striking features of these results, noted in this work, is that the rate versus driving force relationship upon changing the oxidant was found to be very shallow:1∂(log kexp)/∂(log Keq) = ∂ΔG≠rxn/∂ΔG0rxn = α ≈ 0.2.
This is indeed very surprising for a reaction that is conceived as a concerted pathway with driving forces spanning a large interval from −1.15 eV down to an isoergic situation (Table 1). Simple application of a Marcus-type relationship would predict a large variation of the transfer coefficient, α, along the driving force scale, possibly reaching such a small value only for the largest driving forces. More exactly, ref. 1b calls on an analogy with Savéant's theory of electron transfer concerted with bond cleavage.9 It should be emphasized that the observation of small α s in dissociative electron transfers is not a mysteriously specific apanage of such processes. It is simply the result of a quadratic activation/driving force relation (in this case too) associated with the necessity of having a large driving force to make the reaction proceed, in line with the bond dissociation energy being an (heavy) ingredient of the intrinsic barrier. The analogy between CPET C–H cleavages and the Savéant's theory of electron transfer concerted with bond cleavage is actually not quite appropriate, since H or H+ cannot be treated as heavy particles.10–12 In the following discussion, ref. 1b invokes the notion of the transition state imbalance, with reference to the classical literature on the subject. DFT calculations indeed indicate that the “electronic reorganization” of the fluorenyl moiety lags behind the transfer of a proton as measured by the C–H distance. However, the consideration of such transition state imbalance events cannot replace a description of the CPET reaction within a framework where both electrons and the transferring proton are treated quantum mechanically as will be discussed later on. Indeed, ref. 1b itself fairly points out that such transition state imbalance considerations do not explain the small value of α found experimentally. At the theoretical level, some improvement is obtained when excited proton vibrational states are taken into account,13 albeit still far from the experimental behavior (αcalc = 0.37 vs. αexp = 0.21).
We propose a different interpretation of the data, based on the idea that a change of the mechanism, from CPET to PTET, occurs upon decreasing the driving force of the global reaction. Mechanism crossover between stepwise and concerted electron transfer bond breaking reactions upon varying the driving force is a well-documented and rationalized question in the case where bond cleavage involves heavy atoms. It concerns the electrochemical and photochemical fields as well as homogeneous thermal processes.14 Even if much has been worked out about CPET reactions in the electrochemical context,15 the present competition between a stepwise and a CPET homogeneous pathway requires a different analysis as it will involve competition between intramolecular PT/bimolecular ET and bimolecular CPET. It has also to be borne in mind that the fact that a proton is transferred from a carbon atom introduces additional peculiarities.
In the present case, the ETPT pathway may be discarded on account of the fact that the cation radical ˙+AH is highly energetic.16 The CPET pathway is thus likely to predominate at large driving forces, as those offered by the triarylamine cation radicals. This is what is shown by the red open circles in Fig. 1b, which have been estimated according to the following procedure. The CPET reaction may be viewed as irreversible since the substrate HA− being in excess over ox+, and the maximal concentration of ˙AH formed is small. Then, application of a standard Marcus model leads to: where λCPET is the reorganization energy, ZCPET is the collision frequency and χ is the transmission factor involved in the non-adiabatic proton tunneling.17 The fitting in Fig. 1b was obtained for λCPET = 2.2 eV,18 and χZCPET = 108 M−1 s−1. The χZCPET value was obtained by fitting the experimental data with the strongest oxidants. It was not possible to get a reasonable fit of the whole set of experimental data with the only contribution of the CPET pathway. If we assume a bimolecular collision factor ZCPET = 2 × 10¹⁰ M−1 s−1, a value of χ as small as 5 × 10⁻³ falls in line with the slowness of carbon acid deprotonation as compared to oxygen and nitrogen acids.19
Switching to the PTET pathway, the standard free energy of the PT step may be derived from calculations in ref. 1b as ΔG0PT = 0.282 eV, which corresponds to an uphill equilibrium constant:20
The PTET contribution to the mechanism was discarded in ref. 1a based on two reasons: (i) a calculated equilibrium constant for the PT step being too small and (ii) the lack of H/D exchange in solutions of 1−–d1 with excess CH3OH. The refined calculated value of ΔG0PT in ref. 1b made argument (i) not valid anymore, at least for the weakest oxidants. As detailed in the ESI†, argument (ii) actually provides no compelling evidence against a possible interference of the PTET reaction pathway. We thus go on evaluating the PTET contribution to the global reaction.
As shown in the ESI,† the competition between the back proton transfer and the follow-up electron transfer is governed by the factor  , which is large in all cases, meaning that the PT step then acts as a pre-equilibrium preceding the electron transfer step and thus that:kPTET = KH1ke,eff2
The follow-up ET step has standard free energy:ΔG0ET = ΔG0rxn − ΔG0PT
Whose values are listed in the last column of Table 1. The standard application of the Marcus model thus leads to: and therefore to an effective rate constant:
Leading to the squares in Fig. 1b, taking for the electron transfer reorganization energy λe = 1 eV,21kdif = 1010 M−1 s−1 and Ze2 = 3 108 M−1 s−1. The last parameter, Ze2, was adjusted to fit the experimental data with the weakest oxidants. It is seen that the electron transfer is expected to be in the inverted region for the stronger oxidants in line with |ΔG0ET| > λe. Limitation by diffusion is not reached as kdif ≫ Ze2.
The overall constant is then simply obtained by addition of the CPET and PTET rate constants leading to the black dots in Fig. 1. In total, the agreement with the experimental data is quite satisfactory (Fig. 1a). It is clearly seen (Fig. 1b) that the CPET predominates at large driving forces (log Keq above 10). The mechanism crossover in favor of the PTET pathway takes place upon decreasing the driving force to reach the ferrocenium oxidant series.
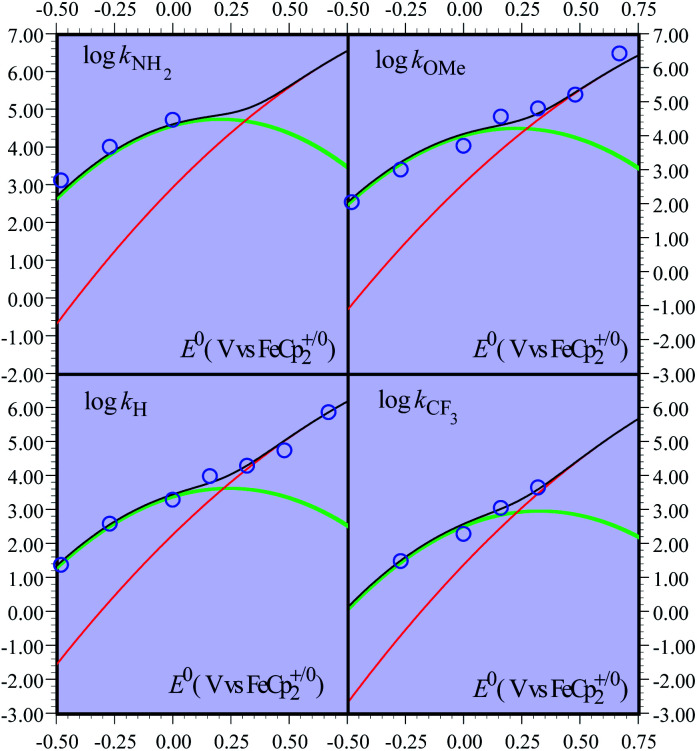
Although less detailed, the data obtained with the other fluorenyl substrates1b can be rationalized as shown in Fig. 2. We assume that the parameters λe,21λCPET,18kdif and the parameters Ze2 and χZCPET that have been estimated from the fitting of the activation/driving force relationship in the case of the unsubstituted substrates do not vary very much when passing to the substituted substrates.22 The most important variation concerns the value of the driving force of the PT step, expressed by ΔG0PT, to which corresponds a variation of the difference of pKa s pKCOOHa − pKCHa and hence, equivalently, of the equilibrium constant of the PT step, KH1. The fitting of the experimental data (Fig. 2) was carried out by varying one of these equivalent parameters (Table 2).
Fig. 2. Rate constants of the reaction of the non-substituted fluorenyl benzoate (Scheme 1, R = H) as a function of the standard potential of the oxidant. Open blue circles: experimental data. Curves: predicted rate constants: CPET (red), PTET (green), and global reaction (black).
Kinetic and thermodynamic data.
| Substituent | NH2 | OMe | H | CF3 | |
|---|---|---|---|---|---|
| ΔG0PT (eV) | 0.217 | 0.247 | 0.282 | 0.321 | |
| pKCOOHa − pKCHa | −3.7 | −4.23 | −4.82 | −5.49 | |
| K H 1 | 2.0 × 10⁻⁴ | 6.0 × 10⁻⁵ | 1.5 × 10⁻⁵ | 3.3 × 10⁻⁶ | |
| Hammett constants23 | Para | −0.66 | −0.268 | 0.00 | 0.54 |
| Meta | −0.16 | 0.115 | 0.00 | 0.43 | |
It appears that the pKa differences may be related to Hammett constants as shown in the last entry of Table 2, thus offering a rationale for the effect of substituents on the kinetics and mechanism crossover of the reaction.
Concluding this section, it clearly appears that the reaction undergoes a mechanism crossover and that the activation/driving force can be understood within this framework with a quite satisfactory adherence of the rate constants predicted by the model. This is not to say that the parameters that have been used are defined with much precision. They rather appear as reasonable approximate estimates.
“Imbalanced” transition states and CPET reactions
Continuing with the same example, the idea of asynchronism arises from the comparison, in the transition state, between electronic reorganization within the fluorenyl group on the one hand and the degree of proton transfer on the other. This information was provided by DFT calculations concerning the Flr(H)CO2−/˙+N(ArBr)3 pair of reactants, showing that electronic reorganization within the fluorenyl group (gauged by the pyramidalization of the fluorenyl carbon) lags far behind the transfer of the proton (gauged by the O–H distance). Let it be! This observation is however of dubious pertinence as far as activation/driving force relationships are looked for as discussed in the preceding section.
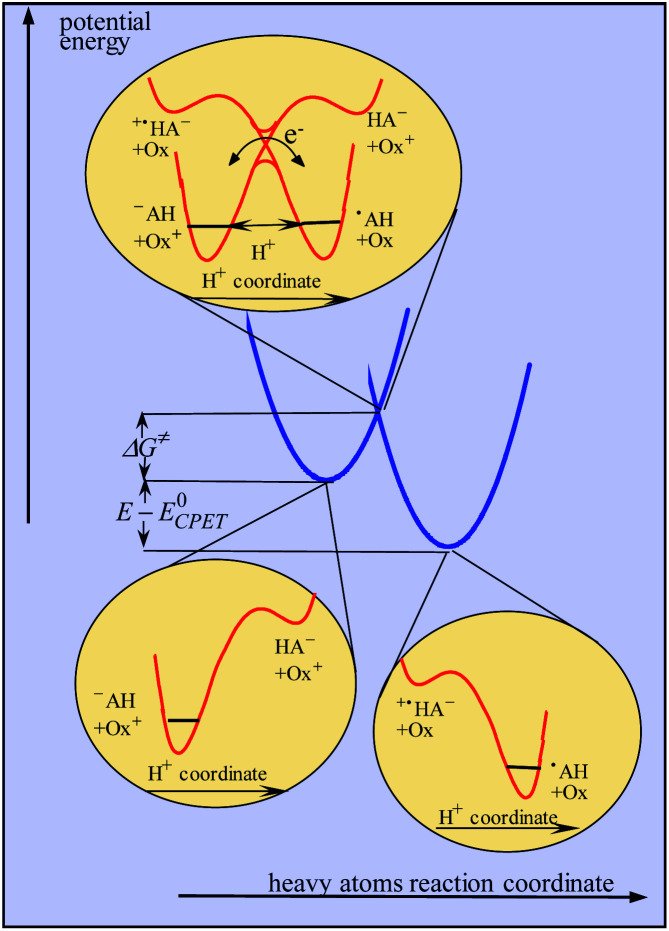
It should in fact be borne in mind that CPET reactions are endowed with a single transition state at which both protons and electrons are transferred. In a similar way to that reported in ref. 10, dealing with proton transfer, modeling of the kinetics in the present case should take into account categorization of the reacting particles into three subsets, heavy atoms, hydrogen atoms and electrons, the two latter being treated quantum mechanically, leading to the model schematized in Fig. 3. The transition state is located at the intersection of the potential energy surfaces involving the reorganization of the heavy-atom system (solvent and intramolecular reorganization), here schematically represented by two parabolas (blue curves in Fig. 3), thus defining the magnitude of the activation barrier, ΔG≠. In the transition state, electron transfer takes place via coupling of the two electronic states while the proton tunnels through the barrier represented by the red curves in the upper inset of Fig. 3. The transfer is considered to be in the double adiabatic limit, or double Born–Oppenheimer limit, meaning that (i) the transferring proton responds instantaneously to the reorganization of the heavy atom system and (ii) the electrons respond instantaneously to the transferring proton motion. However, as in the Marcus theory of electron transfer, electronic coupling is assumed to be small enough so that the magnitude of the activation barrier is given by the intersection of the electronic diabatic states leading to a quadratic relationship. Proton tunneling governs the magnitude of the pre-exponential factor. This may be expressed as the product of the reactants' collision frequency, ZCPET by a transmission factor, χ through which the H/D kinetic isotope effect may manifest itself. It is remarkable that χ is in the present case as small as 5 10−3. The smallness of this value is related to the fact that the reaction involves the cleavage of a carbon–hydrogen bond. The situation may thus be paralleled with the slowness of proton transfer from carbon acids as opposed to nitrogen or oxygen acids, which has been shown to result from the fact that carbon centers are more prone to form radicals than anions, unlike nitrogen or oxygen centers.18
Fig. 3. Modeling of CPET reactions in the framework of a double application of the Born–Oppenheimer approximation (see the text for details).
Conclusion
Using as example the remarkable study of C–H oxidation of substituted fluorenyl-benzoates, we have shown that a mechanism crossover takes place upon decreasing the driving force, from a CPET pathway to a PTET pathway. This was also the occasion to show that digressions based on imbalanced or asynchronous transition states cannot replace activation/driving force models based on the application of Born–Oppenheimer approximation as indicated some time ago.18
Conflicts of interest
There are no conflicts to declare.
Supplementary Material
Electronic supplementary information (ESI) available: Methanol addition test to 1−−d1. Kinetics of the PTET reaction pathway. See DOI: 10.1039/c9sc05147c
References
- (a) Markle T. F. Darcy J. W. Mayer J. M. Sci. Adv. 2018;4:eaat5776. doi: 10.1126/sciadv.aat5776. [DOI] [PMC free article] [PubMed] [Google Scholar]; (b) Darcy J. W. Kolmar S. S. Mayer J. M. J. Am. Chem. Soc. 2019;141:10777–10787. doi: 10.1021/jacs.9b04303. [DOI] [PMC free article] [PubMed] [Google Scholar]
- Qiu G. Knowles R. R. J. Am. Chem. Soc. 2019;141:2721–2730. doi: 10.1021/jacs.8b13451. [DOI] [PMC free article] [PubMed] [Google Scholar]
- Goetz M. K. Anderson J. S. J. Am. Chem. Soc. 2019;141:4051–4062. doi: 10.1021/jacs.8b13490. [DOI] [PubMed] [Google Scholar]
- Darcy J. W. Koronkiewicz B. Parada G. A. Mayer J. M. Acc. Chem. Res. 2018;51:2391–2399. doi: 10.1021/acs.accounts.8b00319. [DOI] [PMC free article] [PubMed] [Google Scholar]
- Bim D. Maldonado-Dominguez M. Rulisek L. Srnec M. Proc. Natl. Acad. Sci. U. S. A. 2018;115:E10287–E10294. doi: 10.1073/pnas.1806399115. [DOI] [PMC free article] [PubMed] [Google Scholar]
- Bernasconi C. F. Tetrahedron. 1985;41:3219–3234. doi: 10.1016/S0040-4020(01)96673-6. [DOI] [Google Scholar]
- Jencks W. P. Chem. Rev. 1985;85:511–527. doi: 10.1021/cr00070a001. [DOI] [Google Scholar]
- Bordwell F. G. Boyle W. J. J. Am. Chem. Soc. 1972;94:3907–3911. doi: 10.1021/ja00766a041. [DOI] [Google Scholar]
- (a) Savéant J. M. J. Am. Chem. Soc. 1987;109:6788–6795. doi: 10.1021/ja00256a037. [DOI] [Google Scholar]; (b) Savéant J.-M., Elements of molecular and biomolecular electrochemistry: an electrochemical approach to electron transfer chemistry, John Wiley & Sons, Hoboken, NJ, 2006, ch. 3 [Google Scholar]; (c) Costentin C. and Savéant J.-M., Elements of molecular and biomolecular electrochemistry: an electrochemical approach to electron transfer chemistry, John Wiley & Sons, Hoboken, NJ, 2nd edn, 2019, ch. 3 [Google Scholar]
- Borgis D. Hynes J. T. J. Phys. Chem. 1996;100:1118–1128. doi: 10.1021/jp9522324. [DOI] [Google Scholar]
- (a) Costentin C. Robert M. Savéant J.-M. Acc. Chem. Res. 2010;43:1019–1029. doi: 10.1021/ar9002812. [DOI] [PubMed] [Google Scholar]; (b) Costentin C. Robert M. Savéant J.-M. Tard C. Acc. Chem. Res. 2014;47:271–280. doi: 10.1021/ar4001444. [DOI] [PubMed] [Google Scholar]
- (a) Decornez H. Hammes-Schiffer S. J. Phys. Chem. A. 2000;104:9370–9384. doi: 10.1021/jp001967s. [DOI] [Google Scholar]; (b) Hammes-Schiffer S. Stuchebrukhov A. A. Chem. Rev. 2010;110:6939–6960. doi: 10.1021/cr1001436. [DOI] [PMC free article] [PubMed] [Google Scholar]
- Sayfutyarova E. R. Goldsmith Z. K. Hammes-Schiffer S. J. Am. Chem. Soc. 2018;140:15641–15645. doi: 10.1021/jacs.8b10461. [DOI] [PMC free article] [PubMed] [Google Scholar]
- See ref. 9b, Section 3.4.4, pp. 209–216
- See ref. 9b, ch. 4.
- (b).A value of the standard potential for AH oxidation can be roughly estimated from the peak potential of fluorene and triphenylmethane oxidation peak potential reported respectively at 0.9 and 1.2 V vs. Fc+/Fc16b. As a consequence, even with the stronger oxidant, +˙N(ArBr)3, an initial electron transfer would be uphill by at least 0.2 eV making unlikely a transfer coefficient of 0.2 for a rate determining ET. Alternatively a pre-equilibrium ET would lead to a transfer coefficient of 1.; Blum Z. Cedheim L. Eberson L. Acta Chem. Scand., Ser. B. 1977;31:662–666. doi: 10.3891/acta.chem.scand.31b-0662. [DOI] [Google Scholar]
- Costentin C. Robert M. Savéant J.-M. J. Am. Chem. Soc. 2007;129:9953–9963. doi: 10.1021/ja071150d. [DOI] [PubMed] [Google Scholar]
- The value of the reorganization energy for CPET was taken from ref. 13 with λCPET = λi + λS. λi is the internal reorganization (1.2 eV) and the solvent reorganization (1 eV).
- Costentin C. Savéant J.-M. J. Am. Chem. Soc. 2004;126:14787–14795. doi: 10.1021/ja046467h. [DOI] [PubMed] [Google Scholar]
- This value was computed using the B3LYP//def2-SVP DFT method and acetonitrile as the PCM solvent.1b A previously reported much higher value was computed using the (U)B3LYP/6-31+G(d) method and acetonitrile as the PCM solvent.1a Computation is expected to be more accurate with the def2-SVP basis set.
- The value of the reorganization energy was evaluated from the solvent reorganization energy calculated for CPET in ref. 13 (assuming that the contribution of the internal reorganization is negligible for electron transfer).
- (b).We note that rate constants have been calculated in ref. 22bvia a vibronically nonadiabatic PCET theory and ignoring the possible contribution of a stepwise PTET pathway. Besides changing the driving force, these calculations show that the main effect of introducing substituents is to change the preexponential factor through a change of the equilibrium proton donor–acceptor distance, thereby facilitating the sampling of shorter proton donor–acceptor distances. Nevertherless, we assume here that this effect is minor and that χ can be assumed to remain constant.; Sayfutyarova E. R. Lam Y.-C. Hammes-Schiffer S. J. Am. Chem. Soc. 2019;141:15183–15189. doi: 10.1021/jacs.9b06849. [DOI] [PMC free article] [PubMed] [Google Scholar]
- Leffler J. E. and Grunwald E., Rates and Equilibria of Organic Reactions, Wiley, 1963 [Google Scholar]
Associated Data
This section collects any data citations, data availability statements, or supplementary materials included in this article.


