Abstract
Despite the recent surge of interest in two-dimensional (2D) inorganic nanosheets derived from photoactive coordination polymers of lanthanide ions having interesting optical properties, research in this area is still in its infancy. Luminescent lanthanide ions, Eu(iii) or/and Tb(iii), as well as a bis-terpyridine ligand (L), were used in this study as the building blocks for the synthesis of the archetypical layered structure of coordination polymers (CPs) (L·Eu/L·Tb). 2D-nanosheets were obtained through exfoliation of the layered precursor of CPs in a suitable solvent system following a sonication-assisted strategy. These nanosheets exhibit lateral sizes on the micrometer scale (0.3–1 μm) and an ultrathin thickness of 2–6.5 nm. 1,1-Diamino-2,2-dinitroethene or FOX-7 is an insensitive high explosive; in a binder mixture, it exhibits a slightly superior detonation velocity of 8870 m s−1 in comparison to RDX. The insensitive nature of FOX-7 makes it a key component for the development of low vulnerable high explosive compositions for further application in weaponry. The growing demand for FOX-7, for use as a suitable replacement of conventional explosives, is of serious concern to human security. Achieving rapid and efficient detection of this unexplored explosive is a challenging task. In the present study, the developed luminescent nanosheets were used for the first time for micromolar level detection of FOX-7 both in solution and in the solid state. A visually distinct color change of the nanosheets from red (L·Eu) and green (L·Tb) to colorless was witnessed upon UV light irradiation during the detection process. Notably, the solid-state detection technique could be exploited for developing a commercial spray kit for quick onsite screening of this important explosive.
A new class of luminescent lanthanide 2D nanosheets for detection of FOX-7.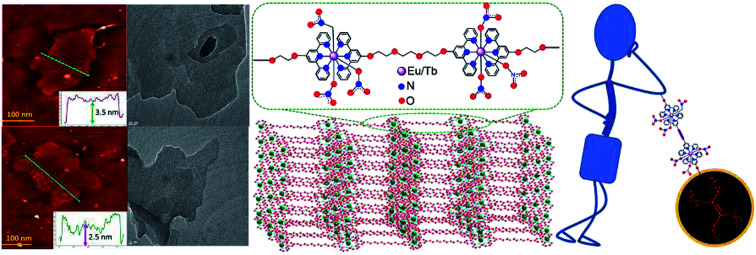
Introduction
Two-dimensional (2D)-nanomaterials have attracted substantial research interest in recent years, owing to their exclusive physical, chemical and optical properties arising from their ultrathin thickness and 2D morphology.1–8 Typically these materials possess sheet-like structures with a thickness less than 5 nm and lateral dimensions larger than 100 nm or up to a few micrometers.1 The success achieved with graphene and graphene oxide,2 metal oxides, hydroxides and sulfides,3,4 and transition metal dichalcogenides (TMDs)5 encouraged researchers to explore other types of 2D nanosheets. Very recently, coordination nanosheets featuring metal ions and organic ligands have witnessed flourishing development as a new member of the 2D family.9–13 These coordination nanosheets are generally obtained by adopting two strategies, i.e., top-down and bottom-up approaches.1 The former involves the mechanical or chemical exfoliation of bulk-layered materials, while the latter allows direct synthesis of 2D coordination nanosheets from their respective monomers. The top-down approach is the simplest and most common since the use of sonication or shaking is adequate to disintegrate the weak interlayer interaction in bulk materials to obtain nanosheets.1 Coordination nanosheets consisting of luminescent lanthanide ions are emerging due to their potential for application as electroluminescent materials for light-emitting diodes (LEDs), biomedical analysis, optical fibres for telecommunications, and sensors.14–17 Optical materials derived from Ln(iii) ions have an obvious edge over those derived from other metal ions owing to their sharp and well-defined emission bands, high quantum yield, long emission lifetimes, and lower sensitivity towards emission quenching through vibrational energy transfer to the surrounding ligand systems. Specifically, among the various complexes/coordination polymers derived from lanthanide ions, those derived from Eu(iii)/Tb(iii) are the most intense light emitters and such luminescence can be tuned by doping with a secondary lanthanide ion with retention of the framework structures.18 In this aspect, the design and the coordination behaviour of the ligands that act as the light-harvesting antenna for efficient sensitization of the Ln(iii)-based luminescence are crucial for determining the physicochemical and optical properties of lanthanide-based coordination polymers (CPs) or coordination nanosheets. Despite the enormous significance of developing smart optical materials, lanthanide coordination nanosheets have scarcely been investigated to date. The first report on lanthanide 2D-nanosheets by Maeda et al. reveals nanosheet formation of Eu(iii) or Tb(iii)-organophosphonate by exfoliation of layered compounds.15 Recently, Xia et al. reported metal–organic framework based lanthanide coordination nanosheets (MOF-Ln) as a two-color sensing platform for intracellular detection of DNA and small molecules.16 More recently, Mercuri et al. reported 2D-nanosheets of layered CPs using near-infrared-emitting lanthanide ions.14 2,2':6′,2′′-terpyridine based ligands have been utilized successfully as antenna groups for lanthanide sensitization,19,20,48,49 as well as for their spontaneity to form coordination bonds with Ln(iii) ions. The terpyridine moiety acted as an antenna by absorbing electromagnetic radiation upon irradiation and transferring this energy to the excited state 5D0 of Eu(iii) and 5D4 of Tb(iii) through energy transfer from the triplet excited state (T1) of the terpyridine by intersystem crossing (ISC) and subsequent deactivation (luminescence) to the 7FJ ground states.19,20,48,49 Furthermore, appropriate terpyridine derivatives have also been exploited to prepare coordination nanosheets.10,11,21
With the recent surge in the illegitimate use of certain explosives by various organized agencies, there is an urgent need for effective recognition and quantification of such explosives for efficient security screening, homeland security, and environmental protection.22,23 A reagent that allows detection of such crucial explosives through a visually detectable change(s) in colour or luminescence with short response time has an obvious edge for on-site detection. Such a reagent and the methodology are even more imperative if such a detection process for the explosives could be adopted for both solution and solid phases. In recent times, sincere efforts have been made to develop molecular sensors for efficient and specific detection of various nitroaromatics-based explosives.24–29 1,1-Diamino-2,2-dinitroethene (FOX-7) has been reckoned to be a high-energy-density material (HEDM) with a density of 1.878 g cm−3 and heat of formation of 133.7 kJ mol−1 and has comparable performance to 1,3,5-trinitroperhydro-1,3,5-triazine (RDX).30,31 The detection of such high energy content materials has become an emergent field for addressing the crucial issue of national security and safety. Despite its significance, there is no report in the contemporary literature on an appropriate reagent that allows efficient detection and quantification of FOX-7 and this defines the scope of developing an efficient sensor for FOX-7.
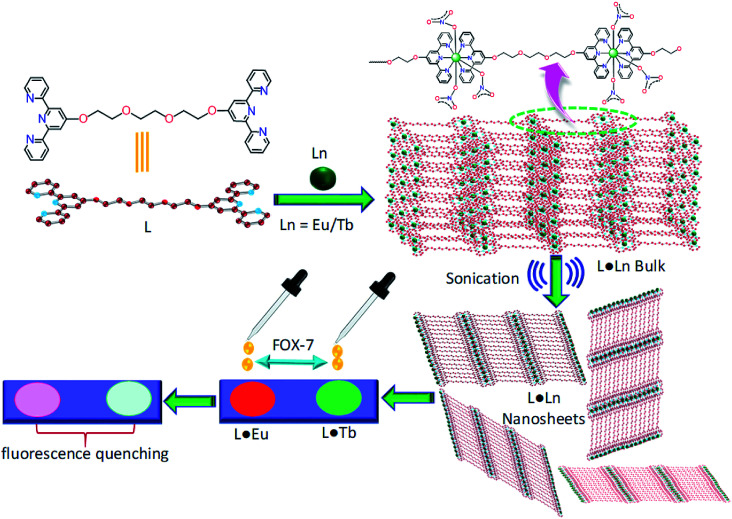
Herein, we describe the synthesis, characterization, and photophysical characteristics of 2D coordination nanosheets (L·Eu and L·Tb) using a bis(terpyridine) derivative (L) and Eu(iii) or Tb(iii) ions. The nanosheets were obtained through a top-down sonication assisted strategy using the corresponding CPs L·Eu and L·Tb, where these bulk layered materials cleaved into few-layered 2D nanosheets with a thickness of around 2–6.5 nm. The morphology of these 2D nanosheets was confirmed and characterized by field-emission scanning electron microscopy (FE-SEM), transmission electron microscopy (TEM) and atomic force microscopy (AFM) analysis. The luminescence of these nanosheets could be tuned over a wide spectrum by varying the stoichiometry of Eu(iii) and Tb(iii), while the [L] : [Ln] ([Ln] = [Eu] + [Tb]) ratio was fixed at 1 : 2. Interestingly, L·Eu and L·Tb nanosheets were utilized for recognition of FOX-7 through a fast and effective fluorescence quenching experiment (Scheme 1).
Scheme 1. A schematic illustration for the exfoliation of L·Eu and L·Tb 2D nanosheets from the corresponding precursor bulk layered material and subsequent detection of FOX-7.
Results and discussion
Synthesis and characterization of L·Eu and L·Tb coordination polymers and coordination nanosheets
The ligand 1,2-bis(2-([2,2':6′,2′′-terpyridin]-4′-yloxy)ethoxy)ethane (L) was prepared by reacting diethylene glycol with 4′-chloro-2,2′:6′,2′′-terpyridine following a previously reported procedure.32 The purity of the ligand was confirmed through standard analytical techniques. Lanthanide-based CPs L·Eu and L·Tb were synthesized from the reaction of bis-terpyridine derivative L and Ln(NO3)3·6H2O (Ln = Eu/Tb) in chloroform–tetrahydrofuran (1 : 1, v/v) solvent as depicted in Scheme 1. The bis-terpyridine ligand L was chosen owing to its linear directional effect, where a connection can be established through Ln(iii) coordination for achieving the expected 2D-coordination polymer-like structure. X-ray photoelectron spectroscopy (XPS) analysis, Fourier transform infrared (FTIR) spectra, powder X-ray diffraction (PXRD) patterns, UV-vis absorption and fluorescence spectral data confirmed the formation of L·Eu and L·Tb.
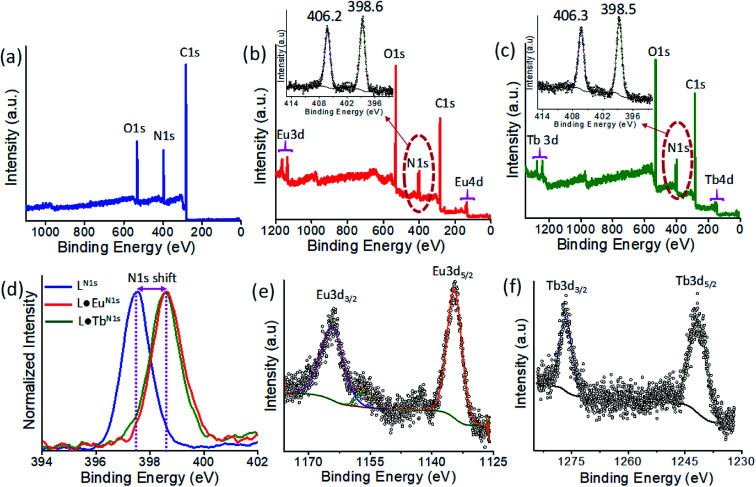
XPS analysis of L, L·Eu, and L·Tb was carried out to establish their chemical composition and the valence state of Eu and Tb in the CPs. The XPS survey spectrum of ligand L showed three peaks at binding energies of 284.1, 397.0 and 531.7 eV, which were attributed to C 1s, N 1s, and O 1s, respectively (Fig. 1a), while the survey spectra for L·Eu and L·Tb showed peaks at binding energies corresponding to C 1s, N 1s, O 1s, Eu 3d, Eu 4d, Tb 3d and Tb 4d (Fig. 1b and c). An additional peak at a binding energy of 406.2 eV and 406.3 eV, characteristic of N 1s of coordinated nitrate for L·Eu and L·Tb, respectively, was observed. These peaks were not observed for ligand L (inset of Fig. 1b and c).33 The high-resolution N 1s peak at a binding energy of 397.5 eV, corresponding to terpyridine nitrogen of L, was shifted to higher binding energies of 398.6 and 398.5 eV in L·Eu and L·Tb, while the C 1s and O 1s peak positions remained the same. This binding energy shift was attributed to the terpyridine nitrogen coordination with Eu and Tb in L·Eu and L·Tb, respectively.11 The high-resolution XPS spectrum of L·Eu displayed four peaks at binding energies of 135.8, 141.4, 1134.5 and 1164.2 eV, respectively, for Eu 4d5/2, Eu 4d3/2, Eu 3d5/2, and Eu 3d5/2 energy states. They confirmed the +3 oxidation state of Eu in L·Eu (Fig. 1e).34 Similarly, L·Tb also exhibited four peaks at 158.2 eV (Tb 4d5/2), 163.6 eV (Tb 4d3/2), 1241.6 eV (Tb 3d5/2) and 1276.5 eV (Tb 3d3/2), which confirmed the +3 state for Tb (Fig. 1f).
Fig. 1. (a–c) XPS survey spectra of L, L·Eu, and L·Tb, respectively. Insets: (b and c) high resolution XPS spectra collected in the N1s region for L·Eu and L·Tb, respectively. The binding energy peaks at 406.2 eV and 406.3 eV correspond to N 1s of coordinated nitrate for L·Eu and L·Tb, respectively. (d) Shifting of the N1s peaks of L·Eu and L·Tb compared to that of free ligand L. The peaks are standardized using the C 1s peak at 284.1 eV. (e and f) High resolution XPS spectra of L·Eu and L·Tb focusing on the Eu 3d and Tb 3d core levels.
The FTIR spectra of L·Eu revealed the characteristic vibrations of coordinated nitrate groups at 1486 cm−1 (ν1), 1282 cm−1 (ν4), 1068 cm−1 (ν2) and 814 cm−1 (ν3) and for L·Tb the coordinated nitrate group peaks are found at 1486 cm−1 (ν1), 1298 cm−1 (ν4), 1068 cm−1 (ν2) and 814 cm−1 (ν3) (Fig. S1a, ESI†). The PXRD patterns of L·Eu and L·Tb are presented in Fig. S1b, ESI.† The existence of domain peaks in L·Eu and L·Tb at 2θ = 24.91 and 23.70 with d-spacing values of 3.57 and 3.75 Å, respectively, was in agreement with the presence of intermolecular π⋯π stacking interactions in those CPs.35,36
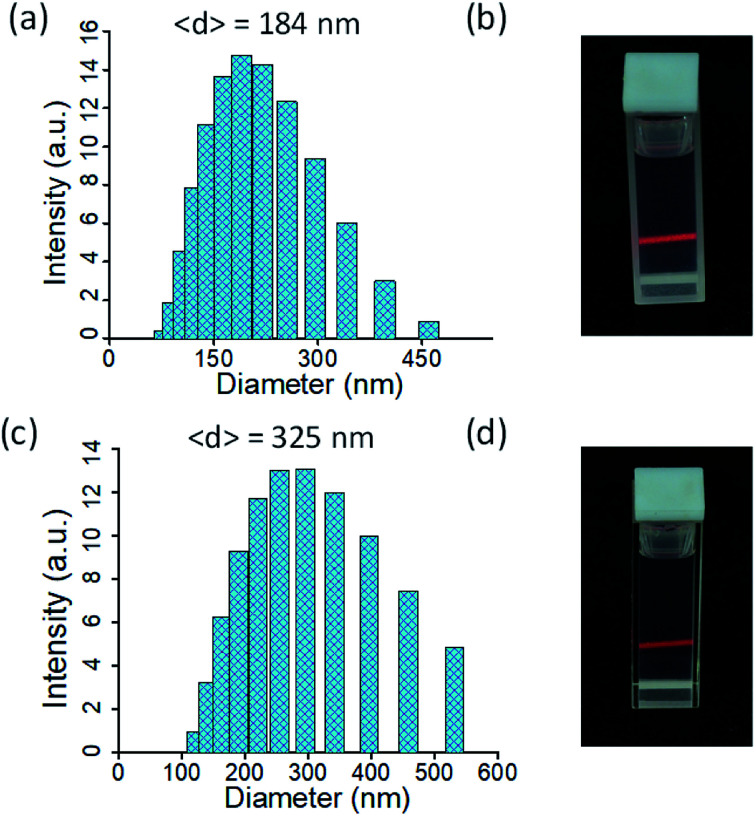
The L·Eu and L·Tb nanosheets were prepared by liquid exfoliation of their corresponding bulk powder through a top-down sonication assisted strategy, where the bulk layered materials cleaved into few-layered 2D nanosheets (Scheme 1). It was found that chloroform–tetrahydrofuran (1 : 1, v/v) and acetonitrile are ideal solvent systems for the exfoliation of L·Eu and L·Tb bulk powder among the wide range of solvents with different polarities that were tested. Dynamic light scattering (DLS) measurements revealed that the diameter of the L·Eu and L·Tb nanosheets was 184 and 325 nm, respectively, in the chloroform–tetrahydrofuran (1 : 1, v/v) solvent system (Fig. 2a and c). Furthermore, the stability of the colloidal ultrathin 2D nanosheets was visually confirmed by the clear Tyndall scattering of laser light (Fig. 2b and d).
Fig. 2. The size distribution from DLS measurements of dispersed nanosheets (a) L·Eu and (c) L·Tb in chloroform–tetrahydrofuran (1 : 1, v/v). Photograph of (b) L·Eu and (d) L·Tb nanosheets dispersed in chloroform–tetrahydrofuran (1 : 1, v/v) showing a strong Tyndall scattering.
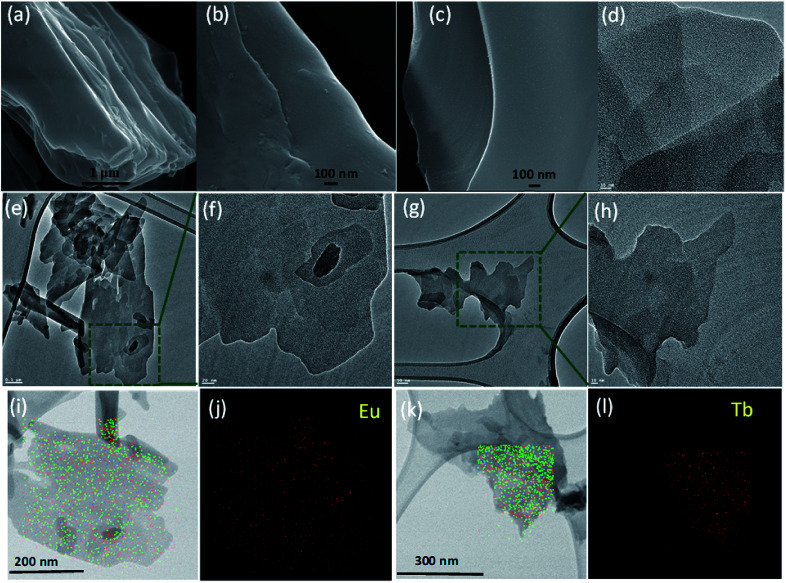
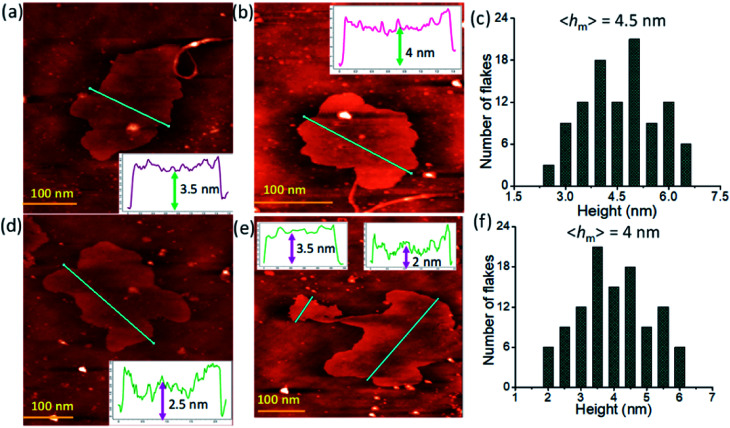
FE-SEM, TEM, and AFM analysis were performed to confirm the sheet-like morphology of the exfoliated few-layered 2D nanosheets that were obtained from the bulk layered materials of L·Eu and L·Tb in chloroform–tetrahydrofuran (1 : 1, v/v) dispersion through sonication (Fig. 3 and 4, and S2 and S3, ESI†). FE-SEM images of the L·Eu bulk material showed a multi-layer sheet-like morphology (Fig. 3a), while those of the exfoliated materials of L·Eu and L·Tb demonstrated a thin flat sheet-like morphology, which also indicated the 2D features of the sheets (Fig. 3b and c). For further clarification, TEM analysis of these exfoliated materials was performed on lacey-carbon supported copper grids. TEM images revealed the existence of thin free-standing 2D nanosheets on the lacey-carbon support without any rupturing, which was indicative of the substantial mechanical stability that was associated with these nanosheets (Fig. 3e and g).37 Statistical analysis of TEM images showed that the average diameter of L·Eu and L·Tb nanosheets was around 193 and 255 nm, respectively, in good accordance with the DLS data as described previously (Fig. S4, ESI†). Fig. 3e and g, and S2 (ESI†) exhibit sheets of L·Eu and L·Tb with lateral sizes of ∼1 μm length. Energy dispersive X-ray spectroscopy (EDXS) analysis along with TEM confirmed the presence of C, N, O, and Eu/Tb in the L·Eu and L·Tb nanosheets (Fig. S3, ESI†). Moreover, the elemental mapping of L·Eu and L·Tb nanosheets revealed a uniform distribution of Eu(iii) or Tb(iii) ions along with other elements throughout the respective nanosheet (Fig. 3i–l). The thickness of the L·Eu and L·Tb nanosheets was further established by AFM investigations by transferring the exfoliated sheets in chloroform–tetrahydrofuran (1 : 1, v/v) solution onto a silicon wafer. The thickness of the randomly distributed nanosheets was in the range of 2–6.5 nm and this was evident from the corresponding height-profiles and statistical analysis plots (Fig. 4 and S4, ESI†). The statistical study of the layer thickness of L·Eu and L·Tb nanosheets predicted a mean average height (hm) of about 4.5 nm and 4 nm, respectively. FE-SEM, TEM, and AFM results indicated that the top-down sonication assisted strategy was effective in providing exfoliation of bulk layered materials down to few-layered 2D nanosheets.
Fig. 3. (a) FE-SEM images of L·Eu in the bulk state. (b and c) FE-SEM images of exfoliated L·Eu and L·Tb nanosheets deposited on a silicon wafer substrate. (d–f) TEM images of the thin free-standing L·Eu 2D nanosheets on lacey-carbon supported copper TEM grids (the scale bar is 10 nm, 0.1 μm and 20 nm, respectively). Zoomed-in view of the marked box region of L·Eu 2D nanosheets. (g and h) TEM images of the L·Tb 2D nanosheets (the scale bar is 10 nm). (i–l) TEM images of L·Eu and L·Tb nanosheets where elemental mapping was performed. Green, blue and red dots represent carbon, nitrogen, and lanthanide (Eu or Tb) atoms. (j and l) Elemental mapping images of Eu(iii) and Tb(iii) showing a uniform distribution throughout the sheet.
Fig. 4. AFM topography (height) scanning images of randomly distributed nanosheets of (a and b) L·Eu and (d and e) L·Tb deposited on a silicon wafer. Inset: height profiles of nanosheets of L·Eu and L·Tb extracted along the lines drawn in panels (a), (b), (d) and (e). (c and f) The statistical height distribution of L·Eu and L·Tb nanosheets based on AFM investigations.
Photophysical studies
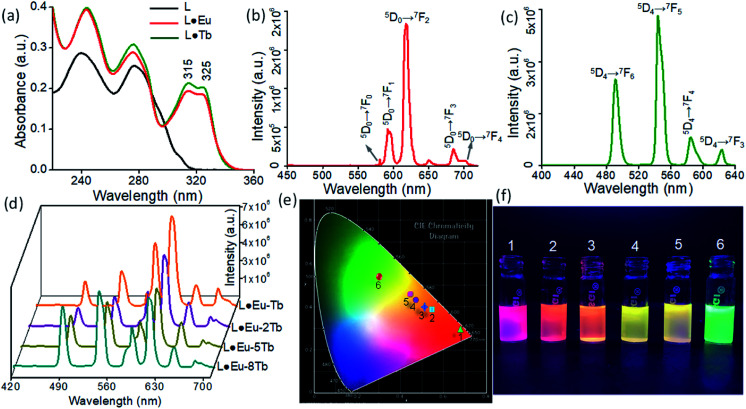
The photophysical properties of the free ligand L and the CPs L·Eu and L·Tb as bulk materials and nanosheets were thoroughly examined using UV-vis absorption and fluorescence spectra (Fig. 5). The UV-vis absorption spectrum of L in acetonitrile (MeCN) solution (1.0 × 10⁻⁵ M) has two main peaks centered at 240 nm and 277 nm, which were attributed to the terpyridine-based π → π* and n → π* transitions, respectively (Fig. 5a). The UV-vis spectra recorded for L·Eu and L·Tb nanosheet dispersions (2 mg/2 mL in MeCN) show a new peak with two shoulders at 315 and 325 nm, respectively, while the respective λmax at 240 nm and 277 nm remained unchanged. The emergence of this new peak at longer wavelength signifies the coordination of the terpyridine units of L with Eu(iii) and Tb(iii). The solid-state UV-vis spectra of the bulk material of L·Eu and L·Tb display a broad band maximum at 330 nm (Fig. S5a†). The photoluminescence spectra of ligand L (1.0 × 10⁻⁵ M in MeCN) upon excitation at 325 nm display emission band maxima at 401 and 424 nm (Fig. S5b†). The emission spectrum (λex = 325 nm) of the L·Eu nanosheet dispersion (Commission Internationale de L'Eclairage (CIE) coordinates: 0.69, 0.28) exhibits sharp emission bands for Eu(iii) at 581, 592, 618, 685, and 701 nm, which were attributed to 5D0 → 7FJ (J = 0–4) based transitions (Fig. 5b). Likewise, the L·Tb nanosheet dispersion (CIE coordinates: 0.31, 0.53) shows sharp bands for Tb(iii) at 491, 544, 585 and 623 nm due to 5D4 → 7FJ (J = 6–3) based transitions (λex = 325 nm) (Fig. 5c). Similarly, in the solid state for L·Eu and L·Tb bulk materials, all the 5D0 → 7FJ (J = 0–4) based transitions (581, 596, 620, 688, and 700 nm) for Eu(iii) and 5D4 → 7FJ (J = 6–3) based transitions (492, 546, 587 and 623 nm) for Tb(iii) were observed (Fig. S6a and b, ESI†).
Fig. 5. (a) UV-Vis spectra of ligand L (1.0 × 10⁻⁵ M in MeCN), and L·Eu and L·Tb nanosheet dispersions (2 mg/2 mL in MeCN). (b and c) Fluorescence emission spectra of L·Eu and L·Tb nanosheet dispersions in MeCN (2 mg/2 mL, λex = 325 nm). (d) Fluorescence emission spectra of L·Eu-Tb, L·Eu-2Tb, L·Eu-5Tb and L·Eu-8Tb nanosheet dispersions (2 mg/2 mL, λex = 325 nm) in MeCN. (e) CIE chromaticity diagram of L·Eu (1), L·Eu-Tb (2), L·Eu-2Tb (3), L·Eu-5Tb (4), L·Eu-8Tb (5), and L·Tb (6) nanosheets. (f) Photographs of the corresponding nanosheet dispersions in MeCN (2 mg/2 mL) under UV light irradiation (λex = 352 nm).
The corresponding L·Eu and L·Tb nanosheets drop-cast on a glass slide surface exhibited sharp emission bands for Eu(iii) at 579, 592, 617, 684, and 698 nm (CIE coordinates: 0.60, 0.28) and for Tb(iii) at 490, 542, 584 and 621 nm (CIE coordinates: 0.30, 0.54) (λex = 325 nm) (Fig. S6c and d, ESI†). This sensitized emissions, which are also known as the ‘antenna effect’, were a direct consequence of the binding of Eu(iii) or Tb(iii) to the bis-terpyridine ligand (L). The bis-terpyridine moiety upon irradiation with a suitable wavelength populated the excited state 5D0 of Eu(iii) and 5D4 of Tb(iii) through energy transfer from the T1 state of the ligand and subsequently, deactivation to the 7FJ ground state responsible for the observed emission response.19 The dispersed or drop-cast nanosheets of L·Eu and L·Tb displayed bright red and green fluorescence, respectively, under UV light irradiation at 352 nm (Fig. 5f). The observed emission colors of L·Eu and L·Tb nanosheets are differentiable in the CIE chromaticity diagram. The emission properties of these CPs and the corresponding nanosheets can be tuned by mixing both Eu(iii) and Tb(iii) with ligand L in different stoichiometries considering that L·Eu and L·Tb are isostructural and their emissions consist of three primary colours: red, green and blue. However, in all such CPs and coordination nanosheets, the [L] : [Ln] ([Ln] = [Eu] + [Tb]) ratio was fixed at 1 : 2. The CPs L·Eu-Tb, L·Eu-2Tb, L·Eu-5Tb, and L·Eu-8Tb were obtained by mixing Eu(iii) and Tb(iii) in 1 : 1, 1 : 2, 1 : 5 and 1 : 8 ratios and the corresponding nanosheets were obtained following the top-down sonication assisted strategy as described previously. The L·Eu-Tb and L·Eu-2Tb nanosheets exhibited orange color (CIE coordinates: 0.54, 0.39 and 0.52, 0.40) emissions, while the other two, L·Eu-5Tb and L·Eu-8Tb, exhibited yellow color emissions (CIE coordinates: 0.47, 0.44 and 0.46, 0.46).
Chemical sensing of 1,1-diamino-2,2-dinitroethene (FOX-7)
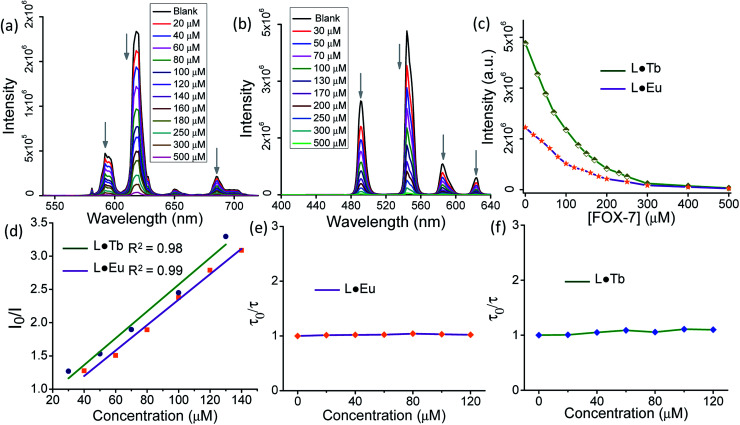
L·Eu and L·Tb nanosheet suspensions were screened to gain insights into their detection scope for 1,1-diamino-2,2-dinitroethene (FOX-7), an unsaturated nitro explosive with comparable performance to 1,3,5-trinitroperhydro-1,3,5-triazine (RDX). To check this possibility, the luminescence of the L·Eu and L·Tb nanosheet dispersions in MeCN was recorded on subsequent addition of a solution of FOX-7. A gradual decrease in emission intensity of the 5D0 → 7FJ (J = 0–4) based transitions for Eu(iii) and 5D4 → 7FJ (J = 6–3) based transitions for Tb(iii) was observed with an increase in the concentration of FOX-7 (Fig. 6a and b). The luminescence intensities of the most prominent Eu(iii) centered peak at 618 nm (5D0 → 7F2) and Tb(iii) centered peak at 544 nm (5D4 → 7F5) decreased 58% and 59%, respectively, after addition of 100 μM FOX-7 and were completely quenched at 400 μM FOX-7 (Fig. 6c). The Stern–Volmer (S–V) equation was used to assess the fluorescence quenching process quantitatively. The S–V plots exhibited a linear increase in the low concentration range of FOX-7 (0–140 μM for L·Eu and 0–130 μM for L·Tb nanosheets) (Fig. 6d), while it showed an upward curvature at a higher concentration up to 400 μM (Fig. S7, ESI†).
Fig. 6. (a and b) Fluorescence spectra of L·Eu and L·Tb nanosheets dispersed in MeCN (2 mg/2 mL) in the presence of an incremental concentration of FOX-7 (λex = 325 nm). Each solid color line represents the fluorescence spectral nature of L·Eu and L·Tb nanosheets in the presence of the respective concentration of FOX-7. (c) Corresponding plot of variation of fluorescence intensities of L·Eu and L·Tb nanosheets upon the addition of FOX-7 with varying concentration. (d) Linear dependence between the quenching efficiency of L·Eu and L·Tb and the concentration of FOX-7 in the lower concentration range. (e and f) A plot of τ0/τ as a function of [FOX-7] in the low concentration range of FOX-7 (0–120 μM) obtained by monitoring the emission decays at 618 nm and 544 nm for L·Eu and L·Tb, respectively.
To assess the process (static/dynamic/a combination of both) associated with the luminescence quenching process,38–41 time-resolved emission studies were performed by monitoring the emission decays at 618 nm and 544 nm for L·Eu and L·Tb, respectively, in the low concentration range of FOX-7 (0–120 μM) (Table S1 and S2, ESI†). The emission lifetime of L·Eu and L·Tb dispersions (2 mg/2 mL) in MeCN was found to be 0.66 ms and 1.22 ms, respectively. The decay profiles exhibited an insignificant alteration of lifetime values (τ) when recorded in the presence of varying concentration of FOX-7 and this confirmed the dominance of the static quenching process (Fig. 6e and f, and S8, ESI†).38 The static quenching constant (KSV) values determined from the initial linear fitting of the S–V plots were found to be 1.91 × 10⁴ M−1 and 2.01 × 10⁴ M−1 for L·Eu and L·Tb dispersions, respectively. The limit of detection (LOD) of FOX-7 was found to be 17 nM and 22 nM for L·Eu and L·Tb dispersions using the equation LOD = 3σ/m as defined by IUPAC, where σ is the standard deviation for eight successive fluorescence measurements of blank nanosheet dispersions, and m indicates the slope of the initial linear region of the fluorescence intensity of L·Eu and L·Tb dispersions versus concentration of FOX-7 (Fig. S9, ESI†).26,28 Here, the observed fluorescence quenching was due to photoinduced electron transfer (PET) from the electron-rich coordination nanosheets to the electron-deficient FOX-7.42,43
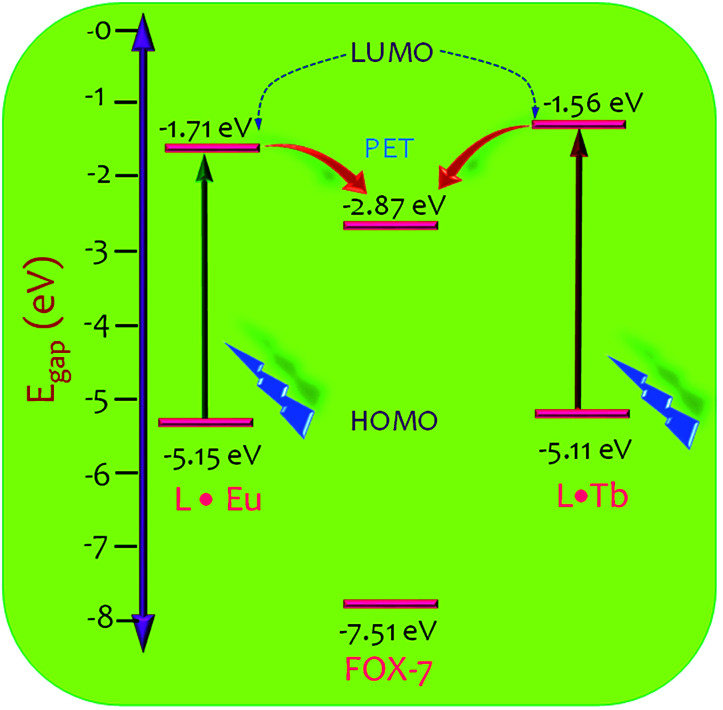
To assess the feasibility of the electron transfer process, we calculated the relative energies for the highest occupied molecular orbital (HOMO) and the lowest unoccupied molecular orbital (LUMO) for L·Eu and L·Tb dispersions, and FOX-7. The relative energies for the HOMO and LUMO of FOX-7 were taken from the literature, while those for L·Eu and L·Tb were evaluated by measuring the differential pulse voltammetry (DPV), absorption, and emission spectra (Fig. S10, ESI†).45 As indicated in Fig. 7, the electron-rich coordination nanosheets have higher LUMO energy as compared to that for FOX-7, which suggests thermodynamic feasibility for a transfer of electrons from the donor coordination nanosheets to acceptor FOX-7 and a plausible pathway for the observed luminescence quenching. A similar type of fluorescence quenching effect of MOFs has been explained by a donor–acceptor electron transfer mechanism.24,28,44 The energy gap between L·EuLUMO (−1.71 eV) and FOX-7LUMO (−2.87 eV) was found to be 1.16 eV, while this energy gap for L·Tb (−1.56 eV) and FOX-7 (−2.87 eV) was found to be 1.31 eV. A lower LUMO energy gap for L·Eu presumably accounted for the lower limit of detection. Hence, appropriate design of the ligand of the coordination polymer could further help in lowering the LUMO energy gap further for achieving a lower detection limit.
Fig. 7. HOMO–LUMO energy gaps of L·Eu, L·Tb, and FOX-7 and a possible photoinduced electron transfer (PET) pathway.
Subsequently, to further examine the detection scope of these nanosheets, we selected a couple of nitroaromatic explosives such as trinitrotoluene (TNT) and 2,4,6-trinitrophenol (TNP), and aliphatic explosives such as 1,3,5,7-tetranitro-1,3,5,7-tetrazoctane (HMX) and hexanitrohexaazaisowurtzitane (CL-20). TNT and TNP also exhibited a good response to the emission quenching of L·Eu and L·Tb nanosheets. The luminescence intensities of the most prominent Eu(iii) centred peak at 618 nm (5D0 → 7F2) and Tb(iii) centred peak at 544 nm (5D4 → 7F5) were found to be quenched by 69% and 56%, respectively, following the addition of 5 μM TNP (Fig. S11a and b, ESI†). Similarly, the luminescence intensity of Eu(iii) at 618 nm was quenched by 50.2%, while that for Tb(iii) at 544 nm was quenched by 60% following addition of 100 μM TNT (Fig. S11c and d, ESI†). Similar titration experiments of HMX and CL-20 exhibited no significant quenching behaviour of Eu(iii) and Tb(iii) based emissions in L·Eu and L·Tb, even when the concentration of explosives was increased to 400 μM (Fig. S12, ESI†). These results confirmed the efficacy of the luminescence quenching process for detection of FOX-7, TNT, and TNP with a distinct preference for FOX-7.
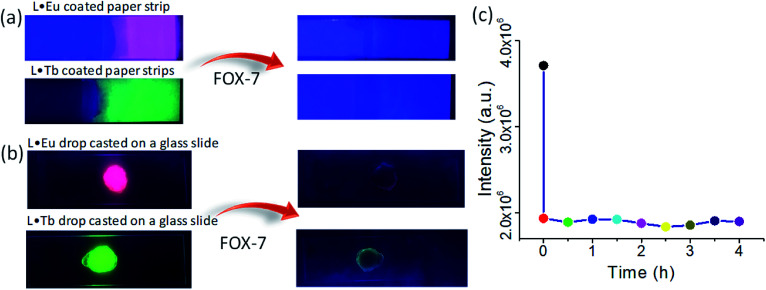
To investigate the response kinetics, we examined the fluorescence intensity of the L·Tb dispersion after incubation with FOX-7 for different time intervals. The fluorescence intensity of the L·Tb dispersion was quenched immediately after addition of 100 μM FOX-7, while the fluorescence intensity remained almost unaffected even after the incubation time was prolonged to 4 h (Fig. 8c).
Fig. 8. (a) Visual color change of L·Eu and L·Tb coated paper strips upon addition of FOX-7 under UV light irradiation (λex = 352 nm). (b) Visual color change of L·Eu and L·Tb nanosheets drop-cast on a glass slide upon addition of FOX-7 under UV light irradiation (λex = 352 nm). (c) The plot of emission intensity of the L·Tb nanosheet dispersion in MeCN (2 mg/2 mL) in the presence of FOX-7 (100 μM) with varying the incubation time.
We also studied the practical application of L·Eu and L·Tb nanosheets for the facile detection of FOX-7 by preparing nanosheet coated paper strips. The test paper strips were prepared by dipping Whatman filter paper strips into the L·Eu and L·Tb nanosheet suspensions, followed by drying in air. The L·Eu and L·Tb coated paper strips exhibited red and green fluorescence, respectively, upon exposure to UV light irradiation at 352 nm (Fig. 8a). The prepared paper strips were then treated with FOX-7 (10−2 M) and a substantial fluorescence quenching was observed on the treated part as shown in Fig. 8a. The results manifested a quick and convenient method to recognize FOX-7 with the naked eye under UV light. Furthermore, the nanosheet dispersion (2 mg/2 mL) was drop-cast into the glass slide and a thin film was formed on the glass-slide surface. L·Eu and L·Tb nanosheet thin films displayed bright red and green fluorescence, respectively, under UV light irradiation (Fig. 8b). On addition of a few drops of FOX-7 (10−2 M) on the glass-slide surface containing the L·Eu and L·Tb nanosheet films, significant fluorescence quenching was observed on the treated part as displayed in Fig. 8b. The TEM images revealed that L·Eu and L·Tb nanosheets retained their sheet-like morphology after the treatment with FOX-7 (Fig. S13, ESI†).
Overall, these results indicated that L·Eu and L·Tb nanosheets could be considered as a rapid and stable fluorescence sensor for analysis of explosives. To the best of our knowledge, this is the first example of a sensor that allows efficient detection and quantification of FOX-7 by using an optical response.
Conclusion
In summary, we have introduced a new class of luminescent lanthanide 2D nanomaterials for fluorescence-based chemical detection of FOX-7. Sonication-assisted exfoliation of the corresponding CPs in a suitable solvent yielded ultrathin sheets with lateral dimensions in the micrometer scale (0.3–1 μm) and a thickness of around 2–6.5 nm. Photophysical studies in solid and dispersed nanosheets confirmed that the terpyridine ligand worked as an efficient antenna in sensitizing the Ln(iii) emission. The emission properties of the nanosheets were tuned by mixing both Eu(iii) and Tb(iii) with ligand L in different stoichiometries to obtain red, orange, yellow and green color emissions. These nanosheets were employed to recognize an insensitive high energy content explosive compound FOX-7 through a fast and effective fluorescence quenching experiment in solution and in the solid state through a distinct colour change under UV light. To the best of our knowledge, this is the first report that established a sensing platform for the detection of FOX-7 using lanthanide nanosheets. Our investigation has thus unlocked a new path toward the rational design of lanthanide 2D nanosheets and revealed their promising applications in recognition of explosives.
Experimental section
Materials
All chemicals and solvents used for synthesis were purchased from commercial sources and were used as received without further purification. For spectroscopic measurements, HPLC grade solvents were used. All procedures were performed under ambient conditions unless otherwise stated.
Caution! FOX-7, TNT, TNP, HMX, and CL-20 compounds have highly explosive characters. They should be used with the best safety protection and extreme care. Only small quantities (in the μM range) can be handled in the testing process.
Procedure for the synthesis of 1,2-bis(2-([2,2':6′,2′′-terpyridin]-4′-yloxy)ethoxy)ethane (L)
Ligand L was prepared following a previously reported procedure.32 840 mg (15 mmol) KOH was dispersed in diethylene glycol (225 mg, 1.5 mmol) and the reaction mixture was heated in 6 mL dry dimethyl sulfoxide (DMSO) for 1 h at 60 °C in a nitrogen atmosphere. Next, 4′-chloro-2,2′:6′,2′′-terpyridine (883 mg, 3.3 mmol) was added to the reaction mixture and heating was continued for 48 h. After that, the reaction mixture was cooled to room temperature and the crude product was precipitated by addition of excess water. Finally, a white solid product was collected after repeated washing with water. Yield: 780 mg, 84.96%. 1H NMR (600 MHz, CDCl3, δ): 8.66 (d, J = 3.7 Hz, 4H), 8.58 (d, J = 7.9 Hz, 4H), 8.03 (s, 4H), 7.82 (t, J = 7.5 Hz, 4H), 7.32–7.23 (m, 4H), 4.39 (s, 4H), 3.94 (s, 4H), 3.79 (s, 4H). HRMS (ESI) m/z: [M + H]+ calcd for C36H32N6O4, 613.2565; found, 613.2558.
Selected FT-IR bands (KBr, cm−1; s = strong, vs = very strong, m = medium, br = broad): 1601 (s), 1584 (vs), 1564 (vs), 1469 (s), 1446 (s), 1405 (vs), 1347 (m), 1312 (m), 1207 (s), 1140 (s), 1060 (s), 987 (m), 921 (m), 796 (s) and 621 (m).
Synthesis of L·Eu and L·Tb coordination polymers
The ligand was dissolved in CHCl3 (49.02 mg, 0.08 mmol) and to it, Tb(NO3)3·6H2O (72.48 mg, 0.16 mmol) or Eu(NO3)3·6H2O (71.37 mg, 0.16 mmol) dissolved in THF was added dropwise and stirred for 3 h. Next, the reaction mixture was filtered in a Gooch crucible and the obtained white solid was washed thoroughly with EtOH and finally dried in a desiccator to obtain the desired coordination polymers.
L·Eu: selected FT-IR bands (KBr, cm−1; s = strong, vs = very strong, m = medium): 1615 (vs), 1573 (s), 1561 (s), 1486 (s), 1404 (vs), 1315 (s), 1282 (s), 1229 (m), 1163 (m), 1068 (m), 1011 (m), 815 (m) and 794 (m).
L·Tb: selected FT-IR bands (KBr, cm−1; s = strong, vs = very strong, m = medium): 1614 (vs), 1575 (s), 1559 (s), 1486 (s), 1404 (vs), 1315 (s), 1298 (s), 1229 (m), 1163 (m), 1068 (m), 1011 (m), 815 (m) and 795 (m).
Preparation of L·Eu and L·Tb nanosheets
L·Eu and L·Tb nanosheets were prepared from the corresponding coordination polymers by ultrasonic exfoliation in organic solvents. 1 mg of the L·Eu and L·Tb bulk powder material was suspended in 3 mL of solvent (chloroform–tetrahydrofuran (1 : 1, v/v) and acetonitrile), and was sonicated for 30 min to give a homogeneous dispersion. The resulting dispersion was centrifuged and the supernatant was collected.
Instruments
1H NMR (500 MHz) spectra for the prepared ligand L were collected on a Bruker AX 500 spectrometer (500 MHz) and calibrated with respect to the internal standard tetramethylsilane (TMS). Chemical shifts were quantified in ppm with CDCl3 solvent as the internal reference. FT-IR spectra (4000–400 cm−1) of the materials were recorded with a PerkinElmer 883 spectrometer using the KBr pellet technique. High-resolution mass spectra (HRMS) were recorded on an Agilent 6545 Q-TOF LC/MS. Ultraviolet/visible absorption spectra were recorded in 1 cm quartz cuvettes using a Shimadzu UV-2600 spectrophotometer. Fluorescence spectra were recorded at room temperature using a PTI QuantaMaster 400 spectrofluorometer. Powder X-ray diffraction (PXRD) patterns were recorded at room temperature on a Philips X'pert X-ray powder diffractometer using Cu-Kα radiation (λ = 1.5418 Å) in the 2θ range of 5–50°. X-ray photoelectron spectra (XPS) were obtained on a Thermo Fischer Scientific ESCALAB XI+ using an Al Kα (hν = 1486.6 eV) X-ray source with a base vacuum operated at 300 W. All XPS spectra were evaluated using Casa XPS software. All spectra were calibrated using the C 1s band at 284.1 eV as a reference. The intensity of the XPS core level electron was measured as the band area after standard background subtraction as per the linear procedure. The take-off angle φ (angle between the sample and detector) of 80° was defined with a precision of 1°. The typical sample size was 1 × 1 cm2. All spectra were corrected with a slight linear background before fitting.
Dynamic light scattering (DLS) experiments were performed with a Malvern Nano series Zeta-Sizer to measure the hydrodynamic diameter of the prepared nanosheets. Field emission-scanning electron microscopy (FE-SEM) images were collected using a JEOL JSM-7100F instrument operated at 18 kV accelerating voltage. Samples were drop-cast on silicon wafers and allowed to dry in a desiccator overnight before observation. Transmission electron microscopy (TEM) was conducted on a JEOL JEM-2100 electron microscope operating at 200 kV accelerating voltage. Samples were prepared by putting a drop of chloroform–tetrahydrofuran (1 : 1, v/v) dispersion of the nanosheets on the surface of lacey-carbon supported copper TEM grids. AFM was conducted by testing the samples deposited on silicon wafers using tapping mode with an NT-MDT Ntegra Aura atomic force microscope. The detailed description of cantilever used for AFM measurements is presented below.
| Cantilever length (L ± 10 μm) | Cantilever width (W ± 5 μm) | Cantilever thickness (T ± 0.5 μm) | Resonance frequency, kHz | Force constant, N m−1 |
|---|---|---|---|---|
| 125 | 30 | 1.5–2.5 | 87–230 | 1.45–15.1 |
The used cantilever tip has a tetrahedral shape and the last 500 nm from the tip apex (cone angle 7°–10°) is cylindrical in shape. The height of the tip is around 14–16 μm with a 10 nm curvature radius.
Photophysical studies
The luminescence properties of L·Eu and L·Tb were examined in the solid state and also in MeCN solvent suspensions at room temperature. During the fluorescence investigation, the solid L·Eu and L·Tb powders (2 mg) were dispersed in 2 mL of MeCN solution and treated by ultrasonication for 30 min. For fluorescence titration experiments, MeCN solutions of explosive materials of concentration 1 × 10⁻³ mol L−1 were prepared. The emission spectra were recorded with an excitation wavelength of 325 nm, while the slit widths of both the source and detector for the excitation and the emission were maintained at 1 nm to ensure consistency. The Stern–Volmer (S–V) equation I0/I = 1 + KSV[Q] was used to calculate the fluorescence quenching process.46,47 Herein, I0 and I refer to the unquenched-to-quenched fluorescence intensities in the absence and presence of the quencher, respectively, [Q] is the concentration of the explosives and KSV is the Stern–Volmer constant.
The lifetime measurements were carried out at room temperature (298 K) using a Fluorolog-3 (Horiba Jobin Yvon) spectrofluorometer in decay-by-delay mode. The samples were excited at 325 nm employing a pulsed xenon lamp with a full-width at half-maximum of each pulse of 3 microseconds.
Determination of HOMO–LUMO energy levels
The oxidation potentials (Eox) of L·Eu and L·Tb were measured by differential pulse voltammetry and then these potentials were used for the estimation of the HOMO and LUMO energy values. Electrochemical measurements were performed using a CH Instruments electrochemical workstation and a conventional three electrode cell system was used with a platinum electrode as a working electrode and counter electrode and an Ag/AgCl (saturated KCl) electrode as a reference electrode. All measurements were carried out in DMF medium containing 0.1 M tetrabutyl ammonium hexafluorophosphate (TBAPF6) as a supporting electrolyte. The solutions were deaerated by nitrogen bubbling through the solution for 15 min before the measurements. For calculations of HOMO and LUMO energy values, the empirical relation EHOMO = [(Eox − E1/2(ferrocene)) + 4.8] eV was used. Ferrocene (Fc) was used as an external standard and the E1/2(ferrocence) for the Fc/Fc+ couple is equal to 0.41 V, which was used in an equation to calculate the EHOMO. The band gap energy (E0–0) values were obtained from the intersection of the normalized absorption and emission spectra of L·Eu and L·Tb by using the following equation:E0–0 = {1240/(λintersecting)} eV.
Conflicts of interest
The authors declare no competing financial interest.
Supplementary Material
Acknowledgments
T. S. M. acknowledges SERB (India) (Grant PDF/2016/002461) for funding and fellowship. A. D. acknowledges SERB (India) (SB/S1/IC-23/2013 & JCB/2017/000004) and DRDO (ERIP/ER/1502249/M/01) for funding. The authors acknowledge Prof. Anunay Samanta for his help with the lifetime measurement experiments and his suggestions.
Electronic supplementary information (ESI) available. See DOI: 10.1039/c9sc05403k
References
- Tan C. Cao X. Wu X.-J. He Q. Yang J. Zhang X. Chen J. Zhao W. Han S. Nam G.-H. Sindoro M. Zhang H. Chem. Rev. 2017;117:6225–6331. doi: 10.1021/acs.chemrev.6b00558. [DOI] [PubMed] [Google Scholar]
- Dreyer D. R. Park S. Bielawski C. W. Ruoff R. S. Chem. Soc. Rev. 2010;39:228–240. doi: 10.1039/B917103G. [DOI] [PubMed] [Google Scholar]
- Ma R. Sasaki T. Acc. Chem. Res. 2015;48:136–143. doi: 10.1021/ar500311w. [DOI] [PubMed] [Google Scholar]
- Lee H. S. Min S.-W. Park M. K. Lee Y. T. Jeon P. J. Kim J. H. Ryu S. Im S. Small. 2012;8:3111–3115. doi: 10.1002/smll.201200752. [DOI] [PubMed] [Google Scholar]
- Tan C. Zhang H. Chem. Soc. Rev. 2015;44:2713–2731. doi: 10.1039/C4CS00182F. [DOI] [PubMed] [Google Scholar]
- Wang Z. Jingjing Q. Wang X. Zhang Z. Chen Y. Huang X. Huang W. Chem. Soc. Rev. 2018;47:6128–6174. doi: 10.1039/C8CS00332G. [DOI] [PubMed] [Google Scholar]
- Dong J. Zhang K. Li X. Qian Y. Zhu H. Yuan D. Xu Q.-H. Jiang J. Zhao D. Nat. Commun. 2017;8:1142. doi: 10.1038/s41467-017-01293-x. [DOI] [PMC free article] [PubMed] [Google Scholar]
- Li X. Qiao S. Zhao L. Liu S. Li F. Yang F. Luo Q. Hou C. Xu J. Liu J. ACS Nano. 2019;13:1861–1869. doi: 10.1021/acsnano.8b08021. [DOI] [PubMed] [Google Scholar]
- Zhao M. Wang Y. Ma Q. Huang Y. Zhang X. Ping J. Zhang Z. Lu Q. Yu Y. Xu H. Zhao Y. Zhang H. Adv. Mater. 2015;27:7372–7378. doi: 10.1002/adma.201503648. [DOI] [PubMed] [Google Scholar]
- Takada K. Sakamoto R. Yi S.-T. Katagiri S. Kambe T. Nishihara H. J. Am. Chem. Soc. 2015;137:4681–4689. doi: 10.1021/ja510788b. [DOI] [PubMed] [Google Scholar]
- Tsukamoto T. Takada K. Sakamoto R. Matsuoka R. Toyoda R. Maeda H. Yagi T. Nishikawa M. Shinjo N. Amano S. Iokawa T. Ishibashi N. Oi T. Kanayama K. Kinugawa R. Koda Y. Komura T. Nakajima S. Fukuyama R. Fuse N. Mizui M. Miyasaki M. Yamashita Y. Yamada K. Zhang W. Han R. Liu W. Tsubomura T. Nishihara H. J. Am. Chem. Soc. 2017;139:5359–5366. doi: 10.1021/jacs.6b12810. [DOI] [PubMed] [Google Scholar]
- Sakamoto R. Hoshiko K. Liu Q. Yagi T. Nagayama T. Kusaka S. Tsuchiya M. Kitagawa Y. Wong W.-Y. Nishihara H. Nat. Commun. 2015;6:6713. doi: 10.1038/ncomms7713. [DOI] [PMC free article] [PubMed] [Google Scholar]
- Tan J.-C. Saines P. J. Bithell E. G. Cheetham A. K. ACS Nano. 2012;6:615–621. doi: 10.1021/nn204054k. [DOI] [PubMed] [Google Scholar]
- Ashoka Sahadevan S. Monni N. Abhervé A. Marongiu D. Sarritzu V. Sestu N. Saba M. Mura A. Bongiovanni G. Cannas C. Quochi F. Avarvari N. Mercuri M. L. Chem. Mater. 2018;30:6575–6586. doi: 10.1021/acs.chemmater.8b03399. [DOI] [Google Scholar]
- Araki T. Kondo A. Maeda K. Chem. Commun. 2013;49:552–554. doi: 10.1039/C2CC36703C. [DOI] [PubMed] [Google Scholar]
- Wang H.-S. Li J. Li J.-Y. Wang K. Ding Y. Xia X.-H. NPG Asia Mater. 2017;9:e354. doi: 10.1038/am.2017.7. [DOI] [Google Scholar]
- Hu H. Liu S. Li D. Wang M. Moats R. Shan H. Conti P. S. Li Z. J. Mater. Chem. B. 2014;2:3998–4007. doi: 10.1039/C4TB00144C. [DOI] [PubMed] [Google Scholar]
- Wang F. Han Y. Lim C. S. Lu Y. Wang J. Xu J. Chen H. Zhang C. Hong M. Liu X. Nature. 2010;463:1061. doi: 10.1038/nature08777. [DOI] [PubMed] [Google Scholar]
- Singha Mahapatra T. Singh H. Maity A. Dey A. Pramanik S. K. Suresh E. Das A. J. Mater. Chem. C. 2018;6:9756–9766. doi: 10.1039/C8TC03487G. [DOI] [Google Scholar]
- Heffern M. C. Matosziuk L. M. Meade T. J. Chem. Rev. 2014;114:4496–4539. doi: 10.1021/cr400477t. [DOI] [PMC free article] [PubMed] [Google Scholar]
- Bauer T. Zheng Z. Renn A. Enning R. Stemmer A. Sakamoto J. Schlüter A. D. Angew. Chem., Int. Ed. 2011;50:7879–7884. doi: 10.1002/anie.201100669. [DOI] [PubMed] [Google Scholar]
- Sun X. Wang Y. Lei Y. Chem. Soc. Rev. 2015;44:8019–8061. doi: 10.1039/C5CS00496A. [DOI] [PubMed] [Google Scholar]
- Salinas Y. Martínez-Máñez R. Marcos M. D. Sancenón F. Costero A. M. Parra M. Gil S. Chem. Soc. Rev. 2012;41:1261–1296. doi: 10.1039/C1CS15173H. [DOI] [PubMed] [Google Scholar]
- Xie W. Zhang S.-R. Du D.-Y. Qin J.-S. Bao S.-J. Li J. Su Z.-M. He W.-W. Fu Q. Lan Y.-Q. Inorg. Chem. 2015;54:3290–3296. doi: 10.1021/ic5029383. [DOI] [PubMed] [Google Scholar]
- Fu H.-R. Yan L.-B. Wu N.-T. Ma L.-F. Zang S.-Q. J. Mater. Chem. A. 2018;6:9183–9191. doi: 10.1039/C8TA02857E. [DOI] [Google Scholar]
- Goswami R. Mandal S. C. Pathak B. Neogi S. ACS Appl. Mater. Interfaces. 2019;11:9042–9053. doi: 10.1021/acsami.8b20013. [DOI] [PubMed] [Google Scholar]
- Mosca L. Karimi Behzad S. Anzenbacher P. J. Am. Chem. Soc. 2015;137:7967–7969. doi: 10.1021/jacs.5b04643. [DOI] [PubMed] [Google Scholar]
- Zhang Y. Li B. Ma H. Zhang L. Zhang W. J. Mater. Chem. C. 2017;5:4661–4669. doi: 10.1039/C7TC00936D. [DOI] [Google Scholar]
- Rachuri Y. Parmar B. Suresh E. Cryst. Growth Des. 2018;18:3062–3072. doi: 10.1021/acs.cgd.8b00204. [DOI] [Google Scholar]
- Latypov N. V. Bergman J. Langlet A. Wellmar U. Bemm U. Tetrahedron. 1998;54(38):11525–11536. doi: 10.1016/S0040-4020(98)00673-5. [DOI] [Google Scholar]
- Zhang Y. Sun Q. Xu K. Song J. Zhao F. Propellants, Explos., Pyrotech. 2016;41(1):35–52. doi: 10.1002/prep.201500065. [DOI] [Google Scholar]
- Schmatloch S. González M. F. Schubert U. S. Macromol. Rapid Commun. 2002;23:957–961. doi: 10.1002/1521-3927(200211)23:16<957::AID-MARC957>3.0.CO;2-W. [DOI] [Google Scholar]
- Baltrusaitis J. Jayaweera P. M. Grassian V. H. Phys. Chem. Chem. Phys. 2009;11:8295–8305. doi: 10.1039/B907584D. [DOI] [PubMed] [Google Scholar]
- Kim D. Kim S.-C. Bae J.-S. Kim S. Kim S.-J. Park J.-C. Inorg. Chem. 2016;55:8359–8370. doi: 10.1021/acs.inorgchem.6b00637. [DOI] [PubMed] [Google Scholar]
- Taddei M. Costantino F. Vivani R. Sangregorio C. Sorace L. Castelli L. Cryst. Growth Des. 2012;12:2327–2335. doi: 10.1021/cg201706p. [DOI] [Google Scholar]
- Singha Mahapatra T. Bauzá A. Dutta D. Mishra S. Frontera A. Ray D. ChemistrySelect. 2016;1:64–75. doi: 10.1002/slct.201600006. [DOI] [Google Scholar]
- Pfeffermann M. Dong R. Graf R. Zajaczkowski W. Gorelik T. Pisula W. Narita A. Müllen K. Feng X. J. Am. Chem. Soc. 2015;137:14525–14532. doi: 10.1021/jacs.5b09638. [DOI] [PMC free article] [PubMed] [Google Scholar]
- Sohn H. Sailor M. J. Magde D. Trogler W. C. J. Am. Chem. Soc. 2003;125:3821–3830. doi: 10.1021/ja021214e. [DOI] [PubMed] [Google Scholar]
- Nagarkar S. S. Joarder B. Chaudhari A. K. Mukherjee S. Ghosh S. K. Angew. Chem., Int. Ed. 2013;52:2881–2885. doi: 10.1002/anie.201208885. [DOI] [PubMed] [Google Scholar]
- Mandal A. K. Suresh M. Das A. Org. Biomol. Chem. 2011;9:4811–4817. doi: 10.1039/C0OB01106A. [DOI] [PubMed] [Google Scholar]
- Khatua S. Goswami S. Biswas S. Tomar K. Jena H. S. Konar S. Chem. Mater. 2015;27:5349–5360. doi: 10.1021/acs.chemmater.5b01773. [DOI] [Google Scholar]
- Ma H. Li B. Zhang L. Han D. Zhu G. J. Mater. Chem. A. 2015;3:19346–19352. doi: 10.1039/C5TA05447H. [DOI] [Google Scholar]
- Hu X.-L. Qin C. Wang X.-L. Shao K.-Z. Su Z.-M. Chem. Commun. 2015;51:17521–17524. doi: 10.1039/C5CC07004J. [DOI] [PubMed] [Google Scholar]
- Türker L. Def. Technol. 2018;14:179–187. doi: 10.1016/j.dt.2017.11.009. [DOI] [Google Scholar]
- Wang B. Lv X.-L. Feng D. Xie L.-H. Zhang J. Li M. Xie Y. Li J.-R. Zhou H.-C. J. Am. Chem. Soc. 2016;138:6204–6216. doi: 10.1021/jacs.6b01663. [DOI] [PubMed] [Google Scholar]
- Singha Mahapatra T. Chaudhury S. Dasgupta S. Bertolasi V. Ray D. New J. Chem. 2016;40:2268–2279. doi: 10.1039/C5NJ02410B. [DOI] [Google Scholar]
- Zhang Q. Wang J. Kirillov A. M. Dou W. Xu C. Xu C. Yang L. Fang R. Liu W. ACS Appl. Mater. Interfaces. 2018;10:23976–23986. doi: 10.1021/acsami.8b06103. [DOI] [PubMed] [Google Scholar]
- Barry D. E. Caffrey D. F. Gunnlaugsson T. Chem. Soc. Rev. 2016;45:3244–3274. doi: 10.1039/C6CS00116E. [DOI] [PubMed] [Google Scholar]
- D'Aléo A. Pointillart F. Ouahab L. Andraud C. Maury O. Coord. Chem. Rev. 2012;256:1604–1620. doi: 10.1016/j.ccr.2012.03.023. [DOI] [Google Scholar]
Associated Data
This section collects any data citations, data availability statements, or supplementary materials included in this article.


