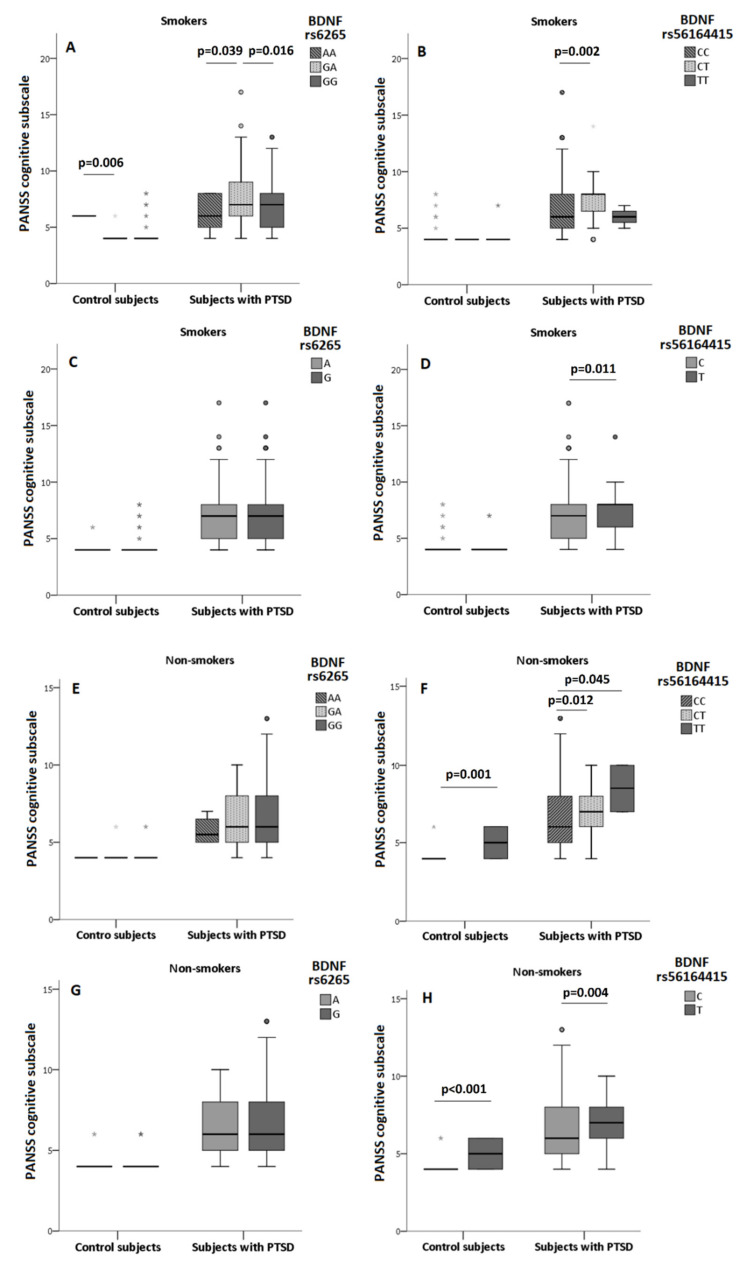
Figure 2.
PANSS cognitive subscale scores in control subjects and subjects with PTSD, divided by smoking status, depending on BDNF rs6265 (A,C,E,G) and BDNF rs56164415 (B,D,F,H) polymorphisms. Results are shown using the box and whiskers plot, where the central box represents the interquartile range (IQR), middle line the median, whiskers 1.5 IQR, dots the outliers, and grey asterix presents extreme values. The differences between groups were analyzed using Kruskal–Wallis ANOVA, followed by the Dunn’s test, or Mann–Whitney U test.

