

Abstract
Background:
Methamphetamine use, with and without opioids, has increased substantially, but little is known about the sociodemographic characteristics, substance use patterns, or health profiles of individuals who use methamphetamine. To design effective public health interventions, health care professionals and policymakers need data describing individuals who are using methamphetamine in the midst of the opioid crisis.
Methods:
We used 2015–2018 data from the National Survey on Drug Use and Health and included non-elderly adults aged 18–64 years. We categorized respondents into three groups: use of opioids without methamphetamine use, use of methamphetamine without opioid use, or use of both opioids and methamphetamine. Multiple logistic regression models controlling for sociodemographic factors were used to compare substance use characteristics and measures of individual health between the three groups.
Results:
People who used any methamphetamine were more likely to be unstably housed, low-income, and live in rural areas. Use of both opioids and methamphetamine was associated with a 132 % higher prevalence of injection needle use, and a nearly twofold higher prevalence of viral hepatitis compared with opioid use alone. One third of individuals reporting use of both opioids and methamphetamine had a severe mental illness, a 55 % higher prevalence than those using opioids alone.
Conclusions:
Individuals who used opioids and methamphetamine had more complex substance use and health profiles than individuals who used opioids alone. These findings suggest public health and harm reduction approaches designed to address opioid use remain important in an era of rising methamphetamine use.
Keywords: Methamphetamine use, Opioid use, Polysubstance use, HIV/AIDs, Mental illness
1. Introduction
In the midst of a declared public health emergency due to opioids, methamphetamine-related hospitalizations increased nearly 4-fold and stimulant-related deaths have increased more than 10-fold (Ruhm, 2019; Winkelman et al., 2018a). In 2018, the overdose death rate for psychostimulants with abuse potential, such as methamphetamine, surpassed the rate for prescription opioids (Hedegaard et al., 2020). While opioid-specific morbidity has received substantial attention and funding, use of both opioids and methamphetamine is a growing public health challenge. An analysis of heroin treatment admissions between 2008 and 2017 found a 490 % increase in patients also reporting methamphetamine use (Jones et al., 2019). Recent estimates suggest half of psychostimulant deaths involve an opioid, while opioid deaths involving methamphetamine increased 15 % between 2017 and 2018 (Gladden et al., 2019; Ihongbe and Masho, 2016; Kariisa et al., 2019; Lancet, 2018; Palamar et al., 2018; Wu et al., 2007). Despite the rapid resurgence of methamphetamine after a period of decline following its peak in the mid-2000s, efforts to characterize the population that uses methamphetamine, and their health needs, have been limited (Enos, 2019).
The opioid crisis, characterized by a triple wave of increasing morbidity and mortality related to prescription opioids, heroin, and synthetic opioids, has spurred a large and diverse public health response to curb overdose deaths, infectious complications, and associated comorbidities. For example, the National Institutes of Health launched the Helping to End Addiction Long-term (HEAL) initiative to accelerate addiction treatment and pain management research and practice (National Institutes of Health, 2018). Jurisdictions have tried to reduce the spread of infectious disease and rates of overdose by increasing access to medications for opioid use disorder (OUD) and harm reduction programs such as naloxone distribution and syringe exchanges (Aspinall et al., 2014; Centers for Disease Control and Prevention, 2019; Kral and Davidson, 2017; Ma et al., 2019). The opioid epidemic has also increased attention on social determinants of health, such as housing instability, and co-occurring mental health which increase opioid-related morbidity (Al-Tayyib et al., 2017; Edlund et al., 2015; Fazel et al., 2014; Lankenau et al., 2015; Mackesy-Amiti et al., 2015). For example, medications for OUD have been integrated into existing outpatient mental health treatment programs to address both mental health and OUD (Wishner et al., 2018). While infrastructure to address the opioid crisis has increased, it is unclear whether these tools will translate to populations who use methamphetamine alone or use both opioids and methamphetamine. A deeper understanding of the similarities and differences between people who use opioids, methamphetamine, or both could help inform whether approaches to the opioid crisis can be adapted to address rising rates of methamphetamine use.
To address important gaps in our understanding of the evolving opioid crisis, we examined US data from 2015 to 2018 and compared sociodemographic characteristics, patterns of substance use, and health profiles among individuals who used opioids, methamphetamine, or both. We hypothesized that people who reported use of both opioids and methamphetamine or use of methamphetamine alone would have more complex substance use patterns and higher risk health profiles than the those who used opioids alone.
2. Methods
2.1. Participants and data source
The National Survey on Drug Use and Health (NSDUH) is a nationally representative annual survey of the U.S. civilian, non-institutionalized population 12 years and older (Center for Behavioral Health Statistics and Quality, 2019a). It provides information on the use of alcohol, tobacco, and illicit substances in addition to demographic information, mental health, and other measures of individual health. In 2015, the questionnaire underwent a partial redesign to better capture rates of prescription and illicit substance use. As a result, earlier years of substance use data could not be pooled with results from 2015 and after (Center for Behavioral Health Statistics and Quality, 2016). For this analysis we pooled responses from 2015 to 2018 for the non-elderly, adult population aged 18–64, since fewer than 4 % of all adults who reported drug use were 65 or older.
The NSDUH selects respondents using stratification and five stages of sample selection. Interviews are conducted in person using computer assisted instruction and audio computer assisted self-interview for sensitive topics to ensure anonymity of responses. Participants are given $30 for their time completing the interview. The weighted screening response and weighted interview response rates during our study period ranged from 49 to 80% and 67–70 %, respectively.
2.2. Methamphetamine and opioid use
To compare characteristics of people who use opioids and/or methamphetamine, we categorized respondents into 3 mutually exclusive groups: opioid use without methamphetamine use (referred to as opioid use alone), methamphetamine use without opioid use (referred to as methamphetamine use alone), and use of both opioids and methamphetamine. Because there are differences between those with infrequent and more frequent opioid use, we defined opioid use as four or more instances of prescription opioid misuse in the past month (i.e. weekly use) or any past year heroin use, but no methamphetamine use (Jones, 2012; Jones and McCance-Katz, 2019; Schepis et al., 2020). Methamphetamine use was defined as any past year methamphetamine use, but no opioid use. Use of both opioids and methamphetamine was defined as four or more instances of prescription opioid misuse in the past month (i.e. weekly use) or any past year heroin use and methamphetamine use in the past year. As the NSDUH relies on self-reported drug use, our analysis does not capture those who were unknowingly exposed to opioids or methamphetamine (e.g., methamphetamine contaminated with fentanyl).
2.3. Substance use characteristics
We analyzed several substance use characteristics. We assessed other illicit drug use with a binary indicator that included any past year cocaine, hallucinogen, inhalant, prescription stimulant, sedative, or tranquilizer use. We also assessed any past year needle use. We estimated cigarette use or marijuana use in the past month. Alcohol abuse or dependence was determined using Diagnostic and Statistical Manual of Mental Disorders IV criteria. Past year treatment was recorded if respondents reported any treatment or counseling related to drug use.
2.4. Health characteristics
We analyzed health characteristics among people who used opioids, methamphetamine, or both. Respondents reported whether they had ever been told by a doctor or health care professional that they had a heart condition, high blood pressure, diabetes, asthma, chronic bronchitis or chronic obstructive pulmonary disease (COPD), kidney disease, hepatitis B or C, human immunodeficiency virus or acquired immune deficiency syndrome (HIV/AIDS), or cancer (excluding non-melanoma skin cancer). We included a diagnosis of asthma only if a respondent reported currently having asthma. A sexually transmitted infection (STI) was recorded if respondents recalled having any STI such as chlamydia, gonorrhea, herpes, or syphilis in the past year. Aggregations of reported health outcomes were also compared between groups. These included any infectious disease (HIV/AIDS, hepatitis B or C, and/or past year STI diagnosis), any respiratory disease (COPD and/or current asthma), any cardiovascular disease (any heart condition and/or high blood pressure), and the number of chronic conditions (hypertension, heart condition, diabetes, cancer, hepatitis B or C, kidney disease, COPD, HIV/AIDS, or asthma).
A disability was reported if a respondent stated having difficulty seeing, hearing, concentrating, walking or climbing, dressing or bathing, or doing errands alone. Questions related to disability conformed to the 6-item standard recommended by the U.S. Department of Health and Human Services (Department of Health and Human Services, 2015).
Severe mental illness (SMI) was estimated using a predictive model validated by the Substance Abuse and Mental Health Services Administration. The model takes into account measures from the K6 Psychological Distress Scale, World Health Organization Disability Assessment Scale, past year suicidal ideation, past year major depressive disorder, and age (Center for Behavioral Health Statistics and Quality, 2019a).
An individual was determined to be uninsured if they were not covered by private insurance, Medicare, Medicaid/Children’s Health Insurance Program, Veterans Affairs/Military insurance, or other health insurance.
2.5. Sociodemographic variables
The sociodemographic variables we used in this analysis included age, gender, race/ethnicity, income, education level, rural or urban residence, and housing instability. Rural residence was defined as living in a non-metro county based on the 2013 rural/urban continuum codes. Although there is no consistent definition of housing instability in the literature, the number of past moves is one of the most frequently used indicators in extant literature (Frederick et al., 2014). We defined housing instability as having moved 3 or more times in the past year. We controlled for these characteristics in adjusted models.
2.6. Statistical analysis
First, we estimated the annual prevalence from 2015 to 2018 for each of our primary groups of interest using weighted frequencies: those who used opioids alone, methamphetamine alone, or both opioids and methamphetamine. We tested the significance of annual changes in drug use prevalence using a linear regression model. We then compared the weighted frequencies of sociodemographic characteristics across the three groups of interest.
Next, detailed substance use characteristics were compared between groups. We estimated drug use characteristics including other illicit drug use, prevalence of needle use, substance use disorders, and whether someone received treatment with multiple logistic regression models.
We also estimated each health characteristic using multiple logistic regression adjusting for sociodemographic variables including age, gender, race/ethnicity, income, education level, and housing instability. The number of chronic conditions per person was calculated using Poisson regression adjusting for the same sociodemographic variables.
As a sensitivity analysis we conducted all analyses among the entire adult population aged 18 and older, including individuals aged 65 and older. In addition, after analyzing our prespecified analyses, we conducted an additional post-hoc analysis to compare people who used methamphetamine but not heroin with people who reported heroin use but not methamphetamine use in the past year; heroin use generally carries more health risks than prescription opioid use. In this post-hoc analysis, we also examined the age of first use of heroin or methamphetamine.
All analyses incorporated primary sampling unit, strata, and weight variables to account for the complex survey design of the NSDUH. We followed SAMHSA’s suppression criteria (Center for Behavioral Health Statistics and Quality, 2019b). We used Stata 15.1 for all data management and analyses. This study was determined to not be human subjects research per the Hennepin Healthcare Research Institute’s Policy on using publicly available, deidentified data.
3. Results
3.1. Prevalence and trends in use of opioids, methamphetamine, or both
Our unweighted sample consisted of 156,870 individuals from 2015 to 2018; 1511 reported use of opioids alone, 1081 reported use of methamphetamine alone, and 397 reported use of both opioids and methamphetamine. This represented annualized weighted totals of 1,713,000 (95 % CI 1,573,000–1,852,000) individuals who reported opioid use alone, 1,205,000 (95 % CI, 1,105,000–1,304,000) who reported methamphetamine use alone, and 389,000 (95 % CI, 337,000–441,000) who reported use of both opioids and methamphetamine in the past year.
Between 2015 and 2018 the weighted total of individuals who used opioids alone in the past year decreased from 1,846,000 (95 % CI, 1,640,000–2,052,000) to 1,400,000 (95 % CI, 1,114,000–1,687,000). In 2015, 1,247,000 (95 % CI, 1,052,000–1,442,000) people reported methamphetamine use alone, and 321,000 (95 % CI, 229,000–413,000) people reported both opioid and methamphetamine use. In 2018, 1,403,000 (95 % CI, 1,147,000–1,659,000) people reported methamphetamine use alone, and 422,000 (95 % CI, 321,000–523,000) people reported both opioid and methamphetamine use (Fig. 1). Using a linear regression, the decrease in opioid use was statistically significant (p = 0.003), while changes in use of methamphetamine alone and use of both opioids and methamphetamine were not statistically significant.
Fig. 1.
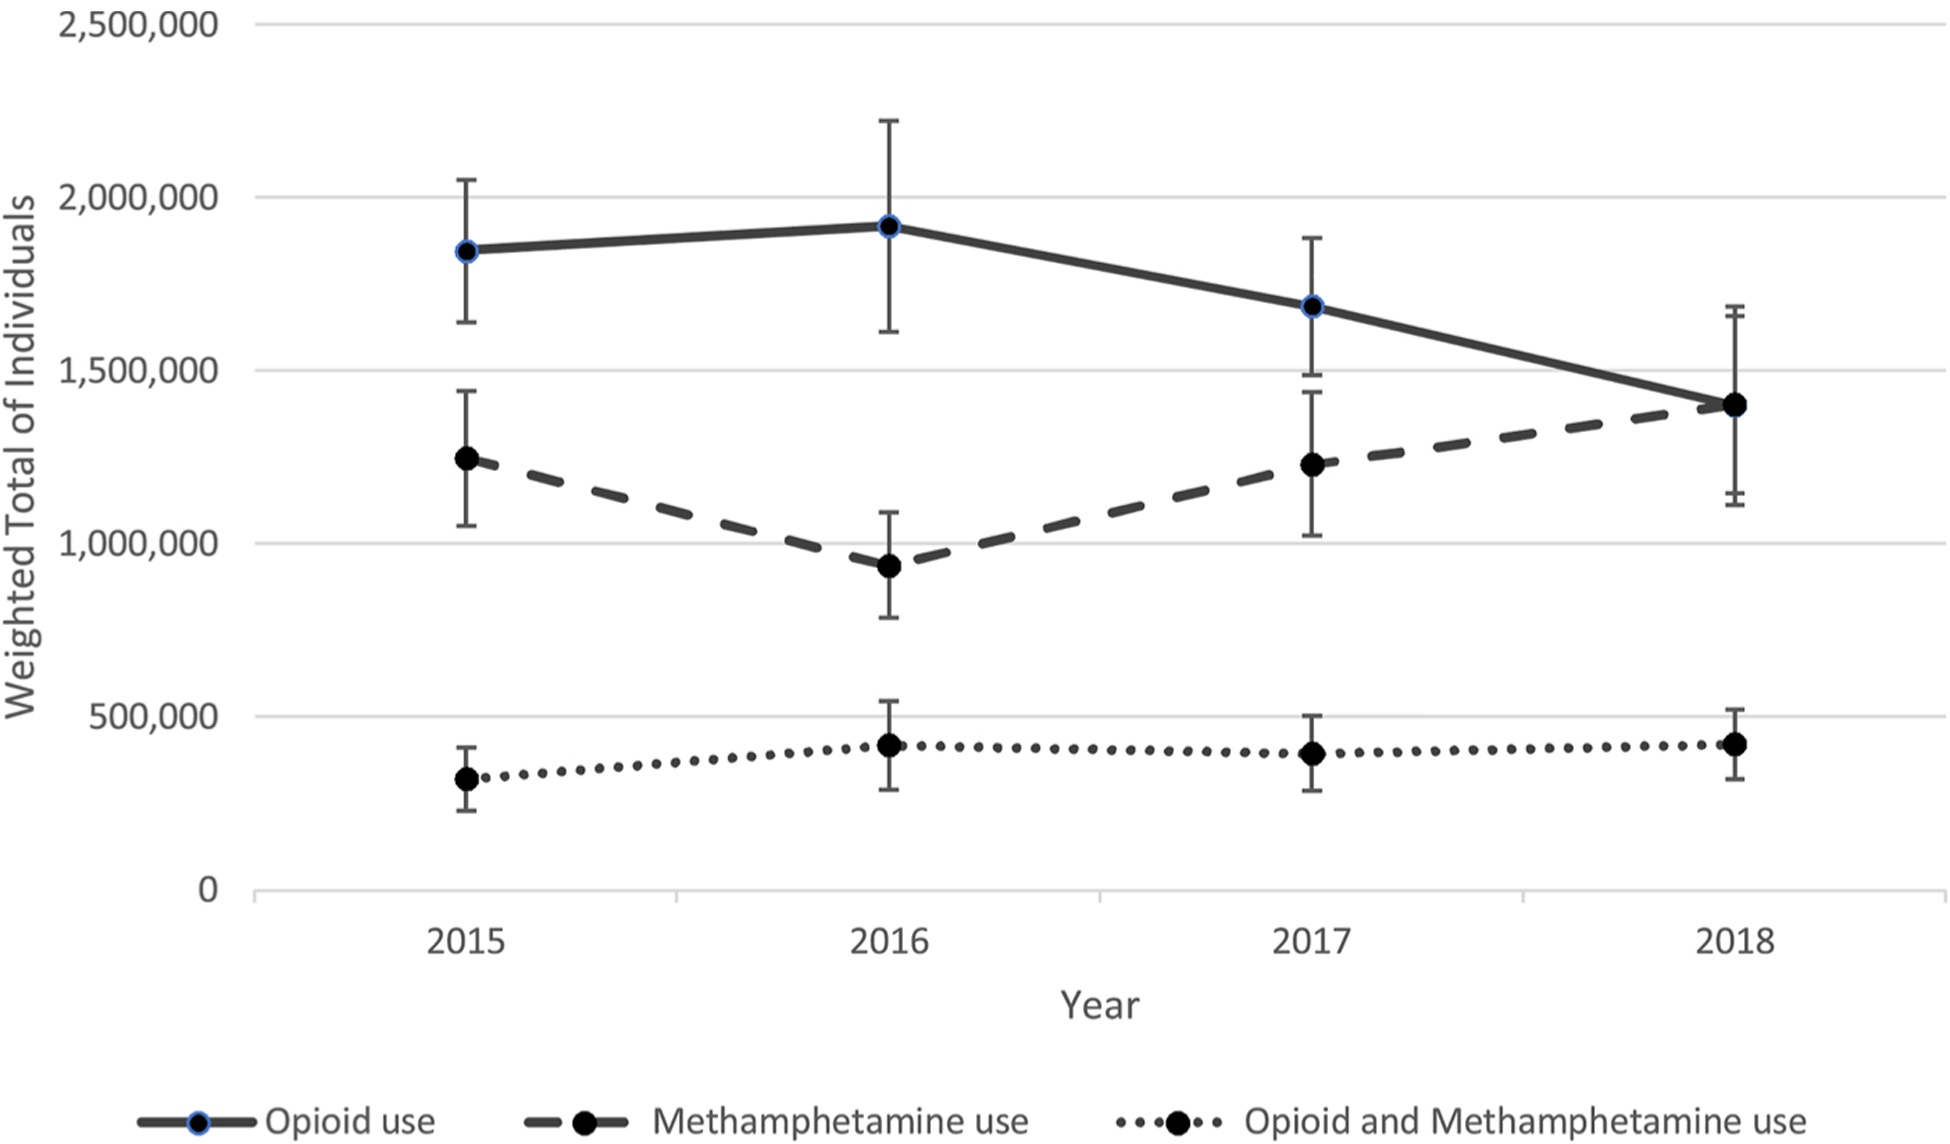
Trends in use of opioids, methamphetamine, or both – United States, 2015–2018.
Opioid use is defined as any past year heroin use or misusing prescription pain relievers 4 or more times in the past month. Methamphetamine use is defined as any past year methamphetamine use.
3.2. Sociodemographic characteristics of the study population
Compared to people who used opioids alone, people who reported methamphetamine use alone or both opioid and methamphetamine use were more likely to live in rural areas, be unstably housed, and fall below the federal poverty line (Table 1). Compared to individuals who used opioids alone, people who reported methamphetamine use alone were less likely to have a high school education or higher and those who reported use of both opioids and methamphetamine were significantly more likely to be white.
Table 1.
Sociodemographic characteristics of study population by drug use category – United States.2015–2018.
| Characteristic | Weighted % (95 % CI) | ||
|---|---|---|---|
| Opioid use (N = 1511) | Methamphetamine use (N = 1081) | Opioid and Methamphetamine use (N = 397) | |
| Weighted percentage | 51.8 (49.2–54.4) | 36.4 (34.3–38.6) | 11.8 (10.2–13.5) |
| Male | 59.8 (56.4–63.1) | 62.4 (58.7–66.0) | 63.7 (56.2–70.7) |
| Race/ethnicity | |||
| White | 70.1 (66.2–73.6) | 68.8 (64.5–72.9) | 83.9 (77.7–88.6) |
| African American | 12.8 (10.1–16.1) | 5.2 (3.7–7.4) | 2.3 (0.7–6.8) |
| Hispanic | 12.9 (10.4–16.0) | 18.2 (15.1–21.8) | 8.7 (5.3–13.9) |
| Other | 4.2 (3.1–5.6) | 7.7 (5.8–10.3) | 5.1 (3.2–8.0) |
| Age (years) | |||
| 18–25 | 19.4 (17.4–21.4) | 18.8 (16.5–21.4) | 24.0 (18.9–29.9) |
| 26–34 | 28.1 (25.6–30.6) | 25.9 (22.6–29.4) | 30.7 (24.9–37.2) |
| 35–49 | 26.3 (23.3–29.5) | 33.5 (30.2–36.9) | 27.0 (20.7–34.2) |
| 50–64 | 26.3 (22.2–30.9) | 21.9 (18.2–26.0) | 18.3 (12.0–26.9) |
| Incomea | |||
| < 100 % FPL | 24.3 (21.3–27.7) | 33.2 (29.8–36.7) | 35.6 (28.8–42.9) |
| 100–200 % FPL | 23.7 (21.0–26.7) | 26.9 (23.9–30.2) | 31.4 (25.1–38.4) |
| > 200 % FPL | 51.9 (48.0–55.8) | 39.9 (36.5–43.3) | 33.0 (26.5–40.2) |
| Education level | |||
| Less than HS | 16.2 (13.7–19.0) | 25.8 (22.3–29.7) | 19.5 (14.2–26.1) |
| HS | 32.9 (29.1–37.0) | 33.2 (29.1–37.6) | 38.0 (31.1–45.5) |
| Some College | 36.9 (34.0–39.9) | 32.8 (28.5–37.4) | 33.0 (27.0–39.7) |
| College Grad | 14.0 (11.2–17.4) | 8.2 (5.8–11.3) | 9.5 (5.5–15.9) |
| Rural residence | 14.4 (12.2–16.8) | 21.4 (18.0–25.1) | 21.4 (16.5–27.3) |
| Unstably housedb | 7.6 (6.0–9.5) | 11.7 (9.4–14.5) | 15.5 (11.2–21.0) |
Opioid use is defined as any past year heroin use or misusing prescription pain relievers 4 or more times in the past month. Methamphetamine use is defined as any past year methamphetamine use.
FPL = federal poverty level.
3 or more moves in the past year.
3.3. Substance use characteristics among people who use opioids, methamphetamine, or both
People who used both opioids and methamphetamine had the most complex patterns of substance use across a range of characteristics (Table 2). Individuals reporting use of both opioids and methamphetamine were more than twice as likely to report injection needle use (46.2 % [95 % CI, 38.5–53.9]), compared with individuals who used opioids alone (19.9 % [95 % CI, 17.7–22.1]). Of individuals who reported use of both opioids and methamphetamine, 87.7 % (95 % CI, 82.8–92.6) used at least one additional illicit substance in the past year, more than 10 percentage points higher than groups who reported opioid or methamphetamine use alone. Among those who reported opioid use alone or use of both opioids and methamphetamine, 35.4 % (95 % CI, 32.1–38.6) and 68.3 % (95 % CI, 61.0–75.6), respectively, reported past year heroin use. In annualized weighted totals, 871,000 (95 % CI, 782,000–960,000) people reported any past year heroin use. Among individuals who reported past year heroin use, 31.6 % reported use with methamphetamine (Weighted N: 276,000 [95 % CI, 231,000–320,000]). People who reported use of both opioids and methamphetamine were more likely to report past month cigarette use. Those who reported methamphetamine use alone or both opioid and methamphetamine use were more likely to report past month marijuana use compared with those who used opioids alone.
Table 2.
Substance use characteristics by drug use category – United States.2015–2018.
| Characteristic | Weighted % (95 % CI) | ||
|---|---|---|---|
| Opioid use (N = 1511) | Methamphetamine use (N = 1081) | Opioid and Methamphetamine use (N = 397) | |
| Past year heroin use | 35.4 (32.1–38.6) | NA | 68.3 (61.0–75.6)a |
| Past year injection needle use | 19.9 (17.7–22.1) | 16.0 (13.0–19.1)c | 46.2 (38.5–53.9)a,d |
| Past year other illicit drug usee | 75.9 (73.6–78.3) | 71.6 (68.9–74.4)c | 87.7 (82.8–92.6)a,d |
| Alcohol abuse or dependence | 23.0 (19.9–26.0) | 25.5 (21.6–29.4) | 31.2 (25.5–37.0)b |
| Past month cigarette use | 68.9 (65.0–72.9) | 73.6 (70.0–77.1) | 81.1 (73.7–88.6)b |
| Past month marijuana use | 44.6 (40.8–48.4) | 50.8 (46.3–55.2)c | 55.9 (48.1–63.7)c |
| Past year treatment for illicit drug use | 17.1 (14.6–19.7) | 13.1 (10.4–15.7)c | 27.8 (22.3–33.2)a,d |
NA = not applicable.
All estimates are adjusted for age, sex, income, education rural vs. urban residence, race/ethnicity, and housing instability in the past year.
Opioid use is defined as any past year heroin use or misusing prescription pain relievers 4 or more times in the past month. Methamphetamine use is defined as any past year methamphetamine use.
P≤.0.001 compared to “Opioid use”.
P≤.0.01 compared to “Opioid use”.
P≤.0.05 compared to “Opioid use”.
P≤.0.001 compared to “Methamphetamine use”.
Other illicit drugs include cocaine, hallucinogens, inhalants, prescription stimulants, sedatives, or tranquilizers but does not include marijuana.
3.4. Health characteristics among people who use opioids, methamphetamine, or both
Individuals who used both opioids and methamphetamine were significantly more likely to have been diagnosed with an infectious disease including hepatitis B or C or an STI compared with those who used opioids alone (Table 3). HIV/AIDS rates were six times higher among individuals who reported methamphetamine use alone, compared with those who used opioids alone.
Table 3.
Health characteristics by drug use category – United States, 2015–2018.
| Characteristic | Weighted % (95 % CI) | ||
|---|---|---|---|
| Opioid use (N = 1511) | Methamphetamine use (N = 1081) | Opioid and Methamphetamine use (N = 397) | |
| Fair/poor health | 28.4 (24.6–32.1) | 25.7 (22.1–29.4) | 32.3 (25.1–39.4) |
| Any infectious disease | 12.0 (10.0–14.0) | 15.9 (12.0–19.9) | 21.8 (16.7–27.0)a,e |
| STI (past year) | 6.2 (4.8–7.6) | 9.1(6.6–11.6)c | 9.6 (5.8–13.4)c |
| HIV/AIDS | 0.6 (0.0–1.1) | 3.5 (1.5–5.5)b | 1.0 (−0.5–2.4) |
| Hepatitis B or C | 6.7 (4.9–8.5) | 6.9 (3.9–9.9) | 12.2 (8.8–15.6)b,e |
| Any respiratory disease | 11.6 (9.4–13.8) | 16.7 (13.8–19.6)b | 17.8 (11.9–23.7)c |
| Asthma | 7.4 (5.9–8.9) | 8.3 (6.7–10.0) | 7.2 (3.6–10.8) |
| COPD | 6.3 (4.6–7.9) | 10.4 (7.6–13.1)b | 12.9 (7.5–18.2)b |
| Any cardiovascular disease | 19.5 (15.8–23.1) | 17.3 (13.7–20.9) | 25.2 (18.5–32.0)e |
| Heart condition | 8.0 (5.6–10.3) | 7.6 (5.6–9.6) | 11.5 (5.7–17.3) |
| High blood pressure | 14.8 (11.4–18.2) | 12.6 (9.2–15.9) | 20.7 (14.4–27.0)d |
| Diabetes | 8.2 (6.1–10.2) | 7.0 (4.8–9.2) | 5.7 (1.8–9.6) |
| Kidney disease | 0.9 (0.3–1.5) | 2.0 (0.7–3.2) | * |
| Cancer | 2.4 (1.4–3.3) | 3.7 (1.5–5.8) | 3.5 (1.1–5.9) |
| Chronic Conditions per 100 individuals | 55.1 (47.7–62.4) | 62.5 (54.9–70.0) | 75.2 (61.5–89.0)b |
| Any disability | 37.7 (34.0–41.4) | 40.0 (35.6–44.3) | 42.1 (35.4–48.7) |
| Severe mental illness | 20.7 (17.3–24.0) | 22.8 (17.8–27.8) | 32.1 (25.0–39.1)b |
| Uninsured | 20.6 (17.9–23.3) | 22.6 (19.3–25.9) | 24.9 (18.0–31.9) |
All estimates are adjusted for age, sex, income, education, rural vs. urban residence, race/ethnicity, and housing instability in the past year.
Opioid use is defined as any past year heroin use or misusing prescription pain relievers 4 or more times in the past month. Methamphetamine use is defined as any past year methamphetamine use.
P≤.0.001 compared to “Opioid use”.
P≤.0.01 compared to “Opioid use”.
P≤.0.05 compared to “Opioid use”.
P≤.0.01 compared to “Methamphetamine use”.
P≤.0.05 compared to “Methamphetamine use”.
Estimate did not pass the NSDUH suppression requirements.
Rates of respiratory disease (i.e., COPD and/or Asthma) were higher among individuals who used methamphetamine alone or both opioids and methamphetamine at 16.7 % (95 % CI, 13.8–19.6) and 17.8 % (95 % CI, 11.9–23.7) respectively, compared to individuals who used opioids alone at 11.6 % (95 % CI, 9.4–13.8). There were no statistical differences in diabetes, kidney disease, or cancer rates between those who reported opioid use alone and those who reported methamphetamine use alone or those who reported both opioid and methamphetamine use. People who used both opioids and methamphetamine had a higher number of chronic conditions (hypertension, heart condition, diabetes, cancer, hepatitis B or C, kidney disease, COPD, HIV/AIDS, or asthma) at 75.2 per 100 people (95 % CI 61.5–89.0) compared to those who used opioids alone at 55.1 per 100 people (95 % CI 47.7–62.4).
Rates of disability were high for all use groups ranging from 37.7 % (95 % CI, 34.0–41.4) to 42.1 % (95 % CI, 35.4–48.7) for individuals reporting opioid use alone or use of both opioids and methamphetamine, respectively. Rates of SMI were 32.1 % (95 % CI, 25.0–39.1) for individuals who used both opioids and methamphetamine, which was 55 % more common compared to individuals who reported opioid use alone (Table 3).
Individuals who reported past year methamphetamine use alone had similar health profiles to those who reported past year heroin use alone (Appendix Table A1). However, rates of hepatitis B or C were higher among those reporting heroin use alone (14.7 % [95 % CI, 10.4–19.1]) compared with methamphetamine use alone (7.5 % [95 % CI, 4.7–10.4]). Individuals who used both heroin and methamphetamine in the past year were approximately 50 % more likely to have a severe mental illness compared to those using either substance alone.
We also conducted a sensitivity analysis using all adults and our original specification for opioid use of four or more instances of prescription opioid misuse in the past month (i.e. weekly use) or any past year heroin use. Results did not substantively change when we added elderly adults to our sample of non-elderly adults (Appendix Tables A2 and A3).
4. Discussion
Among a nationally representative sample of non-elderly US adults, individuals who reported methamphetamine use alone or reported both opioid and methamphetamine use were more likely to live in rural areas, have lower incomes, and be unstably housed compared to individuals who used opioids alone. Compared to individuals who used opioids alone, those who used methamphetamine alone were 6 times more likely to have HIV/AIDS and those who used both opioids and methamphetamine were almost 2 times more likely to have hepatitis B or C. SMI was particularly high among those who used both opioids and methamphetamine. These findings suggest that the public health response to the fourth wave of the opioid crisis, characterized by increasing morbidity and mortality due to use of both opioids and psychostimulants, will require treatment models that can reach a geographically diverse group of individuals with health and social needs that are more complex than in earlier waves of the crisis.
Injection needle use and other illicit drug use was higher among individuals who used both opioids and methamphetamine compared to those who used either substance alone, and may contribute to the unique health profiles we identified, including high rates of viral hepatitis. The rate of injection needle use was 132 % higher among those who used both opioids and methamphetamine compared to individuals who reported opioid use alone. Additionally, 68 % of individuals who use both opioids and methamphetamine reported past year heroin use. This finding adds to recent treatment admission data that highlighted rising rates of methamphetamine use among people who used heroin, and rising rates of methamphetamine injection (Jones et al., 2020, 2019).
In addition to viral hepatitis, individuals who used any methamphetamine were at the highest risk of having been diagnosed with a STI or HIV/AIDS, consistent with prior literature that methamphetamine is associated with higher levels of risky sexual behavior (Hittner, 2016; Kidd, 2019). Elevated rates of HIV-related risk behaviors suggest evidence-based harm reduction strategies, like syringe exchange programs or supervised injection facilities, which have been employed in some jurisdictions to combat the opioid crisis, will continue to be critical tools in an era of rising methamphetamine use (Wodak and McLeod, 2008). Unlike medication for OUD, there is no effective pharmacologic treatment for methamphetamine use disorder. Although there are behavioral treatments available for methamphetamine use disorder, they are less efficacious than medication available for OUD (Phillips et al., 2014). This highlights the importance of prevention and harm reduction strategies in preventing the downstream health effects associated with methamphetamine use.
Thirty-two percent of individuals who reported use of both opioids and methamphetamine had a SMI, which was 55 % more than individuals who reported opioid use alone and 10 times higher compared with the general population (Winkelman et al., 2018b). Although previous work has demonstrated high levels of mental illness among individuals who use opioids or methamphetamine, our study quantifies rates of SMI among a nationally representative sample of people who use both opioids and methamphetamine and finds that rates of SMI are sharply higher in this population. To our knowledge, disability has not previously been measured among a cohort of people who use methamphetamine. We found high rates of disability across all drug use groups, ranging from 38 % to 42 %. Together, these findings suggest that in addition to a focus on harm reduction, the co-localization of mental health treatment with substance use treatment should be prioritized to reach a population with higher levels of disability than in previous waves of the opioid crisis.
This study has several limitations. First, questions related to opioid and methamphetamine use in the NSDUH were expanded in 2015, which precluded us from analyzing trends in the change of opioid and methamphetamine use prior to 2015. In addition, the cross-sectional design of the NSDUH precluded analysis of drug use initiation in relation to timing of health condition diagnosis. The self-reported responses in the NSDUH could potentially bias our results to the null if participants were unwilling to share or could not remember accurate drug use and health information. The NSDUH survey design addresses this by using Audio Computer Assisted Self-Interview Software to gather responses to sensitive questions. Finally, the NSDUH does not survey individuals who are homeless and unsheltered or those who are currently incarcerated. Because opioid and methamphetamine use is high among these populations, our estimates should be considered conservative estimates of the total burden of methamphetamine and opioid use across the United States.
5. Conclusion
Methamphetamine use alone or methamphetamine use with opioids was associated with higher levels of social disadvantage and more complex health profiles compared with opioid use alone. High levels of viral hepatitis among individuals who use methamphetamine suggest that harm reduction strategies, like syringe exchange programs and supervised injection sites, may help stem the high rates of infectious disease. As the opioid crisis enters a phase of rising methamphetamine use, health care services that accommodate individuals with high levels of mental illness and disability and are coordinated with substance use treatment services will be critical to meet the needs of an increasingly complex population.
Role of funding source
Riley Shearer was supported by NIH MSTP grant T32 GM008244.
Appendix A
Table A1.
Health characteristics by past drug use category – United States, 2015–2018.
| Characteristic | Weighted % (95 % CI) | ||
|---|---|---|---|
| Heroin use (N = 577) | Methamphetamine use (N = 1196) | Heroin and Methamphetamine use (N = 282) | |
| Weighted N | 595,000 (509,000–681,218) | 1,318,000 (1,209,000–1,427,000) | 276,000 (231,000–320,000) |
| Age of first heroin use | 25.9 (24.9–27.0) | NA | 26.4 (24.9–28.9) |
| Age of first methamphetamine use | NA | 23.1 (22.4–23.9) | 24.1 (22.5–25.6) |
| Fair/poor health | 27.5 (21.5–33.5) | 27.6 (24.1–31.1) | 29.0 (20.2–37.8) |
| Any infectious disease | 19.0 (14.3–23.7) | 16.5 (13.0–20.1) | 21.5 (15.5–27.5) |
| STI (past year) | 6.0 (3.7–8.3) | 8.9 (6.7–11.1) | 8.2 (4.1–12.2) |
| HIV/AIDS | 1.1 (−0.2–2.5) | 3.5 (1.6–5.4) | * |
| Hepatitis B or C | 14.7 (10.4–19.1) | 7.5 (4.7–10.4)a | 14.2 (9.4–19.0)c |
| Any respiratory disease | 12.7 (7.8–17.7) | 15.9 (13.3–18.5) | 18.2 (11.5–25.0) |
| Asthma | 6.0 (2.9–9.0) | 8.2 (6.6–9.8) | 7.3 (2.9–11.7) |
| COPD | 9.7 (5.0–14.4) | 10.1 (7.6–12.5) | 12.5 (6.6–18.4) |
| Any cardiovascular disease | 13.2 (8.5–17.9) | 16.8 (13.6–19.9) | 23.4 (15.8–31.0)c |
| Heart condition | 5.8 (2.5–9.2) | 7.7 (5.9–9.6) | 11.9 (5.0–18.8) |
| High blood pressure | 9.8 (5.3–14.2) | 12.2 (9.3–15.1) | 17.9 (10.4–25.4)b |
| Diabetes | 5.8 (2.8–8.9) | 6.4 (4.6–8.1) | 6.1 (1.3–10.9) |
| Kidney disease | 0.7 (−0.2–1.6) | 1.9 (0.7–3.1) | 0.7 (0.0–1.4) |
| Cancer | 1.9 (0.5–3.4) | 3.8 (2.0–5.7) | 1.7 (−0.1–3.6) |
| Chronic Conditions per 100 individuals | 53.8 (42.0–65.6) | 61.6 (54.5–68.6) | 72.0 (56.9–87.1) |
| Any disability | 36.5 (31.2–41.9) | 40.6 (36.3–44.8) | 40.5 (32.1–48.9) |
| Severe mental illness | 21.2 (15.7–26.6) | 22.8 (18.4–27.3) | 33.5 (24.9–42.1)b,c |
| Uninsured | 20.0 (15.6–24.4) | 24.5 (20.9–28.0) | 26.5 (17.3–35.7) |
All estimates are adjusted for age, sex, income, education, rural vs. urban residence, race/ethnicity, and housing instability in the past year.
Heroin use is defined as any past year heroin use. Methamphetamine use is defined as any past year methamphetamine use.
P≤.0.01 compared to “Heroin use”.
P≤.0.05 compared to “Heroin use”.
P≤.0.05 compared to “Methamphetamine use”.
Estimate did not pass NSDUH suppression requirements.
Table A2.
Sociodemographic characteristics of all adults aged 18 and older, by drug use category – United States, 2015–2018.
| Characteristic | Weighted % (95 % CI) | ||
|---|---|---|---|
| Opioid use (N = 1534) | Methamphetamine use (N = 1089) | Opioid and Methamphetamine use (N = 398) | |
| Weighted percentage | 52.5 (49.9–55.1) | 36.1 (34.0–38.3) | 11.4 (9.9–13.2) |
| Male | 60.2 (56.3–63.5) | 63.0 (59.3–66.6) | 63.8 (56.3–70.8) |
| Race/ethnicity | |||
| White | 70.5 (66.6–74.1) | 69.0 (64.9–72.8) | 84.0 (77.8–88.7) |
| African American | 12.7 (10.1–15.9) | 5.1 (3.6–7.3) | 2.3 (0.7–6.8) |
| Hispanic | 12.8 (10.3–15.9) | 18.4 (15.1–22.1) | 8.7 (5.3–13.9) |
| Other | 4.0 (3.0–5.4) | 7.5 (5.6–10.0) | 5.1 (3.2–8.0) |
| Age (years) | |||
| 18–25 | 18.5 (16.6–20.4) | 18.3 (16.1–20.8) | 23.9 (18.9–29.8) |
| 26–34 | 26.8 (24.5–29.2) | 25.2 (22.0–28.7) | 30.6 (24.8–37.1) |
| 35–49 | 25.1 (22.2–28.3) | 32.6 (29.3–36.1) | 26.9 (20.6–34.2) |
| 50–64 | 25.1 (21.1–29.6) | 21.3 (17.7–25.4) | 18.2 (12.0–26.8) |
| 65 + | 4.6 (2.9–7.1) | 2.5 (1.0–6.2) | 0.3 (0.0–2.3) |
| Incomea | |||
| < 100 % | 23.3 (20.4–26.5) | 33.0 (29.6–36.7) | 35.5 (28.7–42.8) |
| FPL | |||
| 100–200 % | 24.0 (21.2–27.0) | 26.3 (23.3–29.6) | 31.6 (25.2–38.8) |
| FPL | |||
| > 200 % | 52.7 (48.8–56.6) | 40.6 (37.1–44.2) | 32.9 (26.4–40.1) |
| FPL | |||
| Education level | |||
| Less than HS | 16.5 (13.8–19.5) | 25.8 (21.9–30.1) | 19.4 (14.1–26.0) |
| HS | 31.6 (27.9–35.6) | 33.5 (29.5–37.7) | 38.2 (31.3–45.6) |
| Some College | 36.7 (33.6–39.9) | 32.3 (28.2–36.6) | 32.9 (26.8–39.6) |
| College Grad | 15.2 (12.3–18.7) | 8.4 (6.0–11.6) | 9.5 (5.5–15.8) |
| Rural residence | 14.3 (12.2–16.6) | 20.8 (17.5–24.5) | 21.3 (16.4–27.2) |
| Unstably housedb | 7.6 (5.9–9.6) | 11.4 (9.2–14.1) | 15.5 (11.2–21.0) |
Opioid use is defined as any past year heroin use or misusing prescription pain relievers 4 or more times in the past month. Methamphetamine use is defined as any past year methamphetamine use.
FPL = federal poverty level.
3 or more moves in the past year.
Table A3.
Health characteristics of all adults aged 18 and older, by drug use category – United States, 2015–2018.
| Characteristic | Weighted % (95 % CI) | ||
|---|---|---|---|
| Opioid use (N = 1534) | Methamphetamine use (N = 1089) | Opioid and Methamphetamine use (N = 398) | |
| Fair/poor health | 29.4 (25.5–33.3) | 26.3 (22.3–30.2) | 32.6 (25.4–39.8) |
| Any infectious disease | 11.9 (9.8–14.0) | 17.5 (13.4–21.7)c | 22.9 (17.4–28.4)a |
| STI (past year) | 6.3 (5.0–7.7) | 8.9 (6.5–11.4)c | 9.6 (5.8–13.4)c |
| HIV/AIDS | 0.5 (0.0–1.0) | 4.1 (1.7–6.5)b | 1.1 (−0.5–2.6)c |
| Hepatitis B or C | 6.4 (4.6–8.1) | 8.5 (5.4–11.6) | 13.3 (9.5–17.3)a,d |
| Any respiratory disease | 11.8 (9.7–13.8) | 16.5 (13.6–19.4)b | 17.9 (12.1–23.7)c |
| Asthma | 7.3 (5.8–8.7) | 8.1 (6.5–9.7) | 7.3 (3.8–10.9) |
| COPD | 6.5 (5.0–8.0) | 10.3 (7.8–12.9)b | 12.8 (7.5–18.1)b |
| Any cardiovascular disease | 20.6 (16.9–24.2) | 19.4 (15.5–23.4) | 27.0 (20.3–33.8)d |
| Heart condition | 8.6 (6.2–11.0) | 9.3 (6.6–12.1) | 12.7 (6.3–19.2) |
| High blood pressure | 15.2 (12.0–18.4) | 14.2 (10.4–18.0) | 22.1 (16.0–28.2)c,d |
| Diabetes | 8.5 (6.5–10.6) | 8.2 (5.2–11.1) | 5.9 (1.7–10.2) |
| Kidney disease | 1.2 (0.5–1.9) | 2.5 (0.8–4.2) | 0.6 (0.0–1.1)d |
| Cancer | 2.5 (1.6–3.4) | 4.3 (1.7–6.8) | 4.2 (1.5–6.9) |
| Chronic Conditions per 100 individuals | 56.6 (49.7–63.5) | 70.1 (59.9–80.3)c | 81.0 (64.6–97.3)b |
| Any disability | 38.6 (34.9–42.4) | 39.8 (35.5–44.1) | 42.1 (35.5–48.7) |
| Severe mental illness | 20.3 (17.0–23.5) | 22.5 (17.6–27.5) | 31.6 (24.7–38.4)b |
| Uninsured | 20.6 (17.9–23.3) | 22.6 (19.3–25.9) | 24.9 (18.0–31.9) |
All estimates are adjusted for age, sex, income, education, rural vs. urban residence, race/ethnicity, and housing instability in the past year.
Opioid use is defined as any past year heroin use or misusing prescription pain relievers 4 or more times in the past month. Methamphetamine use is defined as any past year methamphetamine use.
P≤.0.001 compared to “Opioid use”.
P≤.0.01 compared to “Opioid use”.
P≤.0.05 compared to “Opioid use”.
P≤.0.05 compared to “Methamphetamine use”.
Footnotes
Declaration of Competing Interest
No conflict declared.
References
- Al-Tayyib A, Koester S, Langegger S, Raville L, 2017. Heroin and methamphetamine injection: an emerging drug use pattern. Subst. Use Misuse 52, 1051–1058. 10.1080/10826084.2016.1271432. [DOI] [PMC free article] [PubMed] [Google Scholar]
- Aspinall EJ, Nambiar D, Goldberg DJ, Hickman M, Weir A, Van Velzen E, Palmateer N, Doyle JS, Hellard ME, Hutchinson SJ, 2014. Are needle and syringe programmes associated with a reduction in HIV transmission among people who inject drugs: a systematic review and meta-analysis. Int. J. Epidemiol 43, 235–248. 10.1093/ije/dyt243. [DOI] [PubMed] [Google Scholar]
- Center for Behavioral Health Statistics and Quality, 2016. 2015 National Survey on Drug Use and Health: Summary of the Effects of the 2015 NSDUH Questionnaire Redesign: Implications for Data Users 44. [PubMed]
- Center for Behavioral Health Statistics and Quality, 2019a. 2018 National Survey on Drug Use and Health Public Use File Codebook. Substance Abuse and Mental Health Services Administration, pp. 869. [Google Scholar]
- Center for Behavioral Health Statistics and Quality, 2019b. 2018 National Survey on Drug Use and Health: Methodological Summary and Definitions. Substance Abuse and Mental Health Services Administration. [Google Scholar]
- Centers for Disease Control and Prevention, 2019. Determination of Need for Syringe Services Programs. CDC. [WWW Document]. URL https://www.cdc.gov/ssp/determination-of-need-for-ssp.html (accessed 9.12.19). [Google Scholar]
- Department of Health and Human Services, 2015. HHS Implementation Guidance on Data Collection Standards for Race, Ethnicity, Sex, Primary Language, and Disability Status. ASPE. [WWW Document]. URL https://aspe.hhs.gov/basic-report/hhs-implementation-guidance-data-collection-standards-race-ethnicity-sex-primary-language-and-disability-status (accessed 9.12.19). [Google Scholar]
- Edlund MJ, Forman-Hoffman VL, Winder CR, Heller DC, Kroutil LA, Lipari RN, Colpe LJ, 2015. Opioid abuse and depression in adolescents: results from the National Survey on Drug Use and Health. Drug Alcohol Depend. 152, 131–138. 10.1016/j.drugalcdep.2015.04.010. [DOI] [PubMed] [Google Scholar]
- Enos G, 2019. What’s old is new again: emergence of stimulants complicates picture. Alcohol. Drug Abus. Wkly 31, 1–7. 10.1002/adaw.32229. [DOI] [Google Scholar]
- Fazel S, Geddes JR, Kushel M, 2014. The health of homeless people in high-income countries: descriptive epidemiology, health consequences, and clinical and policy recommendations. Lancet 384, 1529–1540. 10.1016/S0140-6736(14)61132-6. [DOI] [PMC free article] [PubMed] [Google Scholar]
- Frederick TJ, Chwalek M, Hughes J, Karabanow J, Kidd S, 2014. How stable is stable? Defining and measuring Housing Stability. J. Community Psychol 42, 964–979. 10.1002/jcop.21665. [DOI] [Google Scholar]
- Gladden RM, O’Donnell J, Mattson CL, Seth P, 2019. Changes in opioid-involved overdose deaths by opioid type and presence of benzodiazepines, cocaine, and methamphetamine — 25 states, July–december 2017 to January–june 2018. MMWR Morb. Mortal. Wkly. Rep 68, 737–744. 10.15585/mmwr.mm6834a2. [DOI] [PMC free article] [PubMed] [Google Scholar]
- Hedegaard H, Minino A, Warner M, 2020. Drug Overdose Deaths in the United States. 1999–2018 (NCHS Data Brief No. 356). U.S. Department of Health and Human Services. [PubMed] [Google Scholar]
- Hittner JB, 2016. Meta-analysis of the association between methamphetamine use and high-risk sexual behavior among heterosexuals. Psychol. Addict. Behav 30, 147–157. 10.1037/adb0000162. [DOI] [PubMed] [Google Scholar]
- Ihongbe TO, Masho SW, 2016. Prevalence, correlates and patterns of heroin use among young adults in the United States. Addict. Behav 63, 74–81. 10.1016/j.addbeh.2016.07.003. [DOI] [PubMed] [Google Scholar]
- Jones CM, 2012. Frequency of prescription pain reliever nonmedical use: 2002–2003 and 2009–2010. Arch. Intern. Med 172, 1265–1267. 10.1001/archinternmed.2012.2533. [DOI] [PubMed] [Google Scholar]
- Jones CM, McCance-Katz EF, 2019. Co-occurring substance use and mental disorders among adults with opioid use disorder. Drug Alcohol Depend. 197, 78–82. 10.1016/j.drugalcdep.2018.12.030. [DOI] [PubMed] [Google Scholar]
- Jones CM, Underwood N, Compton W, 2019. Increases in methamphetamine use among heroin treatment admissions in the United States, 2008–2017. Addiction. 10.1111/add.14812. [DOI] [PMC free article] [PubMed] [Google Scholar]
- Jones CM, Olsen EO, O’Donnell J, Mustaquim D, 2020. Resurgent methamphetamine use at treatment admission in the United States, 2008–2017. Am. J. Public Health 110, 509–516. 10.2105/AJPH.2019.305527. [DOI] [PMC free article] [PubMed] [Google Scholar]
- Kariisa M, Scholl L, Wilson N, Seth P, Hoots B, 2019. Drug overdose deaths involving cocaine and psychostimulants with abuse potential — united States, 2003–2017. MMWR Morb. Mortal. Wkly. Rep 68, 388–395. 10.15585/mmwr.mm6817a3. [DOI] [PMC free article] [PubMed] [Google Scholar]
- Kidd SE, 2019. Increased methamphetamine, injection drug, and heroin use among women and heterosexual men with primary and secondary syphilis — united States, 2013–2017. MMWR Morb. Mortal. Wkly. Rep 68. 10.15585/mmwr.mm6806a4. [DOI] [PMC free article] [PubMed] [Google Scholar]
- Kral AH, Davidson PJ, 2017. Addressing the nation’s opioid epidemic: lessons from an unsanctioned supervised injection site in the U.S. Am. J. Prev. Med 53, 919–922. 10.1016/j.amepre.2017.06.010. [DOI] [PubMed] [Google Scholar]
- Lancet T, 2018. Opioids and methamphetamine: a tale of two crises. Lancet 391, 713. 10.1016/S0140-6736(18)30319-2. [DOI] [PubMed] [Google Scholar]
- Lankenau SE, Kecojevic A, Silva K, 2015. Associations between prescription opioid injection and Hepatitis C virus among young injection drug users. Drugs Abingdon Engl. (Abingdon Engl) 22, 35–42. 10.3109/09687637.2014.970515. [DOI] [PMC free article] [PubMed] [Google Scholar]
- Ma J, Bao Y-P, Wang R-J, Su M-F, Liu M-X, Li J-Q, Degenhardt L, Farrell M, Blow FC, Ilgen M, Shi J, Lu L, 2019. Effects of medication-assisted treatment on mortality among opioids users: a systematic review and meta-analysis. Mol. Psychiatry 24, 1868–1883. 10.1038/s41380-018-0094-5. [DOI] [PubMed] [Google Scholar]
- Mackesy-Amiti ME, Donenberg GR, Ouellet LJ, 2015. Prescription opioid misuse and mental health among young injection drug users. Am. J. Drug Alcohol Abuse 41, 100–106. 10.3109/00952990.2014.940424. [DOI] [PMC free article] [PubMed] [Google Scholar]
- National Institutes of Health, 2018. HEAL Initiative Research Plan [WWW Document]. National Institutes of Health (NIH). URL https://www.nih.gov/research-training/medical-research-initiatives/heal-initiative/heal-initiative-research-plan (accessed 8.15.19). [Google Scholar]
- Palamar JJ, Le A, Mateu-Gelabert P, 2018. Not just heroin: extensive polysubstance use among US high school seniors who currently use heroin. Drug Alcohol Depend. 188, 377–384. 10.1016/j.drugalcdep.2018.05.001. [DOI] [PMC free article] [PubMed] [Google Scholar]
- Phillips KA, Epstein DH, Preston KL, 2014. Psychostimulant addiction treatment. Neuropharmacology 87, 150–160. 10.1016/j.neuropharm.2014.04.002. [DOI] [PMC free article] [PubMed] [Google Scholar]
- Ruhm CJ, 2019. Nonopioid overdose death rates rose almost as fast as those involving opioids, 1999–2016. Health Aff. 38, 1216–1224. 10.1377/hlthaff.2018.05522. [DOI] [PubMed] [Google Scholar]
- Schepis TS, De Nadai AS, Ford JA, McCabe SE, 2020. Prescription opioid misuse motive latent classes: outcomes from a nationally representative US sample. Epidemiol. Psychiatr. Sci 29, e97. 10.1017/S2045796020000037. [DOI] [PMC free article] [PubMed] [Google Scholar]
- Winkelman TNA, Admon LK, Jennings L, Shippee ND, Richardson CR, Bart G, 2018a. Evaluation of amphetamine-related hospitalizations and associated clinical outcomes and costs in the United States. JAMA. 10.1001/jamanetworkopen.2018.3758. Netw Open 1. [DOI] [PMC free article] [PubMed] [Google Scholar]
- Winkelman TNA, Chang VW, Binswanger IA, 2018b. Health, polysubstance use, and criminal justice involvement among adults with varying levels of opioid use. JAMA Netw Open 1 10.1001/jamanetworkopen.2018.0558. e180558–e180558. [DOI] [PMC free article] [PubMed] [Google Scholar]
- Wishner J, Clemans-Cope L, Marks J, Epstein M, 2018. Implementing an Integrated Medication-assisted Treatment Program at Community Health Centers: Lessons From a Pilot Projet in California. Urban Institute. [Google Scholar]
- Wodak A, McLeod L, 2008. The role of harm reduction in controlling HIV among injecting drug users. AIDS 22, S81–S92. 10.1097/01.aids.0000327439.20914.33. [DOI] [PMC free article] [PubMed] [Google Scholar]
- Wu L-T, Pilowsky DJ, Schlenger WE, Galvin DM, 2007. Misuse of methamphetamine and prescription stimulants among youths and young adults in the community. Drug Alcohol Depend. 89, 195–205. 10.1016/j.drugalcdep.2006.12.020. [DOI] [PMC free article] [PubMed] [Google Scholar]