

Abstract
Introduction:
Structural racism has attracted increasing interest as an explanation for racial disparities in health, including differences in adiposity. Structural racism has been measured most often with single-indicator proxies (e.g., housing discrimination), which may leave important aspects of structural racism unaccounted for. This paper develops a multi-indicator scale measuring county structural racism in the U.S. and evaluates its association with BMI.
Methods:
County structural racism was estimated with a confirmatory factor model including indicators reflecting education, housing, employment, criminal justice, and health care. Using Behavioral Risk Factor Surveillance Survey data (2011–2012) and a mixed-effects model, individual BMI was regressed on county structural racism, controlling for county characteristics (mean age, percentage black, percentage female, percentage rural, median income, and region). Analysis occurred 2017–2019.
Results:
The study included 324,572 U.S. adults. A 7-indicator county structural racism model demonstrated acceptable fit. County structural racism was associated with lower BMI. Structural racism and black race exhibited a qualitative interaction with BMI, such that racism was associated with lower BMI in whites and higher BMI in blacks. In a further interaction analysis, county structural racism was associated with larger increases in BMI among black men than black women. County structural racism was associated with reduced BMI for white men and no change for white women.
Conclusions:
The results confirm structural racism as a latent construct and demonstrate that structural racism can be measured in U.S. counties using publicly available data with methods offering a strong conceptual underpinning and content validity. Further study is necessary to determine whether addressing structural racism may reduce BMI among blacks.
INTRODUCTION
During the course of 3 decades, U.S. obesity prevalence more than doubled to 39.6% in 2016.1,2 Flegal et al.3 attribute 5% of U.S. all-cause mortality to overweight and obesity. Individual race is a potentially important correlate of BMI and obesity. In 2012, obesity prevalence was 32.6% in white non-Hispanics and 47.8% in black non-Hispanics.4 Ailshire and House5 found that BMI trajectories were ordered by social disadvantage, with educated white men having the lowest growth trajectory and uneducated black women the highest.
That racism may be responsible for health disparities by race has been discussed for decades and has attracted increased interest from researchers in recent years.6,7 In the context of BMI, a major focus has been interpersonal racism, defined as differential actions toward or assumptions about the abilities of people according to their race.8 Another line of research has evaluated the link between BMI and structural racism, defined as institutional policies and actions that result in detrimental treatment for members of a particular racial group.9 This detrimental treatment may arise from policies that are discriminatory, as well as those that are not overtly discriminatory but nonetheless create disparate outcomes by race.6
Mechanisms linking structural racism and health disparities are numerous and interlocking. Some10 have argued that structural racism constitutes a fundamental cause of health disparities, meaning that it is linked to health outcomes by a variety of mechanisms that change over time and function by providing whites preferential access to the resources, such as prestige, money, and knowledge, required to secure better health outcomes. In the context of obesity, this dynamic is seen in black/white differences in knowledge of healthy eating practices11 and in discriminatory housing policies that segregate blacks into neighborhoods providing reduced access to quality food outlets12 and opportunities for physical activity.13 Other investigators have focused on more proximal mechanisms by which racism may result in health differences for blacks, such as the process of weathering, in which blacks are exposed to social and environmental stressors that result in chronic inflammation and subsequent disease.14,15
Structural racism is frequently thought of as a construct involving discriminatory practices or racial inequities in multiple domains,6,16 often including housing, education, health, criminal justice, and employment. To date, research on adiposity has focused on individual components of structural racism, rather than on measures that account for the complex, multidimensional nature of structural racism. For example, Chang and colleagues17 reported a positive association between housing segregation and BMI among women. Bower et al.18 reported a 6% increase in the odds of obesity for black women with each 1-unit increase in the black isolation index, a measure of residential segregation. They found that the isolation index was protective for white women and did not evaluate this association for men. Similarly, Kershaw and colleagues19 reported that the highest levels of the neighborhood isolation index were associated with a 29% increase in the prevalence of obesity for black women. For black men, there was no association between obesity and the isolation index. More recently, Pool et al.20 found that residence in the most highly segregated neighborhoods was associated with a 30% elevated risk of incident obesity for black women.
Research on structural racism beyond segregation is sparse. An ecological study by Bell and colleagues21 found that indicators of structural racism at the county level, such as racial inequality in homeownership, unemployment, and poverty, were associated with higher county obesity prevalence, although the relationships were mixed after stratifying for the proportion of county residents identifying as black. Piontak and Schulman22 found a positive association between school segregation and childhood obesity BMI. Houle23 reported a similar finding with regard to male incarceration and BMI, along with a positive interaction between black race and incarceration on BMI.
Although residential segregation is an important component of structural racism, it is clear that a model relying on segregation as the lone indicator of structural racism would be incomplete. Thus, this paper develops a 5-domain scale measuring structural racism at the county level and employs this scale to evaluate the relationship between structural racism and BMI. This approach provides, to the authors’ knowledge, the first assessment of the association between BMI and structural racism using a measurement instrument that is robust to measurement error and accounts for the relevant domains of structural racism.
A scale measuring structural racism could evaluate differences between whites and all minorities or between whites and a specific minority group. Williams and Williams-Morris24 note that blacks in the U.S., beginning in the slavery era, have been subjected to a level of structural and interpersonal racism that far exceeds that experienced by members of other minority groups. Thus, this paper measures white versus black county structural racism (CSR). However, these methods could be adapted to other forms of structural racism.
This paper tests the hypothesis, based on the fundamental cause theory discussed earlier, that structural racism is associated with lower BMI in whites and higher BMI in blacks—a pattern of relationships known as a qualitative or crossover interaction. Based on this dynamic and the comparatively larger population of whites in the U.S. population, it is hypothesized that structural racism is negatively associated with BMI across the counties.
METHODS
Study Sample
This research relied on publicly available data and was deemed exempt from review by the Johns Hopkins Bloomberg School of Public Health IRB. Self-reported height, weight, and race data were obtained from the 2011 and 2012 Behavioral Risk Factor Surveillance System (BRFSS).25 The combined 2011–2012 data set covered 2,500 of the 3,143 counties in the country. The missing counties arose because of a Centers for Disease Control and Prevention policy that suppresses records from counties with <11 respondents. The analysis used the preferred race supplied by the respondent. The study used BRFSS data from 2011 and 2012 because the Centers for Disease Control and Prevention restricted access to county identifiers for BRFSS respondents in 2013. The analysis included 2 years of data to enhance sample size.
Measures
Selection of content domains relevant to structural racism has been considered previously in 2 papers.6,16 One, focused on discrimination rather than structural racism, suggested 5 domains: housing, education, employment, health care, and criminal justice.16 Although this framework was developed in the context of discrimination, it was deemed relevant to this study because structural racism is an underlying construct that manifests in institutional policies discriminating against blacks. The second paper6 mentioned 9 areas: the 5 listed earlier, along with benefits, credit, earnings, and media. Because benefits, credit, and earnings are strongly connected to employment, and there was no readily available methodology for measuring CSR in media, the following analysis was based on the 5-domain model.
There are well-established single-domain measures of discrimination at the area level,26 which are often employed in housing and education studies. Broadly, housing and education discrimination indicators evaluate the degree to which units (Census tracts or schools) within a county mirror the racial composition of the county.
Area-level discrimination in employment, criminal justice, and health care has been less closely studied. Multiple indicators of differential treatment by race were evaluated, with modeling diagnostics guiding selection of the most informative indicators. These indicators, with few exceptions, are prevalence ratios: Pw=1/Pb=1, where Pw=1 is the proportion of whites in a county experiencing an event and Pb=1 is the proportion of blacks experiencing the event. Derivation of the CSR scale relied primarily on U.S. Census Bureau survey data and community-level data collected for administrative reasons.
This study estimated CSR using confirmatory factor analysis, which minimizes the effect of random measurement error and empirically determines the degree to which each indicator is weighted in the composite estimate. A series of models containing combinations of at least one candidate indicator per domain was fit and model fit evaluated using tests and cut points recommended in the literature. Development of indicators and the final measurement scale is described in detail in the Appendix Text, available online.
The BRFSS sampling strategy yields state-level estimates for health characteristics addressed in the survey. By contrast, this study’s target population was U.S. adults residing in counties included in BRFSS and CSR factor analysis. There are no survey weights available for this target population. Following the approach to small area estimation outlined by Zhang et al.,27 the analysis was conducted without survey weights.
Because the data were clustered and included a small number of respondents in some counties, multilevel linear regression models with a county-level random intercept were specified. These yield valid standard errors when fit to nonindependent data and employ a shrinkage estimator that limits random error owing to small sample size. Because the main focus of the analysis was the interaction between individual variables (indicators for black race and female sex) and CSR (a county-level variable) after controlling for county-level confounders, the specified models included the county mean of the individual variables (i.e., the proportion of black and female residents in each county). The individual indicators for black race and female sex were included in the models as centered variables, centered at the county mean.28 Age was considered as a potential confounder at both the county and individual levels.
The following 5 models were fit: (1) Model A, which regressed BMI against CSR; (2) Model B, which added county proportion of black residents, centered black race, county proportion of female residents, centered female sex, county mean age, and centered age; (3) Model C, which tested the sensitivity of the results in Model B to 3 potential macro-level confounders—percentage of county residents living in a rural area, median county income, and Census region; (4) Model D, which added a 2-way interaction term for CSR and race; and (5) Model E, which added a 3-way interaction term for individual race, sex, and CSR.
A test for a qualitative interaction between CSR and black race was conducted using the results from Model D. The test for qualitative interaction across 2 subgroups of interest gauges whether the lower bound of the 90% CI for the exposure effect is >0 in one subgroup and the upper bound of effect in the other subgroup is <0.29 Data were analyzed 2017–2019 with Stata, version 15 and Mplus, version 7.4.
RESULTS
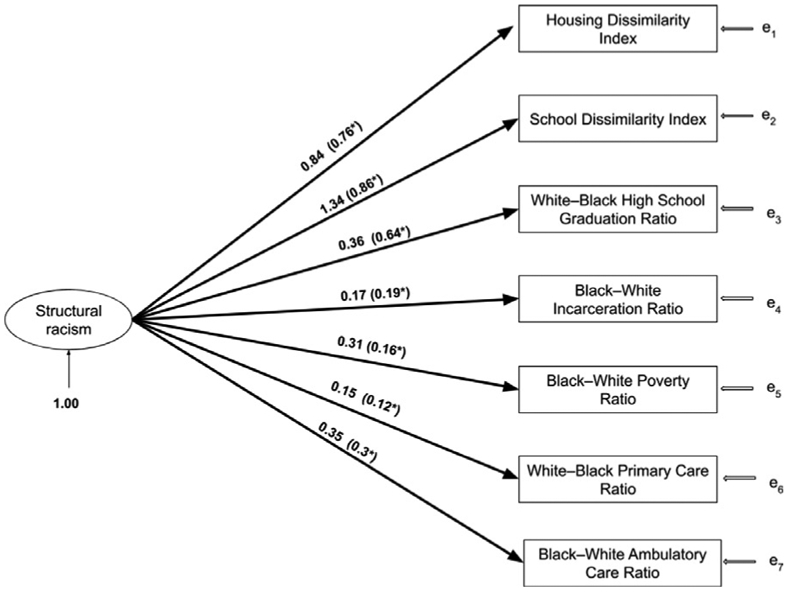
The CSR factor analysis resulted in a final model with acceptable fit statistics and 7 indicators (Figure 1), including at least 1 indicator from each of the 5 content domains. Further details on this model are provided in the Appendix Text, available online. The study population included 324,572 respondents who met inclusion criteria and lived in a county that received a CSR factor score (Table 1). Respondents from roughly half of U.S. counties (1,563 of 3,142) were included in the analysis (Figure 2, Appendix Figure 1, available online).
Figure 1.

County structural racism measurement model. The figure shows unstandardized loadings for each item, followed by standardized loadings in parentheses. Standardized loadings significant at the p<0.05 level are noted with an asterisk.
Table 1.
Characteristics of BRFSS Respondents by BMI Category
| Characteristics | Normal weight | Overweight | Obese | p-value |
|---|---|---|---|---|
| n | 114,139 | 113,889 | 96,544 | |
| Sex | <0.001 | |||
| Male, % | 32.8 | 52.8 | 43.3 | |
| Female, % | 67.2 | 47.2 | 56.7 | |
| Age, mean (SD) | 42.5(12.3) | 45.3 (11.0) | 46.0 (10.6) | <0.001 |
| Race | <0.001 | |||
| White, % | 90.7 | 86.7 | 79.7 | |
| Black, % | 9.3 | 13.3 | 20.3 | |
| County structural racism, mean (SD) | 0.032 (0.992) | 0.006 (0.991) | −0.006 (1.01) | <0.001 |
Note: Boldface indicates statistical significance (p<0.05).
BRFSS, Behavioral Risk Factor Surveillance Survey.
Figure 2.
Choropleth map of county structural racism scores.
Regression results are shown in Table 2. In Model A, a 1-SD difference in CSR was associated with a BMI decrease of 0.153 (95% CI=0.226, 0.080) kg/m2. In Model B, the CSR coefficient moved slightly away from the null. County mean age was associated with a BMI increase of 0.102 (95% CI=0.083, 0.121) kg/m2. A change of 10 points in the proportion of female residents in the county was associated with a BMI increase of 0.496 (95% CI=0.379, 0.614), whereas female sex was associated with a BMI decrease of 0.729 (95% CI=0.770, 0.687) kg/m2. A change of 10 units in the proportion of black county residents was associated with a BMI increase of 0.298 (95% CI=0.259, 0.337) kg/m2, and black race was associated with a BMI increase of 2.591 (95% CI=2.524, 2.657) kg/m2.
Table 2.
BMI Regression Coefficients (95% CI)
| Characteristic | Model A, regression coefficient (95% CI) |
Model B, regression coefficient (95% CI) |
Model C, regression coefficient (95% CI) |
Model D, regression coefficient (95% CI) |
Model E, regression coefficient (95% CI) |
|---|---|---|---|---|---|
| County variables | |||||
| CSR | −0.153 (−0.226, −0.080) | −0.214 (−0.275, −0.153) | −0.057 (−0.117, 0.002) | −0.065 (−0.125, −0.005) | −0.062 (−0.122, −0.002) |
| Age (mean) | — | 0.102 (0.083, 0.121) | 0.043 (0.026, 0.059) | 0.043 (0.027, 0.060) | 0.043 (0.026, 0.059) |
| % female | — | 0.496 (0.379, 0.614) | 0.267 (0.162, 0.372) | 0.267 (0.163, 0.372) | 0.268 (0.163, 0.372) |
| % black | — | 0.298 (0.259, 0.337) | 0.211 (0.174, 0.247) | 0.213 (0.177, 0.250) | 0.197 (0.161, 0.234) |
| Northeast region (ref) | — | — | 0.000 (0.000, 0.000) | 0.000 (0.000, 0.000) | 0.000 (0.000, 0.000) |
| Midwest region | — | — | 0.357 (0.217, 0.498) | 0.357 (0.216, 0.498) | 0.356 (0.215, 0.497) |
| South region | — | — | 0.128 (−0.012, 0.269) | 0.127 (−0.014, 0.268) | 0.124 (−0.017, 0.265) |
| West region | — | — | −0.307 (−0.474, −0.139) | −0.309 (−0.476, −0.142) | −0.302 (−0.470, −0.134) |
| Median income, $10,000 | — | — | −0.250 (−0.286, −0.214) | −0.250 (−0.286, −0.214) | −0.250 (−0.286, −0.215) |
| % rural | — | — | 0.011 (0.009, 0.014) | 0.011 (0.009, 0.014) | 0.012 (0.009, 0.014) |
| Individual variablesa | |||||
| Black | — | 2.591 (2.524, 2.657) | 2.591 (2.525, 2.658) | 2.347 (2.255, 2.439) | 2.374 (2.282, 2.466) |
| Age | — | 0.064 (0.062, 0.066) | 0.064 (0.063, 0.066) | 0.064 (0.063, 0.066) | 0.065 (0.063, 0.067) |
| Female | — | −0.729 (−0.770, −0.687) | −0.729 (−0.770, −0.687) | −0.731 (−0.772, −0.689) | −0.818 (−0.869, −0.766) |
| Interactions | |||||
| CSR X black | — | — | — | 0.253 (0.187, 0.318) | 0.242 (0.176, 0.307) |
| CSR X female | — | — | — | — | 0.085 (0.038, 0.132) |
| Black X female | — | — | — | — | 2.917 (2.728, 3.107) |
| CSR x black x female | — | — | — | — | −0.030 (−0.165, 0.106) |
| Constant | 28.495 | 20.031 | 25.515 | 25.505 | 25.532 |
All individual variables were centered on the county mean.
CSR, county structural racism.
In Model C, an increase of $10,000 in county median income was associated with a BMI decrease of 0.250 (95% CI=0.286, 0.214) kg/m2, whereas an increase in the percentage of county residents living in a rural area was associated with a BMI increase of 0.011 (95% CI=0.009, 0.014) kg/m2. Compared with the Northeast, residence in the Midwest and South was associated with small increases in BMI, whereas residence in the West region was associated with a modest drop in BMI. The association between BMI and other county-level confounders (mean age, proportion black, and proportion female) fell modestly.
In Model D, the coefficient for interaction between CSR and black race was 0.253 (95% CI=0.187, 0.318) kg/m2. For whites, a 1-unit increase in CSR was associated with a BMI change of −0.065 (95% CI= −0.125, −0.005) kg/m2. For blacks, a 1-unit increase in CSR was associated with a BMI change of 0.188 (95% CI=0.101, 0.275) kg/m2. The test for qualitative interaction was conducted at the 90% confidence level and thus resulted in narrower CIs. The upper bound of the white CI remained <0 and the lower bound of the black CI remained >0, which indicates a modest but statistically significant crossover interaction of black race and CSR, in that CSR is associated with lower BMI for whites and higher BMI for blacks.
Model E evaluated interaction between black race, female sex, and CSR. Coefficients for county covariates remained stable in this model. For male whites, a 1-unit increase in CSR was associated with a BMI change of −0.062 (95% CI= −0.122, −0.002) kg/m2. For female whites, a 1-unit increase was associated with a BMI change of 0.023 (95% CI= −0.054, 0.100) kg/m2. For male blacks, a 1-unit increase was associated with a BMI change of 0.180 (95% CI=0.093, 0.267) kg/m2. For female blacks, a 1-unit increase was associated with a BMI change of 0.235 (95% CI=0.070, 0.401) kg/m2.
DISCUSSION
The initial hypotheses about the relationship of structural racism to BMI were largely confirmed, in that CSR was associated with reduced BMI for whites and increased BMI for blacks. Results of the race X sex interaction indicate that this association was stronger for black women than for black men. For whites, CSR was associated with lower BMI for men and no significant change in BMI for women. As expected, CSR was associated with higher BMI in the full population. The findings are broadly consistent with earlier literature, which supports the association of residential segregation with obesity. The effect sizes reported here are not directly comparable to earlier studies owing to differences in geographic scale and outcome specification (earlier studies generally evaluated obesity, whereas this study analyzed BMI).
The findings reported here advance the existing literature in a number of ways. First, the study broadens the domains in which structural racism is assessed. As mentioned, earlier work primarily focused on residential segregation, whereas the CSR scale also considers the domains of employment, education, health care, and criminal justice. Other studies investigating these domains are either ecological in nature21 or conducted on much smaller populations.22,23
This study also relies on a dependent variable (BMI) that is less influenced by measurement error than obesity classification derived from BMI, which has been the focus of prior studies. Additionally, this study evaluated multiple indicators for each domain of CSR and identified those most relevant to the underlying construct of structural racism. The modeling process also took advantage of statistical methodology that minimized the effect of measurement error and verified that the selected model fit adequately to the data. Finally, this paper links an underlying theory (racism as a fundamental cause of disparities) with a hypothesized quantitative relationship (a crossover interaction of race with CSR) and tested this relationship using appropriate inferential methods. This study appears, to the authors’ knowledge, to be the first to evaluate the relationship among black race, structural racism, and a health outcome using a measurement scale for structural racism at the county level.
Limitations
One limitation of this study is that although confirmatory factor modeling is robust to the presence of random measurement error in 1 or more indicators,30 the method and related fit statistics do not address the question of construct validity (i.e., the degree to which the factor model represents the latent variable it attempts to measure). This is typically assessed using additional analytic techniques that are beyond the scope of this paper. Similarly, it is possible that the scale measures CSR more accurately for certain types of counties (for example, urban ones or those with a higher proportion of black residents). To the extent that this measurement error is correlated with BMI and uncontrolled in the CSR regression models, it would represent a source of confounding.
Another potential limitation of this study is reliance on self-reported BMI. However, investigators evaluating self-reported BMI and technician-measured BMI in data from the National Health and Nutrition Examination Survey reported a correlation of 0.95 in white participants and 0.93 in black participants.31 Thus, it is unlikely that differential measurement error by race is driving a qualitative change in the results.
An additional limitation is the study’s cross-sectional nature. CSR measurements were taken at one point in time, which in effect assumes that the CSR of a subject’s current county of residence is the CSR they have always been exposed to. In reality, subjects move between counties, and counties may experience changes in CSR over time. CSR may have lagged effects, effects that persist and accumulate across generations, and effects that vary over the life course, but this could not be evaluated with the data used in this study. One limitation commonly cited in cross-sectional studies—reverse causation—is less of a concern here. It is unlikely that individual BMI is a cause of CSR or of the interaction between race and structural racism.
CONCLUSIONS
In terms of public health significance, these findings suggest that interventions to ameliorate structural racism could help blacks to achieve a healthier BMI. However, more research is required to understand whether the relationship between CSR and BMI is causal and to characterize the health significance of CSR more fully in terms of duration of exposure, sensitive periods in the life course, and potential lag between exposure and impact on BMI. The results indicate that CSR has a significant association with BMI for black men, white men, and black women, but not white women. This finding warrants further examination. The finding that CSR is generally associated with lower BMI raises the question of how interventions might be structured so that they reduce CSR and black/white BMI disparities without increasing BMI in other populations. An additional question involves the stronger association of CSR with BMI for black women than black men. Further research is necessary to understand the significance of this finding and to determine whether a similar dynamic applies to other health outcomes. Finally, this paper develops a methodologically robust measurement scale estimating CSR for most U.S. counties. The scale may be used by other researchers to further understand the relationship between structural racism and a variety of health outcomes.
Supplementary Material
ACKNOWLEDGMENTS
Support to Dr. Dougherty was provided by the Clinical Research and Epidemiology in Diabetes and Endocrinology Training Grant (T32DK062707). Dr. Dean’s effort was supported by the National Cancer Institute (grant K01CA184288), the National Institute of Mental Health (grant R25MH08362), the Sidney Kimmel Cancer Center (grant P30CA006973), and the Johns Hopkins University Center for AIDS Research (grant P30AI094189).
Dougherty is an employee of the Maryland Health Services Cost Review Commission and a consultant to U.S. News & World Report. No other financial disclosures were reported by the authors of this paper.
The authors acknowledge assistance provided by Dr. Thomas A. Glass.
Footnotes
SUPPLEMENTAL MATERIAL
Supplemental materials associated with this article can be found in the online version at https://doi.org/10.1016/j.amepre.2020.05.019.
REFERENCES
- 1.Fryar CD, Carroll MD, Ogden CL. Prevalence of overweight, obesity, and extreme obesity among adults: United States, trends 1960–1962 through 2009–2010. www.cdc.gov/nchs/data/hestat/obesity_adult_09_10/obesity_adult_09_10.htm. Published 2012. Accessed May 14, 2020.
- 2.Hales CM, Fryar CD, Carroll MD, Freedman DS, Ogden CL. Trends in obesity and severe obesity prevalence in U.S. youth and adults by sex and age, 2007–2008 to 2015–2016. JAMA. 2018;319(16):1723–1725. 10.1001/jama.2018.3060. [DOI] [PMC free article] [PubMed] [Google Scholar]
- 3.Flegal KM, Panagiotou OA, Graubard BI. Estimating population attributable fractions to quantify the health burden of obesity. Ann Epidemiol. 2015;25(3):201–207. 10.1016/j.annepidem.2014.11.010. [DOI] [PMC free article] [PubMed] [Google Scholar]
- 4.Ogden CL, Carroll MD, Kit BK, Flegal KM. Prevalence of childhood and adult obesity in the United States, 2011–2012. JAMA. 2014;311 (8):806–814. 10.1001/jama.2014.732. [DOI] [PMC free article] [PubMed] [Google Scholar]
- 5.Ailshire JA, House JS. The unequal burden of weight gain: an intersectional approach to understanding social disparities in BMI trajectories from 1986 to 2001/2002. Soc Forces. 2011;90(2):397–423. 10.1093/sf/sor001. [DOI] [PMC free article] [PubMed] [Google Scholar]
- 6.Bailey ZD, Krieger N, Aénor M, Graves J, Linos N, Bassett MT. Structural racism and health inequities in the USA: evidence and interventions. Lancet. 2017;389(10077):1453–1463. 10.1016/S0140-6736(17)30569-X. [DOI] [PubMed] [Google Scholar]
- 7.Hicken MT, Kravitz-Wirtz N, Durkee M, Jackson JS. Racial inequalities in health: framing future research. Soc Sci Med. 2018;199:11–18. 10.1016/j.socscimed.2017.12.027. [DOI] [PMC free article] [PubMed] [Google Scholar]
- 8.Jones CP. Levels of racism: a theoretic framework and a gardener’s tale. Am J Public Health. 2000;90(8):1212–1215. 10.2105/ajph.90.8.1212. [DOI] [PMC free article] [PubMed] [Google Scholar]
- 9.Gee GC, Ford CL. Structural racism and health inequities: old issues, new directions. Du Bois Rev. 2011;8(1):115–132. 10.1017/S1742058X11000130. [DOI] [PMC free article] [PubMed] [Google Scholar]
- 10.Phelan JC, Link BG. Is racism a fundamental cause of inequalities in health. Annu Rev Sociol 2015;41(1):311–330. 10.1146/annurev-soc-073014-112305. [DOI] [Google Scholar]
- 11.Variyam JN, Blaylock J, Lin B-H, Ralston K, Smallwood D. Mother’s nutrition knowledge and children’s dietary intakes. Am J Agric Econ. 1999;81(2):373–384. 10.2307/1244588. [DOI] [Google Scholar]
- 12.Bower KM, Thorpe RJ Jr, Rohde C, Gaskin DJ. The intersection of neighborhood racial segregation, poverty, and urbanicity and its impact on food store availability in the United States. Prev Med. 2014;58:33–39. 10.1016/j.ypmed.2013.10.010. [DOI] [PMC free article] [PubMed] [Google Scholar]
- 13.Powell LM, Slater S, Chaloupka FJ, Harper D. Availability of physical activity-related facilities and neighborhood demographic and socioeconomic characteristics: a national study. Am J Public Health. 2006;96(9):1676–1680. 10.2105/AJPH.2005.065573. [DOI] [PMC free article] [PubMed] [Google Scholar]
- 14.Geronimus AT. Black/white differences in the relationship of maternal age to birthweight: a population-based test of the weathering hypothesis. Soc Sci Med. 1996;42(4):589–597. 10.1016/0277-9536(95)00159-X. [DOI] [PubMed] [Google Scholar]
- 15.Simons RL, Lei MK, Beach SRH, et al. Discrimination, segregation, and chronic inflammation: testing the weathering explanation for the poor health of black Americans. Dev Psychol. 2018;54(10):1993–2006. 10.1037/dev0000511. [DOI] [PMC free article] [PubMed] [Google Scholar]
- 16.National Research Council. Measuring racial discrimination. Washington, DC: National Academies Press; 2004. 10.17226/10887. [DOI] [Google Scholar]
- 17.Chang VW, Hillier AE, Mehta NK. Neighborhood racial isolation, disorder and obesity. Soc Forces. 2009;87(4):2063–2092. 10.1353/sof.0.0188. [DOI] [PMC free article] [PubMed] [Google Scholar]
- 18.Bower KM, Thorpe RJ Jr, Yenokyan G, McGinty EE, Dubay L, Gaskin DJ. Racial residential segregation and disparities in obesity among women. J Urban Health. 2015;92(5):843–852. 10.1007/s11524-015-9974-z. [DOI] [PMC free article] [PubMed] [Google Scholar]
- 19.Kershaw KN, Albrecht SS, Carnethon MR. Racial and ethnic residential segregation, the neighborhood socioeconomic environment, and obesity among blacks and Mexican Americans. Am J Epidemiol. 2013;177(4):299–309. 10.1093/aje/kws372. [DOI] [PMC free article] [PubMed] [Google Scholar]
- 20.Pool LR, Carnethon MR, Goff DC Jr, Gordon-Larsen P, Robinson WR, Kershaw KN. Longitudinal associations of neighborhood-level racial residential segregation with obesity among blacks. Epidemiology. 2018;29(2):207–214. 10.1097/EDE.0000000000000792. [DOI] [PubMed] [Google Scholar]
- 21.Bell CN, Kerr J, Young JL. Associations between obesity, obesogenic environments, and structural racism vary by county-level racial composition. Int J Environ Res Public Health. 2019;16(5):861. 10.3390/ijerph16050861. [DOI] [PMC free article] [PubMed] [Google Scholar]
- 22.Piontak JR, Schulman MD. School context matters: the impacts of concentrated poverty and racial segregation on childhood obesity. J Sch Health. 2016;86(12):864–872. 10.1111/josh.12458. [DOI] [PubMed] [Google Scholar]
- 23.Houle B The effect of incarceration on adult male BMI trajectories, United States, 1981–2006. J Racial Ethn Health Disparities. 2014;1 (1):21–28. 10.1007/s40615-013-0003-1. [DOI] [PMC free article] [PubMed] [Google Scholar]
- 24.Williams DR, Williams-Morris R. Racism and mental health: the African American experience. Ethn Health. 2000;5(3–4):243–268. 10.1080/713667453. [DOI] [PubMed] [Google Scholar]
- 25.Centers for Disease Control and Prevention. Overview: BRFSS 2012. www.cdc.gov/brfss/annual_data/2012/pdf/overview_2012.pdf.
- 26.Massey DS, Denton NA. The dimensions of residential segregation. Soc Forces. 1988;67(2):281–315. 10.2307/2579183. [DOI] [Google Scholar]
- 27.Zhang X, Holt JB, Yun S, Lu H, Greenlund KJ, Croft JB. Validation of multilevel regression and poststratification methodology for small area estimation of health indicators from the Behavioral Risk Factor Surveillance System. Am J Epidemiol. 2015;182(2):127–137. 10.1093/aje/kwv002. [DOI] [PMC free article] [PubMed] [Google Scholar]
- 28.Enders CK, Tofighi D. Centering predictor variables in cross-sectional multilevel models: a new look at an old issue. Psychol Methods. 2007; 12(2):121–138. 10.1037/1082-989X.12.2.121. [DOI] [PubMed] [Google Scholar]
- 29.VanderWeele TJ, Knol MJ. A tutorial on interaction. Epidemiol Method. 2014;3(1):33–72. 10.1515/em-2013-0005. [DOI] [Google Scholar]
- 30.Gallagher MW, Brown TA. Introduction to confirmatory factor analysis and structural equation modeling. In: Teo T, editor. Handbook of Quantitative Methods for Educational Research. Rotterdam, Netherlands: Sense Publishers, 2013:287–314. 10.1007/978-94-6209-404-8_14. [DOI] [Google Scholar]
- 31.McAdams MA, Van Dam RM, Hu FB. Comparison of self-reported and measured BMI as correlates of disease markers in U.S. adults. Obesity. 2007;15(1):188–196. 10.1038/oby.2007.504. [DOI] [PubMed] [Google Scholar]
Associated Data
This section collects any data citations, data availability statements, or supplementary materials included in this article.