Abstract
The basic physics of sound waves enables ultrasound to visualize biological tissues with high spatial and temporal resolution. Recently, this capability was enhanced with the development of acoustic biomolecules – proteins with physical properties enabling them to scatter sound. The expression of these unique air-filled proteins, known as gas vesicles (GVs), in cells allows ultrasound to image cellular functions such as gene expression in vivo, providing ultrasound with its analog of optical fluorescent proteins. Acoustical methods for the in vivo detection of GVs are now required to maximize the impact of this technology in biology and medicine. We previously engineered GVs exhibiting a nonlinear scattering behavior in response to acoustic pressures above 300 kPa, and showed that amplitude-modulated (AM) ultrasound pulse sequences that both excite the linear and nonlinear GV scattering regimes were highly effective at distinguishing GVs from linear scatterers like soft biological tissues. Unfortunately, the in vivo specificity of AM ultrasound imaging is systematically compromised by the nonlinearity added by the GVs to propagating waves, resulting in strong image artifacts from linear scatterers downstream of GV inclusions. To address this issue, we present an imaging paradigm, cross-amplitude modulation (xAM), which relies on cross-propagating plane-wave transmissions of finite aperture X-waves to achieve quasi artifact-free in vivo imaging of GVs. The xAM method derives from counter-propagating wave interaction theory which predicts that, in media exhibiting quadratic elastic nonlinearity like biological tissue, the nonlinear interaction of counter-propagating acoustic waves is inefficient. By transmitting cross-propagating plane-waves, we minimize cumulative nonlinear interaction effects due to collinear wave propagation, while generating a transient wave-amplitude modulation at the two plane-waves’ intersection. We show in both simulations and experiments that residual xAM nonlinearity due to wave propagation decreases as the plane-wave cross-propagation angle increases. We demonstrate in tissue-mimicking phantoms that imaging artifacts distal to GV inclusions decrease as the plane-wave cross-propagation angle opens, nearing complete extinction at angles above 16.5 degrees. Finally, we demonstrate that xAM enables highly specific in vivo imaging of GVs located in the gastrointestinal tract, a target of prime interest for future cellular imaging. These results advance the physical facet of the emerging field of biomolecular ultrasound, and are also relevant to synthetic ultrasound contrast agents.
Subject Areas: Acoustics, Biological Physics, Nonlinear Dynamics
I. INTRODUCTION
Green fluorescent protein (GFP) and its analogs serve as irreplaceable tools allowing biologists to visualize gene expression and other cellular processes using optical microscopes [1]. However, the microstructure of biological tissues restricts a photon’s transport mean free path to about 1 mm [2], limiting in vivo optical imaging applications. In contrast, the physics of ultrasonic waves allow them to propagate centimeters deep into biological tissues without losing their coherence, and enable tissue scanning at the organ scale. Very recently, the first acoustic biomolecules for ultrasound, analogous to GFP for optics, were developed [3] based on a unique class of air-filled protein nanostructures called gas vesicles, or GVs [4], making it possible to use ultrasound to visualize the function of cells deep inside tissues.
To maximize the impact of acoustic biomolecules in biology and medicine, physical methods are needed to discriminate GV scattering from tissue scattering, analogous to previous developments in the imaging of synthetic microbubble contrast agents [5–11]. GVs are air-filled nanocompartments with dimensions on the order of 200 nm, enclosed by a rigid 2 nm-thick protein shell [12,13]. In 2014, it was reported that GVs could be imaged with ultrasound [4], and it was recently shown that gene clusters encoding GVs could be expressed heterologously in engineered cells and serve as acoustic reporter genes [3]. While most natural GVs behave as linear ultrasound scatters, Lakshmanan et al. [14] engineered harmonic GV variants (hGVs) that buckle and scatter higher harmonics at acoustic pressures above 320 kPa, corresponding to a mechanical index of 0.08, well below the FDA safety requirement of 1.9 [15]. Amplitude modulation (AM) ultrasound pulse sequences emerged as logical candidates to exploit dissimilar hGV responses below and above buckling and enabled nonlinear imaging of hGVs in vitro, in ovo, and in vivo [15]. In AM, backscattered echoes of two half-amplitude transmissions are digitally subtracted from echoes of a third, full-amplitude transmission. The full-amplitude transmission creates pressures above the hGV buckling threshold, triggering hGV harmonic scattering, while the half-amplitude transmissions create pressures below hGV buckling and trigger hGV linear scattering. This scattering response difference in hGV echoes persists after the subtraction, while linear echoes from surrounding tissue scale in amplitude and are cancelled. However, we observed that the in vivo specificity of AM imaging of hGVs was systematically compromised by nonlinear wave propagation artifacts that lead to the misclassification of biological tissue as hGVs [15].
In a highly nonlinear medium such as buckling hGVs or resonant microbubbles (nonlinearity parameter B/A two orders of magnitude higher than tissue) [16], ultrasonic waves experience amplitude-dependent attenuation and amplitude-dependent speed of sound [17,18]. In consequence, the high amplitude pulse of the AM sequence gets distorted in proportions that to not scale linearly with the low amplitude pulse of the sequence. Ultrasonic waves carry that distortion as they travel forward in the medium. We hypothesized that this phenomenon, reported in microbubble inclusions [19], is also the cause of nonlinear artifacts distal to GV inclusions.
It is established that in a medium exhibiting quadratic elastic nonlinearity, the interaction of two ultrasonic waves propagating in the same direction exhibits a cumulative nonlinear interaction [20]. With a conventional AM pulse sequence, images are reconstructed line-by-line along the wave propagation direction. The high amplitude pulse of the sequence can be seen as the sum of two pulses of half amplitude that co-propagate and are subject to cumulative nonlinear interaction effects. It is less well known that the nonlinear interaction of ultrasonic waves propagating in opposite directions is inefficient [21]. In a pioneering proof-of-concept, Renaud et al. [22] showed that a pair of subwavelength elements of an ultrasound transducer array could be used to transmit circular wave pulses that are quasi counter-propagative in the near field of the array, allowing them to minimize nonlinear distortion, while generating a 2-fold higher amplitude at the moment of their intersection. Here we show that propagation nonlinearity [Fig. 1(a)] can be efficiently minimized with a non-collinear plane-wave transmission paradigm, which we call cross amplitude modulation, or xAM, while allowing depth-invariant, nonlinear imaging of acoustic biomolecules [Fig. 1(b)]. We demonstrate in simulations and experiments that plane-wave cross-propagation prevents cumulative distortion of the AM wave code, suppresses nonlinear propagation artifacts distal to highly nonlinear hGV inclusions, and enables highly specific in vivo nonlinear ultrasound imaging of hGVs in mice.
FIG. 1.
Sketch of the two nonlinear phenomena that take place while imaging a biological medium containing acoustic biomolecules. (a) Propagation history of a single plane wave: nonlinear frequency components accumulate with depth as the wave propagates through tissue before being attenuated. This phenomenon, amplified during the near-collinear interaction of two wavefronts, leads to nonlinear propagation artifacts distal to GV inclusions. (b) Nonlinear scattering behavior of GVs insonified above their buckling pressure, enabling their detection with an amplitude modulation (AM) code.
II. NONLINEAR INTERACTION OF CROSS-PROPAGATING PLANE WAVES
A. The cross amplitude modulation sequence (xAM)
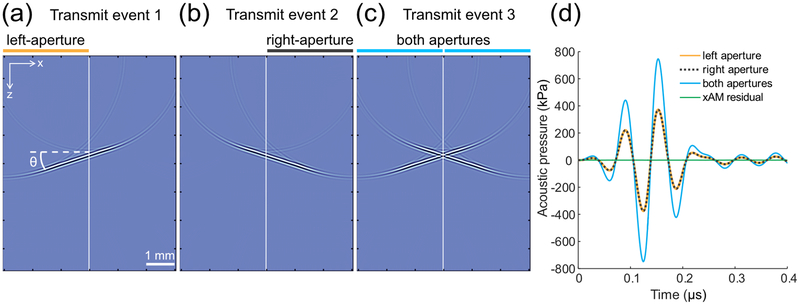
Cross amplitude modulation is a biomolecular ultrasound imaging paradigm that aims at minimizing wave propagation-related harmonics [23] using propagation symmetry considerations, while capturing local acoustic biomolecules’ harmonics to ensure their specific in vivo detection. Considering an N-element aperture of a linear array of ultrasonic transducers, the xAM sequence consists in (1) using the elements 1 to N/2 to transmit a tilted plane-wave at an angle θ with respect to the array [Fig. 2(a)], (2) using the elements N/2+1 to N to transmit a symmetric plane-wave at an angle θ with the array [Fig. 2(b)], and (3) transmitting the previous two plane-waves simultaneously [Fig. 2 (c)]. The two cross-propagating waves depicted in Fig. 2 (c) interact along the virtual bisector that separates the two half-apertures. Particles of the insonified medium that are located along the bisector experience the same wave amplitude for steps (1) and (2), and a doubled wave-amplitude for step (3) as seen in Fig. 1(d). This axisymmetric pulse sequence creates an AM code along the bisector that separates the two N/2 sub-apertures.
FIG. 2.
Simulation of the xAM sequence for θ = 18° in a homogeneous/isotropic water medium. (a) Half-aperture plane-wave transmission at an 18° angle with respect to the transducer array. (b) Axisymmetric half-aperture plane-wave transmission at an 18° angle with the other half of the array. (c) Cross-propagating plane-waves transmission at an 18° angle using both half-apertures. (d) Simulated waveforms at the bisector intersection for z = 3.6 mm. The cross-propagating plane-waves peak positive pressure was 747 kPa (blue curve), while the residue peak positive pressure (green curve) was 0.13 kPa, or 0.02% of the cross-propagating plane-waves peak positive pressure.
Our working hypothesis was that cumulative nonlinear plane-wave interaction arsing during wave propagation decreases as the cross-propagation angle θ increases. We therefore started by determining whether minimal AM code distortion could be achieved with xAM in a weakly nonlinear homogeneous/isotropic medium. To do so, we first evaluated xAM signal cancellation during plane-wave propagation in water using two-dimensional time-domain numerical simulations (see Appendix A) [24]. Keeping the experimental realization of the xAM sequence in mind, we assessed the directivity of individual elements of our transducer array [25] and set the maximal angle θ to 21° based on the array −3 dB directivity bandwidth (see Appendix A, Fig. 7). The simulation result displayed in Fig. 2(d) shows that, for a xAM sequence of angle θ = 18° at a depth of 3.6 mm, the residual peak wave amplitude is reduced by four orders of magnitude to 0.02% of the cross-propagating plane-waves peak amplitude (0.13 kPa compared to 747 kPa, respectively). As a comparison, a high-end commercial scanner provides an AM residual of the order of 0.5%.
Cross-propagating plane-waves, or X-waves, intersect with each other along a finite geometric distance which defines the depth of field ZX of the xAM sequence,
| (1) |
where A is the full aperture used for the X-wave transmission. For an angle θ = 18° and an aperture A = 6.5 mm, ZX equals 10 mm, which would for example enable scanning of a full mouse brain. Note that beyond ZX, images could be reconstructed further down thanks to the diffraction of the wavefronts edges using spherical delay laws analogous to Renaud et al. [22].
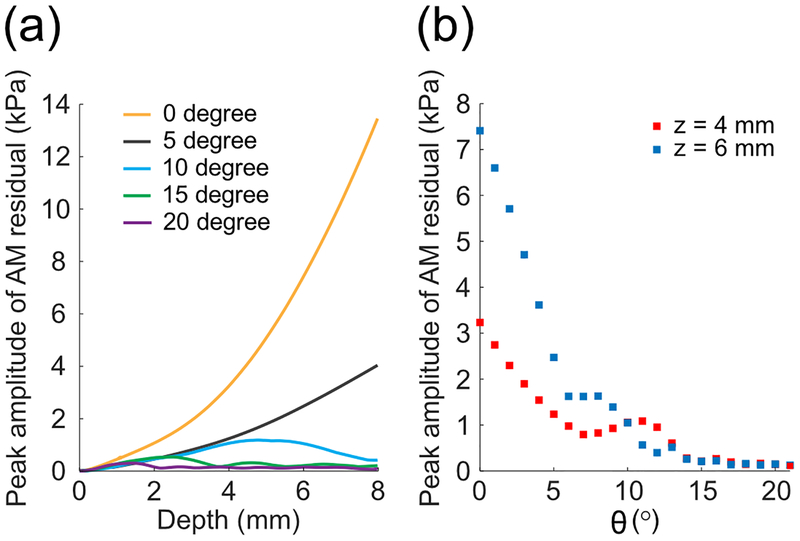
We further assessed the significance of nonlinear effects accumulating during plane-wave propagation as a function of θ [Figs. 3(a)–3(b)]. At low θ angles, which correspond to quasi co-propagation, residual AM nonlinearity clearly accumulated with depth (see Fig. 3(a), θ = 0° and 5°). In particular, for plane-waves propagating in water with a peak amplitude of 400 kPa and at an angle θ = 0° (collinear propagation case), the residual AM peak amplitude reached 13.5 kPa at a distance z = 8 mm [Fig. 3(a)]. As θ increased, the residual AM nonlinearity was significantly reduced, reaching a non-cumulative 0.3 kPa peak pressure at an angle θ = 20° [Fig. 3(a)]. Fig. 3(b) reports the peak amplitude of the AM residue as a function of θ at the distances z = 4 mm and z = 6 mm from the array. Data reported in Figs 3(a) and 3(b) were obtained using a constant transmit peak pressure at 4 mm equal to 400 kPa. The simulations show that the amplitude of the xAM residue drops rapidly as θ increases, and converges below a threshold of 0.2 kPa for θ > 15°. These results support our hypothesis that nonlinear plane-wave interaction becomes less efficient as θ increases, and predict that in a weakly nonlinear homogeneous/isotropic medium as water (attenuation equal to 0.002 dB/MHz2 cm), one can expect an AM code showing minimal wave distortion due to propagation at cross-propagation angles above 15°.
FIG. 3.
Simulation of nonlinear plane-wave interaction as a function of the cross-propagation angle θ. (a) Peak positive pressure of the xAM residual as a function of depth for five cross-propagation angles. (b) Peak positive pressure of the xAM residual as a function of θ at depths z equals 4 mm and 6 mm.
While a complete analytical treatment of this phenomenon has not been developed, some intuition can be obtained from the work of Hamilton et al. [26,27], who reported that the noncollinear nonlinear interaction of two plane wave fields results in an asynchronous interaction that generates a sum frequency wave whose amplitude oscillates with a spatial period of 2π/2k(1 − cos θ), k being the wave vector of the plane waves. As the angle between the two, waves increases, the phase mismatch increases, the spatial period of the nonlinear pressure field decreases, and the nonlinear interaction becomes less efficient. The same phenomenon is observed in our simulations: as the angle increases, the spatial period of oscillation and the amplitude of the nonlinear pressure field decrease (see Fig 3(a), 10, 15 and 20 degree lines). The nonlinear pressure field is also expected to increase or decrease with the nonlinearity of the medium, as characterized by its shock length. With these considerations supporting the plausibility of our simulation results, we proceeded to implement the xAM concept experimentally. A full analytical treatment of this problem will be described in future work.
B. Experimental reduction of residual xAM nonlinearity as a function of θ
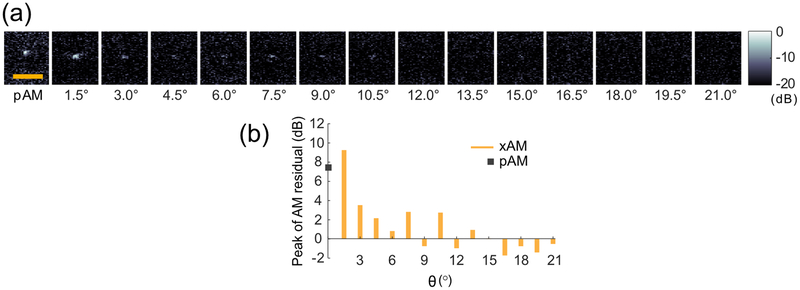
To assess experimentally the ability of higher-θ xAM pulses to minimize nonlinearity, we implemented the xAM imaging sequence and beamforming on a programmable ultrasound system with a 128-element linear array (see Appendix A) and measured the peak residual AM signal of a subwavelength linear scatterer immersed in water. This configuration enabled the assessment of the nonlinearity captured by the AM sequence that is solely due to wave propagation in a typical quasi-incompressible medium (water serves as a first-approximation model for sound wave propagation in soft biological tissues). A 10 μm diameter nickel wire was placed perpendicular to the imaging plane in phosphate buffer saline (PBS) at a depth of 4 mm. The wire was imaged using xAM at θ values ranging from 1.5° to 21° [Fig. 4(a)]. We measured the AM residual for each angle as the peak value of the beamformed radio-frequency (RF) data. The data show the same trend predicted by the simulations, with residual nonlinearity decreasing sharply with wider angles [Fig. 4(b)]. To compare these results with a conventional AM imaging sequence, we implemented a standard parabolic amplitude modulation (pAM) code, in which half-amplitude transmissions were achieved by silencing the even or odd transmitting elements of the array and imaging lines were reconstructed along the wave propagation direction [15]. As of θ = 3°, xAM significantly outperformed pAM in reducing the residual AM signal [Fig. 4(b)]. We measured the axial and lateral resolution of xAM using the full-width half-maximum (FWHM) of the point-spread function (PSF) along the respective directions. The mean axial resolution was 117 μm ± 16 μm, and the mean lateral resolution is 381 μm ± 42 μm, with values remaining constant across angles. The axial resolution of pAM was 103 μm and the lateral resolution was 250 μm.
FIG. 4.
xAM images of the cross section of a subwavelength nickel wire as a function of the cross-propagation angle θ. (a) Images reconstructed from the three component transmissions of the pAM code and xAM code at angles ranging from 1.5° to 21°. The wire was positioned at a depth of 4 mm. Each image depth ranges from 3.0 mm to 4.5 mm and width from −1.5 mm to 1.5 mm. Scale bar: 1 mm. (b) Peak AM residual signal as a function of the xAM sequence angle θ. xAM signals are labelled in orange, the pAM signal is labelled with a gray square symbol. Values in dB represent the peak value of the residual signal relative to the peak value of the noise.
III. CROSS AMPLITUDE MODULATION IMAGING OF ACOUSTIC BIOMOLECULES
A. Angle-dependent xAM reduction of nonlinear propagation artifacts distal to GV inclusions
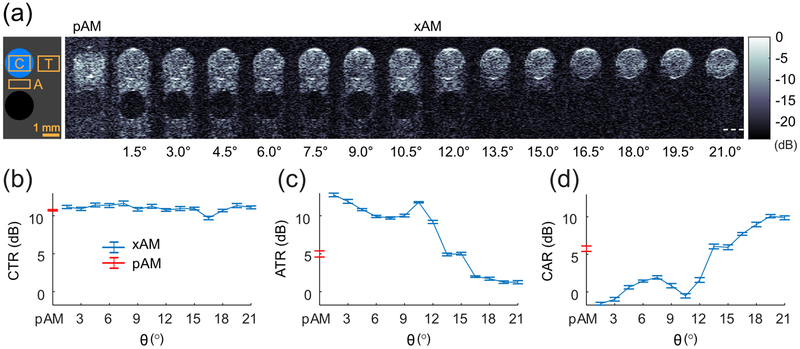
The xAM sequence was developed to detect hGVs with high specificity. The peak positive pressure of the single tilted plane-waves excites the hGVs in the linear scattering regime, while the doubled X-wave intersection amplitude excites the hGVs in the nonlinear scattering regime. By summing the echoes from the two plane-wave transmissions and then subtracting them from the echoes of the X-wave transmissions, we solely retrieve non-zero differential GV signals while the echoes of surrounding linear scatterers cancel. To evaluate the effectiveness of xAM in reducing the nonlinear propagation artifact, we embedded a 2-mm wide cylindrical inclusion of hGVs in agar (at a concentration of 256 pM; see Appendix A for GV preparation) in a tissue-mimicking phantom consisting of agar and 3 μm aluminum oxide particles (a model linear scatterer). A second inclusion filled with a scatterer-free PBS/agar mixture was positioned 1 mm below the GVs (see schematic, Fig 5(a)). We imaged the phantom using the same sequence parameters used for the subwavelength scatterer measurements, with the top of the hGV inclusion positioned at 4 mm [Fig. 5], since X-waves provide extended depths of fields compared to parabolic beams [28].
FIG. 5.
In vitro pAM and xAM images of an hGV inclusion in a tissue-mimicking phantom. (a) Left, schematic of the phantom configuration: linearly scattering tissue-mimicking medium in gray, hGV inclusion in blue, anechoic agar-filled inclusion in black, and ROIs for contrast (C), tissue (T) and artifact (A) quantification. Right, set of pAM and xAM images of a representative well positioned at z = 4 mm. Separate images spanning depths of 3 mm to 9 mm are concatenated. Scale bar: 1 mm. White dotted line: ZX at θ = 21°. (b) Contrast-to-tissue ratio (CTR) as a function of θ. (c) Artifact-to-tissue ratio (ATR) as a function of θ. (d) Contrast-to-artifact ratio (CAR) as a function of θ. N = 6. Error bars: SEM.
With parabolic and low-θ xAM pulses, we observed significant nonlinear propagation artifact distal to hGV inclusions [Fig. 5(a) and 5(b)], confirming the high nonlinearity of hGV-filled media. The pAM and xAM images where quantified in terms of contrast-to-tissue ratios (CTR), contrast-to-artifact ratios (CAR), and artifact-to-tissue ratios (ATR) [Fig. 5(b)–(d)]. For pAM and low θ angles, the artifact intensity was on par or above the hGV inclusion intensity (e.g. for θ = 1.5°, CAR = −1.6 dB at z = 4 mm), highlighting the specificity issue posed by collinear AM imaging. For angles above 15°, xAM produces images with a clear reduction in artifact signal while maintaining full contrast in the hGV inclusion. We also observed that, as in the simulation and subwavelength scatter results, the artifact reduction is a non-monotonic function of θ, with a local jump in xAM artifact at 10.5° [Fig. 5(c)]. Overall, these results suggested that xAM provides the highest specificity for hGV signals at angles larger than 15°.
B. In vivo xAM ultrasound imaging of acoustic biomolecules
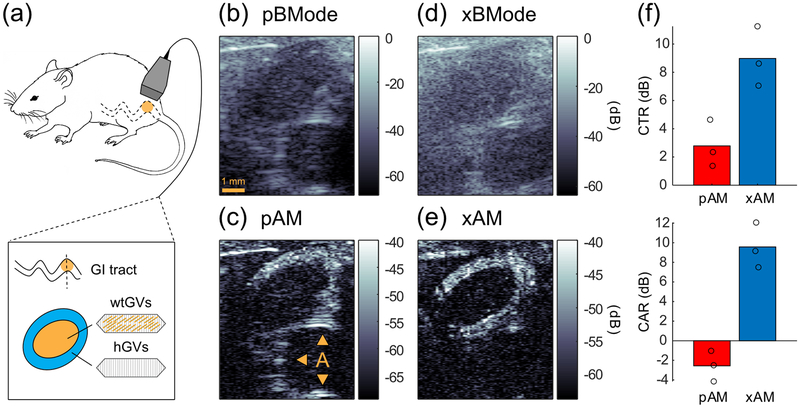
Finally, to test the xAM imaging method in vivo, we injected into the gastrointestinal tract of a mouse a patterned agar-GV mixture that consisted of a core of wild-type linearly scattering GVs (wtGVs) surrounded by a circular layer of hGVs. We imaged the mouse abdomen using xAM at θ = 19.5°, which yielded the highest contrast-to-artifact ratio in the phantom experiments, and compared the results to imaging with pAM with the focus adjusted to 4 mm and an aperture of 20 elements (f-number = 2.0) to align the depth-of-field with that of the xAM sequence. The parabolic B-mode (pBMode) image, i.e. the conventional anatomical ultrasound image, was sharper than the cross-propagating B-mode (xBMode) image, which is expected, as X-waves generate higher side lobes that reduce image contrast [29]. Only the top of the hGV inclusion was visible in the pAM image due to the narrow depth-of-field of parabolic beams [Fig. 6(c)]. The pAM image also contained a large artifact below the inclusion (CTR = 2.8 dB, CAR = −2.6 dB), parts of which blended with the hGV signal, displaying a potentially misleading distribution of the contrast agent. In contrast, the annular hGV inclusion is almost entirely visible in the xAM image, with little-to-no artifact in the vicinity, and inner and outer contours more clearly delineated [Fig. 6(e)]. The xAM CTR was 9.0 dB and the xAM CAR was 9.6 dB, demonstrating the superior performance of xAM over pAM in terms of specificity [Fig. 6(f)].
FIG. 6.
In vivo pAM and xAM imaging of acoustic biomolecules. (a) Schematic of the experiment. A concentric mixture of nonlinearly scattering hGVs and linearly scattering wtGVs was injected in a mouse gastrointestinal (GI) tract and imaged with pAM and xAM. (b) pBMode image, focus = 4 mm, f-number = 2.0. (c) pAM image, arrows point at the artifact (A). (d) xBMode, θ = 19.5° (e) xAM image. pAM and xAM dynamic ranges are displayed relative to their respective BMode ranges. All images depth ranged from z = 2 mm to ZX = 9.2 mm. (f) Comparison of xAM and pAM in terms of mean contrast-to-tissue ratios (CTR) and contrast-to-artifact ratios (CAR). N = 3. ROIs for CTR and CAR measurements are reported in Fig. 8, Appendix A.
IV. ADVANTAGES, LIMITATIONS AND OUTLOOK
Taken together, our results suggest that the xAM ultrasound pulse sequence, based on one X-wave and two tilted plane-wave transmissions, achieves highly specific nonlinear imaging of acoustic biomolecules through wave-amplitude modulation. Two noncollinear plane waves interact to generate a two-fold amplitude modulation at their intersection with minimal nonlinear distortion for angles θ above 15°. This allows retrieval of non-zero differential hGV signals, while the echoes of surrounding linear scatterers cancel and propagation artifacts are reduced to the noise floor level (−10 dB at 18°). With a 6.4 mm aperture, this technique offers a depth-of-field suitable for small-animal imaging (10 mm at 18°). The xAM sequence proved to be robust enough to suppress in vivo artifacts present in pAM while distinguishing engineered nonlinear hGVs from linearly scattering wild type GV variants in the gastrointestinal tract of a mouse. While this manuscript is focused on introducing and thoroughly characterizing the xAM pulse sequence for use with non-linear contrast agents, with purified GVs as the model agent, these results are relevant to parallel work being done to apply GVs as functionalized contrast agents and as reporter genes expressed inside cells [3,14,30]. The xAM imaging method introduced here thus paves the way for in vivo biomolecular ultrasound studies of molecular and cellular processes based on visualization of acoustic biomolecules [13]. Interestingly, theory and simulations predict that the peak of the cross-propagating plane-waves travels at a supersonic velocity, increasing as θ opens (see Appendix B, Fig. S1), an effect that may be linked to the decreasing nonlinear interaction of the planar wavefronts. Coherent compounding of xAM data acquired at four different angles θ (see Appendix B, Fig. S2) was also shown to be a way to increase CTR and CAR further.
Potential limitations of this method include its reduced depth of field as the cross-propagating angle increases. The method appears therefore to be well suited for ultrasound biomicroscopy, small animal experiments and superficial examinations in humans. xAM image depth can be extended beyond the intersection distance of the X-wave by using spherical delay laws reported by Renaud et al. [22], but the quality of nonlinear artifact reduction will decline with depth. Another potential limitation of the method is that it relies on propagation symmetry in a homogeneous/isotropic medium to generate an amplitude-modulated code, and will therefore be impacted by dissymmetric phase-aberrating media like biological tissues. This issue could be tackled using adaptive wavefront-shaping techniques developed in optics and acoustics [31,32]. In the near future, xAM could be implemented at ultrafast frame rates [33] by relying on 2D arrays of transducers [34] to improve the sensitivity or the temporal resolution of xAM further. Finally, while this study focused on the use of xAM to image nonlinear acoustic biomolecules, we expect this technology to propagate across as a general solution to the long-standing problem of distal nonlinear propagation artifacts in the field of synthetic microbubble-based ultrasound contrast agents.
ACKNOWLEDGEMENTS
DM and DS contributed equally to this work. DM is supported by the Human Frontiers Science Program Cross-Disciplinary Postdoctoral Fellowship (Award No. LT000637/2016). DS is supported by the NSF graduate research fellowship (award number 1745301). This research was funded by the National Institutes of Health (grant EB018975 to MGS). Related research in the Shapiro laboratory is also supported by the Heritage Medical Research Institute, Burroughs Wellcome Career Award at the Scientific Interface, the Pew Scholarship in the Biomedical Sciences and the Packard Fellowship for Science and Engineering.
APPENDIX A: MATERIALS AND METHODS
1. k-Wave simulations
We investigated the influence of the transmit angle θ on the nonlinear interaction between two noncollinear plane waves emitted by two apertures using two-dimensional time-domain numerical simulations (k-Wave version 1.2, [24]). The transmit angle was varied from 1 to 21 degrees [Fig. 3]. Transmit delays are calculated to generate a plane-waves with the proper angle θ. We simulated wave propagation in a homogeneous/isotropic medium (water) with a configuration corresponding to the setup reported experimentally in Fig. 4. Speed of sound in water was set to 1480 m/s, the attenuation to 0.002 dB/MHz2 cm), and the nonlinear parameter B/A to 5. The size of the domain was 6.4 mm × 8 mm; it is discretized with a step size of 10 μm. Perfectly matched layers are used to absorb the waves at the edges of the domain. The source broadcasts a short pulse with a center frequency of 15 MHz. The acoustic pressure generated by the source is varied so that the peak acoustic pressure generated at 4 mm depth by a single aperture equals 400 kPa for all tested angles. For a given transmit angle, three simulations are required: 1) transmission with the right aperture only, 2) transmission with the left aperture only and 3) transmission with both apertures. The pressure field is recorded along the segment bisector (between the two transmit apertures). For a given transmit angle, the amplitude modulation scheme is applied to the recorded signals, then the result is band-pass filtered to reproduce the effect of the limited frequency bandwidth of the transducer with a 100% relative frequency bandwidth (the cutoff frequencies of the filter are 7.5 MHz and 22.5 MHz).
2. Engineering of harmonic acoustic protein nanostructures
Anabaena GVs were cultured and transferred to sterile separating funnels and the buoyant cells were allowed to float to the top and separate from the spent media over a 48h period. GVs were harvested by hypertonic lysis. Purification was done by repeated centrifugally assisted floatation followed by resuspension. Wild type Ana GVs were stripped of their outer GvpC layer by treatment with 6 M urea solution to obtain hGVs. Two rounds of centrifugally assisted floatation followed by removal of the subnatant layer to ensure complete removal of native GvpC. For detailed information, see Lakshmanan et al. [30].
3. Tissue-mimicking phantom 3D design & preparation
Tissue-mimicking phantoms for imaging were prepared by melting 1% (w/v) agarose gel in PBS and with 0.2% (w/v) AlO3. We used a custom 3D-printed mold to create a 2-by-2 grid of cylindrical wells with 2 mm diameter and 1 mm spacing between the outer radii in the bulk material. GVs were incubated at 42 °C for 1 minute and then mixed in a 1:1 ratio with molten agarose (at 42 °C) for a final GV concentration corresponding to 2.25 OD500nm and immediately loaded into the phantom. Wells not containing GVs were filled with plain 1% agar. The AlO3 concentration was chosen to match the scattering echogenicity of the GV well as measured by the contrast-to-noise ratio of the respective regions in a B-mode ultrasound image. The phantoms used for the angle ramp images contained stripped Ana GVs in the upper-left well. The phantom used for the voltage ramp images contained wild type Ana GVs in the upper-left well and stripped Ana GVs in the upper-right well. All phantoms were imaged on top of an acoustic absorber material while immersed in PBS. Based on the elevation f-number of the probe, the elevation resolution (i.e. the thickness of the imaging plane) is 512 μm. The molarity of Ana GVs for a given OD value is 114 pM/OD [30]. Using these values and the dimensions of the hGV inclusion, we estimate that 2.47×10⁵ GVs contribute to each image, or roughly 200 GVs for each pixel.
4. Ultrasound acquisition sequence
We used a Verasonics Vantage ultrasound system with a L22–14v probe (Verasonics Inc., Redmond, WA, USA) to implement the xAM and pAM imaging sequences. The probe is a linear array of 128 elements with a 0.10 mm pitch, an 8 mm elevation focus, a 1.5 mm elevation aperture, and a center frequency of 18.5 MHz with 67% −6 dB bandwidth. We applied a single-cycle transmit waveform at 15.625 MHz to each active array element to ensure our fundamental frequency divided four times with the 62.5 MHz sampling rate of the system. To provide a reasonable tradeoff between lateral field of view and axial depth of field, we used an aperture of 65 elements for the xAM sequence (with the center element silenced to allow for a symmetric AM code). This allowed for 64 ray lines per xAM image. The focus of the parabola used in the pAM sequence was set to 8 mm to match the probe’s elevation focus. We used an aperture of 38 elements for the pAM sequence to maintain a f-number of 2, but limited the number of ray lines to 64 to match the xAM frames. To control for variation in pressure across different beam profiles, we selected probe voltages for each xAM angle and for pAM that generated to a CTR of 10 dB in the hGV inclusion of the phantoms. The voltage table is provided in Appendix B.
We collected raw RF data from our acquisitions and implemented a custom real-time image reconstruction pipeline, including a beamforming algorithm suited to the unique requirements of xAM. To reduce noise during live imaging while saving system memory, we applied a first-order infinite impulse response (IIR) filter to successive frames of RF data, according to the following difference equation
| (A1) |
where n is the frame index, α is the persistence coefficient, x is the unfiltered RF data, and y is the output of the filter. All RF data reported was acquired with α = 0.9 except for the in vivo pAM image, which was acquired 516 with α = 0.7 to avoid blurring due to motion.
5. xAM beamforming
The novel cross-propagation paradigm necessitated adjustments to conventional beamforming for image reconstruction, as a particularity of this method is that xAM image lines are not formed along the propagation direction of the ultrasonic waves, but along the line along which the two cross-propagating plane-waves intersect. The linear array transmission configuration and directivity [25] can be modeled as in Fig. 7.
FIG. 7.
Linear array aperture geometry and directivity. (a) Ultrasound imaging linear array configuration. θ is the cross-propagation angle, p the pitch of the linear transducer array, x1 the first element of the active aperture (blue elements), xb the element along the aperture, and xn an arbitrary element along the array. dtx is the distance from the planar wavefront to a point along the bisector, and drx is the return distance to the array. Silent elements are labelled in orange. (b) Directivity of an individual element of the linear transducer array (p = 0.1 mm, f = 15.6 MHz). The red dotted line indicates the – 3 dB acoustic pressure level.
The distance from either angled wavefront to the point (xb, z) and the return trip distance of the echo received by array element xn are, respectively,
| (A2) |
| (A3) |
Hence, the two-way travel time to element xn is
| (A4) |
whereas the observed arrival time of this echo on the bisector element is
| (A5) |
We can then derive the depth of the echo signal from its arrival time on the bisector as
| (A6) |
and, finally, obtain the time delay to apply to the received signal for dynamic focusing:
| (A7) |
These beamforming equations are valid in the region over which the waves are cross-propagating. The depth of field (equation (1)) to which this region extends is given by (xn − xb) cot θ.
6. In vivo ultrasound imaging
The in vivo experiment was performed on a C57BL/6J male mouse (Jackson Laboratory) under a protocol approved by the Institutional Animal Care and Use Committee of the California Institute of Technology. No randomization or blinding were necessary in this study. Ultrasound imaging was performed as follows: the mouse was anaesthetized with 2–3% isoflurane, depilated over the imaged region, and imaged using an L22–14v transducer with the pulse sequence described above. For imaging of GVs in the gastrointestinal tract, the mouse was placed in a supine position, with the ultrasound transducer positioned on the lower abdomen, transverse to the colon. Prior to imaging, wild type and stripped Ana GVs were mixed in a 1:1 ratio with 42 °C 4% agarose–PBS for a final GV OD500nm equal to 2.25. An 8-gauge needle was filled with the mixture of agarose and stripped Ana GVs. Before it solidified, a 14-gauge needle was placed inside the 8-gauge needle to form a hollow lumen within the gel. After the agarose–GV mixture solidified at room temperature for 10 min, the 14-gauge needle was removed. The hollow lumen was then filled with the agarose mixture containing the wild type Ana GVs. After it solidified, the complete cylindrical agarose gel was injected into the colon of the mouse with a PBS back-filled syringe. Additional PBS was then injected into the colon to remove air bubbles in the vicinity of the gel.
FIG. 8.
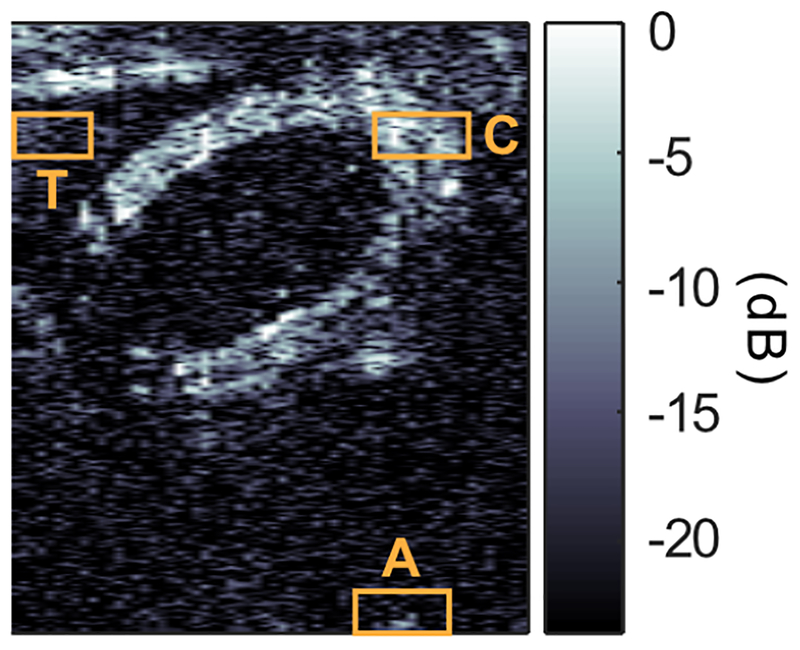
Tissue (T), Contrast (C) and Artifact (A) regions of interest used for the ratios displayed in Fig. 6.
APPENDIX B: SUPPLEMENTARY DATA
1. Supersonic cross-propagating plane-waves intersection
Interestingly, as both plane-waves cross-propagate, local coordinates of each wave-front interact with their axisymmetric counterpart, but contrary to co-propagating plane waves, it is a transient interaction. The plane-waves intersection velocity cX is given by,
| (B1) |
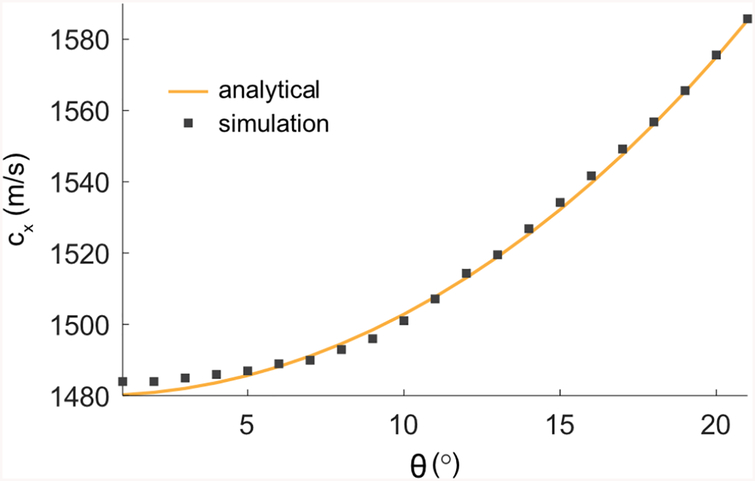
where c0 is the speed of sound in the propagation medium. It can readily be seen from (2) that the plane-waves intersection velocity cX is supersonic for θ > 0 as reported by Lu and Greenleaf [28], and seen in Fig. S1. The third transmission event of the xAM sequence [Fig. 2(c)] corresponds to a finite aperture forward propagating X-wave solution of the homogeneous/isotropic wave equation with the form f(x, z − cXt) [28], where f represents a scalar function (e.g. the acoustic pressure pulse) of space and time, although in our case X-wave pressure distribution is constant along its branches.
FIG. S1.
Analytical and simulated cross-propagating plane-waves intersection velocity as a function of θ.
2. Coherent compounding
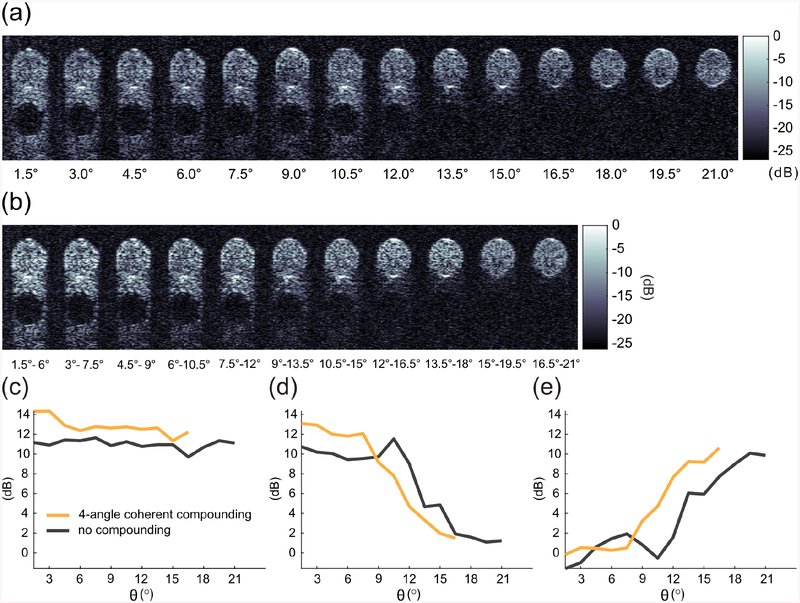
We tested the effect of coherent compounding [35] of the RF data from multiple xAM acquisitions with different angles. Due to the difference in interaction velocity for different angles, the RF data from individual acquisitions was first aligned to the peak of the average autocorrelation function of the individual beamformed ray lines composing the images. The best results were achieved by compounding of four adjacent angles. This improved the average CTR by 1.7 dB and the peak CAR by 0.5 dB [Fig. S2].
FIG. S2.
Comparison of coherently compounded and to single-acquisition xAM images the in vitro data at 4 mm. (a) A set of xAM images from the experiment depicted in Fig. 5. (b) The same images with coherent compounding applied to successive sets of four acquisitions. (c) Contrast-to-tissue ratio of single-acquisition xAM compared with coherently compounded data as a function of angle. (d) Artifact-to-tissue ratio. (e) Contrast-to-artifact ratio. n = 6. Error bars not shown for ease of comparison.
3. Voltage-pressure table
The phantom images reported in Fig. 5 were acquired using the following voltage table that ensured a 10 dB CTR across images and therefore enable for the comparison of the artifact intensity across cross-propagation angles.
Table 1.
pAM (orange) and xAM (white) input transducer voltages generating a 10 dB CTR at 4 mm.
| θ (°) | pAM | 1.5 | 3.0 | 4.5 | 6.0 | 7.5 | 9.0 | 10.5 | 12.0 | 13.5 | 15.0 | 16.5 | 18.0 | 19.5 | 21.0 |
| V4 mm | 1.9 | 4.6 | 4.3 | 3.7 | 3.3 | 3.4 | 3.8 | 3.9 | 4.2 | 4.1 | 4.5 | 4.5 | 4.7 | 5.0 | 5.5 |
REFERENCES
- [1].Tsien RY, The Green Fluorescent Protein, Annual Review of Biochemistry 67, 509(1998). [DOI] [PubMed] [Google Scholar]
- [2].Ntziachristos V, Going deeper than microscopy: the optical imaging frontier in biology, Nature methods 7, 603(2010). [DOI] [PubMed] [Google Scholar]
- [3].Bourdeau RW, Lee-Gosselin A, Lakshmanan A, Farhadi A, Kumar SR, Nety SP, and Shapiro MG, Acoustic reporter genes for noninvasive imaging of microorganisms in mammalian hosts, Nature 553, 86(2018). [DOI] [PMC free article] [PubMed] [Google Scholar]
- [4].Shapiro MG, Goodwill PW, Neogy A, Yin M, Foster FS, Schaffer DV, and Conolly SM, Biogenic gas nanostructures as ultrasonic molecular reporters, Nature nanotechnology 9, 311(2014). [DOI] [PMC free article] [PubMed] [Google Scholar]
- [5].Ferrara K, Pollard R, and Borden M, Ultrasound Microbubble Contrast Agents: Fundamentals and Application to Gene and Drug Delivery, Annual Review of Biomedical Engineering 9, 415(2007). [DOI] [PubMed] [Google Scholar]
- [6].Faez T, Emmer M, Kooiman K, Versluis M, van der Steen A, and de Jong N, 20 years of ultrasound contrast agent modeling, IEEE transactions on ultrasonics, ferroelectrics, and frequency control 60, 7(2013). [DOI] [PubMed] [Google Scholar]
- [7].Brock-Fisher GA, Poland MD, and Rafter PG, (Google Patents, 1996).
- [8].Simpson DH, Chin CT, and Burns PN, Pulse inversion Doppler: a new method for detecting nonlinear echoes from microbubble contrast agents, IEEE transactions on ultrasonics, ferroelectrics, and frequency control 46, 372(1999). [DOI] [PubMed] [Google Scholar]
- [9].Hansen R and Angelsen BA, Contrast imaging by non-overlapping dual frequency band transmit pulse complexes, IEEE transactions on ultrasonics, ferroelectrics, and frequency control 58, 290(2011). [DOI] [PubMed] [Google Scholar]
- [10].Maresca D, Renaud G, van Soest G, Li X, Zhou Q, Shung KK, de Jong N, and van der Steen AF, Contrast-enhanced intravascular ultrasound pulse sequences for bandwidth-limited transducers, Ultrasound in medicine & biology 39, 706(2013). [DOI] [PMC free article] [PubMed] [Google Scholar]
- [11].Renaud G, Bosch JG, Ten Kate GL, Shamdasani V, Entrekin R, de Jong N, and van der Steen AF, Counter-propagating wave interaction for contrast-enhanced ultrasound imaging, Physics in medicine and biology 57, L9(2012). [DOI] [PubMed] [Google Scholar]
- [12].Walsby A, Gas vesicles, Microbiological reviews 58, 94(1994). [DOI] [PMC free article] [PubMed] [Google Scholar]
- [13].Maresca D et al. , Biomolecular Ultrasound and Sonogenetics, Annual review of chemical and biomolecular engineering (2018). [DOI] [PMC free article] [PubMed] [Google Scholar]
- [14].Lakshmanan A, Farhadi A, Nety SP, Lee-Gosselin A, Bourdeau RW, Maresca D, and Shapiro MG, Molecular Engineering of Acoustic Protein Nanostructures, ACS nano 10, 7314(2016). [DOI] [PMC free article] [PubMed] [Google Scholar]
- [15].Maresca D, Lakshmanan A, Lee-Gosselin A, Melis JM, Ni YL, Bourdeau RW, Kochmann DM, and Shapiro MG, Nonlinear ultrasound imaging of nanoscale acoustic biomolecules, Applied physics letters 110, 073704(2017). [DOI] [PMC free article] [PubMed] [Google Scholar]
- [16].Wu J and Tong J, Measurements of the nonlinearity parameter B/A of contrast agents, Ultrasound in medicine & biology 24, 153(1998). [DOI] [PubMed] [Google Scholar]
- [17].Emmer M, Vos HJ, Goertz DE, van Wamel A, Versluis M, and de Jong N, Pressure-dependent attenuation and scattering of phospholipid-coated microbubbles at low acoustic pressures, Ultrasound in medicine and biology 35, 102(2009). [DOI] [PubMed] [Google Scholar]
- [18].Tang M-X and Eckersley RJ, Frequency and pressure dependent attenuation and scattering by microbubbles, Ultrasound in Medicine and Biology 33, 164(2007). [DOI] [PubMed] [Google Scholar]
- [19].ten Kate GL et al. , Far-wall pseudoenhancement during contrast-enhanced ultrasound of the carotid arteries: clinical description and in vitro reproduction, Ultrasound in medicine & biology 38, 593(2012). [DOI] [PubMed] [Google Scholar]
- [20].Aanonsen SI, Barkve T, Tjo/tta JN, and Tjo/tta S, Distortion and harmonic generation in the nearfield of a finite amplitude sound beam, The Journal of the Acoustical Society of America 75, 749(1984). [Google Scholar]
- [21].Gusev V, Bailliet H, Lotton P, and Bruneau M, Interaction of counterpropagating acoustic waves in media with nonlinear dissipation and in hysteretic media, Wave Motion 29, 211(1999). [Google Scholar]
- [22].Renaud G, Bosch JG, van der Steen AF, and de Jong N, Increasing specificity of contrast-enhanced ultrasound imaging using the interaction of quasi counter-propagating wavefronts: a proof of concept, IEEE transactions on ultrasonics, ferroelectrics, and frequency control 62, 1768(2015). [DOI] [PubMed] [Google Scholar]
- [23].Pasovic M, Danilouchkine M, Faez T, van Neer PL, Cachard C, van der Steen AF, Basset O, and de Jong N, Second harmonic inversion for ultrasound contrast harmonic imaging, Physics in medicine and biology 56, 3163(2011). [DOI] [PubMed] [Google Scholar]
- [24].Treeby BE, Jaros J, Rendell AP, and Cox BT, Modeling nonlinear ultrasound propagation in heterogeneous media with power law absorption using a k-space pseudospectral method, J Acoust Soc Am 131, 4324(2012). [DOI] [PubMed] [Google Scholar]
- [25].Selfridge A, Kino G, and Khuri-Yakub B, A theory for the radiation pattern of a narrow-strip acoustic transducer, Applied physics letters 37, 35(1980). [Google Scholar]
- [26].Hamilton MF and TenCate JA, Sum and difference frequency generation due to noncollinear wave interaction in a rectangular duct, The Journal of the Acoustical Society of America 81, 1703(1987). [Google Scholar]
- [27].Hamilton MF and Blackstock DT, On the coefficient of nonlinearity β in nonlinear acoustics, The Journal of the Acoustical Society of America 83, 74(1988). [Google Scholar]
- [28].Lu JY and Greenleaf JF, Nondiffracting X waves-exact solutions to free-space scalar wave equation and their finite aperture realizations, IEEE transactions on ultrasonics, ferroelectrics, and frequency control 39, 19(1992). [DOI] [PubMed] [Google Scholar]
- [29].Lu J-Y and Greenleaf J, in Ultrasonics Symposium, 1991. Proceedings., IEEE 1991 (IEEE, 1991), pp. 1155. [Google Scholar]
- [30].Lakshmanan A et al. , Preparation of biogenic gas vesicle nanostructures for use as contrast agents for ultrasound and MRI, nature protocols 12, 2050(2017). [DOI] [PMC free article] [PubMed] [Google Scholar]
- [31].Wang K, Sun W, Richie CT, Harvey BK, Betzig E, and Ji N, Direct wavefront sensing for high-resolution in vivo imaging in scattering tissue, Nature communications 6, 7276(2015). [DOI] [PMC free article] [PubMed] [Google Scholar]
- [32].Imbault M, Faccinetto A, Osmanski B-F, Tissier A, Deffieux T, Gennisson J-L, Vilgrain V, and Tanter M, Robust sound speed estimation for ultrasound-based hepatic steatosis assessment, Physics in Medicine & Biology 62, 3582(2017). [DOI] [PubMed] [Google Scholar]
- [33].Tanter M and Fink M, Ultrafast imaging in biomedical ultrasound, IEEE transactions on ultrasonics, ferroelectrics, and frequency control 61, 102(2014). [DOI] [PubMed] [Google Scholar]
- [34].Provost J, Papadacci C, Arango JE, Imbault M, Fink M, Gennisson J-L, Tanter M, and Pernot M, 3D ultrafast ultrasound imaging in vivo, Physics in Medicine & Biology 59, L1(2014). [DOI] [PMC free article] [PubMed] [Google Scholar]
- [35].Montaldo G, Tanter M, Bercoff J, Benech N, and Fink M, Coherent plane-wave compounding for very high frame rate ultrasonography and transient elastography, IEEE transactions on ultrasonics, ferroelectrics, and frequency control 56, 489(2009). [DOI] [PubMed] [Google Scholar]


