

Abstract
Sulforaphane (SFN), a natural anti-tumor compound from cruciferous vegetables, has been reported to induce protective autophagy to cancer cells, which might impair the anti-tumor efficiency of SFN. However, the accurate function and mechanism of SFN inducing autophagy in cancers are still obscure, especially in esophageal squamous cell carcinoma (ESCC), one of malignancies with high incidence in North China. Here, we mainly explored the potential function of autophagy upon SFN treatment in ESCC and molecular mechanism. We demonstrated that SFN could inhibit cell proliferation and induce apoptosis by activating caspase pathway. Moreover, we found activation of NRF2 pathway by SFN was responsible for the induction of autophagy and also a disadvantage element to the anti-tumor effects of SFN on ESCC, indicating that SFN might induce protective autophagy in ESCC. We, therefore, investigated effects of autophagy inhibition on sensitivity of ESCC cells to SFN and found that chloroquine (CQ) could neutralize the activation of SFN on NRF2 and enhance the activation of SFN on caspase pathway, thus improved the anti-tumor efficiency of SFN on ESCC in vitro and in vivo. Our study provides a preclinical rationale for development of SFN and its analogs to the future treatment of ESCC.
KEY WORDS: Sulforaphane, Autophagy, Chloroquine, NRF2, Esophageal squamous cell carcinoma
Graphical abstract
Autophagy inhibitor chloroquine could potentiate antitumor effects of sulforaphane (SFN) on esophageal squamous cell carcinoma by enhancing activation of SFN on caspase pathway and neutralizing activation of SFN to NRF2.
1. Introduction
Esophageal cancer (EC) is a most prevalent cancer, which ranks as the sixth deadly cause in cancers worldwide1. Esophageal squamous cell carcinoma (ESCC), as a prevailing subtype of EC, is an aggressive and lethal malignancy with high incidence in China1. Although drugs targeting specific molecules and combination chemotherapy have been developed to treat ESCC2,3, the 5 years survival rate is lower than 20% in advanced ESCC patients due to lymphatic metastasis or drug resistance4. Therefore, the development of new treatment strategies and drugs is imperatively required for ESCC.
Autophagy is a conserved evolutionarily cellular self-degradation process for maintaining energy homeostasis, in which the forming autophagosomes can capture intracellular aggregates and organelles, and deliver them to lysosomes to be degraded and recycled5,6. Autophagy plays a key role in plentiful diseases such as cancers, immune diseases, infectious disorders, and cardiovascular diseases7. Autophagy is recognized to play dual roles in cancers8, and it can promote cell death through excessive self-digestion to prevent of oxidative stress and genomic instability, while high activity of autophagy also helps cancer cells to cope with high proteotoxic and metabolic stress, thus promotes cell survival8. Late researches have indicated that autophagy has very major function in development and chemoresistance of cancers9,10, and inhibiting autophagy can improve the cytotoxicity of many chemotherapeutic and targeted therapeutic drugs11,12.
Nuclear factor-erythroid 2-related factor 2 (NRF2) is a pivotal regulator in maintaining redox homeostasis through effecting the level of antioxidant enzymes13. In general conditions, NRF2 interacts with Kelch-like ECH-associated protein 1 (KEAP1) and is degraded by proteasome13. For responding electrophiles and oxidative stress, NRF2 could dissociate from KEAP1 and translocate to cell nucleus, and then activate cytoprotective genes including NAD(P)H quinone oxidoreductase 1 (NQO1) and heme-oxygenase-1 (HO-1)14,15, overexpression of which in cancer cells could promote cell proliferation and survival16. Moreover, there are abundant evidences that have demonstrated that dysregulation of autophagy results in persistent activation of NRF2 in a P62-dependent manner17. Thus, the function of NRF2 and autophagy is interdependent in cancers.
Many natural ingredients have been utilized for preventing and treating diseases, particularly cancers18. Sulforaphane (SFN), a kind of isothiocyanate (ITC) extracted from cruciferous vegetables, and its analogs such as benzyl isothiocyanate (BITC) and phenethyl isothiocyanate (PEITC) have been demonstrated to have promising chemo-preventive activity in many cancer models, including prostate cancer and ovarian cancer19, 20, 21, 22. Researches showed that SFN and its analogs could induce autophagy through up-regulating autophagy-related protein microtubule-associated protein 1 light chain 3 (LC3) and recruiting LC3 to the autophagosomes23,24, which plays a protective effect to cancer cells20,25,26.
In this study, we aim to investigate the potential function of autophagy upon the basic active molecule SFN treatment in ESCC and the molecular mechanism. Firstly, the effects of SFN on proliferation, apoptosis and autophagy of ESCC cells were explored. Next, function and molecular mechanism of SFN on cell autophagy were investigated. Most importantly, we investigated effects of inhibiting autophagy using inhibitor chloroquine (CQ) and beclin-1-shRNA on chemoprevention of SFN to ESCC in vitro and in vivo as well as potential molecular mechanisms.
2. Materials and methods
2.1. Reagents
Primary antibodies recognizing LC3B (#3868), P62 (#8025), ATG5 (#4445), ATG7 (#4445), BCL-2 (#15071), BAX (#5023), cleaved-caspase 9 (#7237), beclin-1 (#3495 S) and HO-1 (#43966) as well as the secondary antibodies were purchased from Cell Signaling Technology (Danvers, MA, USA). Primary antibody NRF2 (sc-365,949) was purchased from Santa Cruz (Dallas, TX, USA). Beclin-1-shRNA and negative control shRNA (NC-shRNA) vectors were purchased from GenePharma Co., Ltd. (Shanghai, China). Sulforaphane (HY-13755), chloroquine (HY-17589), Z-VAD-FMK (HY-16658 B) and NRF2 inhibitor ML385 (HY-100523) were purchased from MedChemExpress (Monmouth Junction, NJ, USA).
2.2. Cell culture and transfection
EC9706 and ECa109 cell lines were purchased from Cell Bank of Type Culture Collection of the Chinese Academy of Sciences (Shanghai, China). Cells above were incubated with RPMI-1640 medium containing 10% FBS (BI, Israel), 100 U/mL of penicillin and 100 g/mL of streptomycin in an incubator with 5% CO2 and saturated humidity at 37 °C. Human normal esophageal Het-1A cells were obtained from American Type Culture Collection. After EC9706 cells were seeded in 6-well plates and transfected with NC-shRNA and beclin-1-shRNA vector using Lipofectamine™ 3000 (Invitrogen, Carlsbad, CA, USA), cells with NC-shRNA or beclin-1-shRNA were screened using 400 μg/mL G418 (Beijing Solarbio Science & Technology Co., Ltd., Beijing, China). The sequence of beclin-1-shRNA and NC-shRNA was 5′-GGA CAA CAA GTT TGA CCA TGC-3′ and 5′-GTT CTC CGA ACG TGT CAC GT-3′, respectively.
2.3. Cell proliferation assay
Cells were seeded in 96-well plates and disposed with different measures, and then 10 μL CCK-8 reagents (Beyotime Biotechnology, Shanghai, China) were dropped into per well. Optical densities of cells were detected by a microplate reader (Bio-Bad Laboratories, Hercules, CA, USA) after cells were cultured for another 4 h.
2.4. Clonogenic assay
After cells seeded in 6-well plates with 1 × 10³ cells each well were suffered with different treatment and cultured for 7 days, the formed clones rinsed with PBS for thrice were fixed with 1 mL of 4% paraformaldehyde for 20 min and stained with 1 mL of 1% crystal violet for 30 min. After washed with PBS, the clones were counted and analyzed by Image J software (NIH, Bethesda, MA, USA). Colony formation rate was counted according to Eq. (1):
| Colony formation rate (%) = Clone number in treatment group/Clone number in control group × 100 | (1) |
2.5. Cell apoptosis assay
Cell apoptosis was detected using Annexin V-FITC Apoptosis Detection Kit (Sungene Biotech Co., Ltd., Tianjin, China) as described in the instruction of manufacture. Briefly, cells inoculated in 6-well plates with 3 × 10⁵ cells each well were suffered with different treatment, and then collected and resuspended in 1 mL of 1 × buffer. 100 μL of cell suspension above was transferred into a new EP tube and incubated with 5 μL of Annexin V-FITC as well as 5 μL of propidium iodide (PI) at room temperature (r.t.) for 5 min in a dark environment. After 500 μL of PBS was dropped, apoptosis of cells was detected by a flow cytometer (BD Accuri™ C6, Piscataway, NJ, USA) and the results were analyzed by FlowJo 7.6 software (Tree Star Inc., Marina Del Rey, CA, USA).
2.6. Western blot analysis
As previously described27, proteins with equal quality (30 μg) were isolated using SDS-PAGE and shifted onto nitrocellulose membrane. After the membrane was blocked in 5% skimmed milk for 2 h at r. t., it was incubated with appropriate primary antibody overnight at 4 °C. Subsequently, the membrane was incubated with corresponding secondary antibody for 2 h at RT and the bands on membrane were visualized by enhanced chemiluminescence (ECL) reagent (Thermo Fisher Scientific, Waltham, MA, USA). The membrane was rinsed with PBS for thrice between the incubations described above. Every experiment was repeated separately for thrice and the bands were quantified by Image J software.
2.7. Immunofluorescence
Cells were seeded into culture plates with glass bottom (NEST Biotechnology Co., Ltd., China) at the density of 1 × 10⁴ cells/well at 37 °C overnight. After suffered different dispose, cells were fixed with 4% of paraformaldehyde for 20 min and penetrated using 0.1% Triton X-100 for 10 min at r. t., then cells were blocked using 5% of BSA for 1 h and incubated with primary antibody overnight at 4 °C. Subsequently, cells were incubated with secondary antibody anti-rabbit Alexa 488 (#4412) for 1 h and 10 μg/mL of DAPI for 15 min in a dark environment. Cells were rinsed with PBS for thrice between the incubations described above. Immunofluorescence of cells was observed under a confocal microscope (A1R/A1, Nikon, Tokyo, Japan).
2.8. mRFP-GFP-LC3 adenovirus infection
After ECa109 and EC9706 cells inoculated in 6-well plates with 3 × 10⁵ cells each well were cultured overnight and infected with mRFP-GFP-LC3 adenovirus (Hanbio Biotechnology Co., Ltd., Shanghai, China) for 48 h, cells were collected and inoculated in culture dishes with glass bottom at the density of 1 × 10⁴ cells/well. Cells were disposed with SFN (10 μmol/L) and bafilomycin A1 (100 nmol/L) for 24 h and fixed with 4% of paraformaldehyde for 20 min. After cells were rinsed with PBS for thrice, the fluorescent puncta in cells were supervised using a confocal microscopy (A1R/A1, Nikon).
2.9. Nuclear and cytoplasmic protein extraction
Proteins of nucleus and cytoplasm were extracted with a Nuclear and Cytoplasmic Protein Extraction Kit (P0027, Beyotime Biotechnology, Shanghai, China) as described in manufacturer's instruction. In brief, cells treated with 0, 5 and 10 μmol/L of SFN were collected and disposed with cytoplasmic extraction reagent A and PMSF for 15 min as well as cytoplasmic extraction reagent B for 1 min, followed by being centrifuged with 12,000×g at 4 °C for 5 min, and the supernatant sucked was the cytoplasmic proteins. Subsequently, nuclear extraction reagent and PMSF were added into the sediment above for 30 min, followed by being centrifuged with 12,000×g at 4 °C for 10 min, and the supernatant sucked was the nuclear proteins.
2.10. Animal studies
After 4–6 weeks athymic BALB/c male nude mice (Silikejingda Experimental Animal Ltd., Changsha, China) were adaptive fed for one week in IVC system, ECa109 cells (1 × 10⁷ cells in 0.2 mL PBS) were subcutaneously inoculated into the right flank of mice. When tumor volume reached 90–120 mm3, mice were divided randomly into four groups (n = 5): Control (saline 0.2 mL), SFN (5 mg/kg), CQ (60 mg/kg) and SFN + CQ. Drugs were injected intraperitoneally (i.p) into mice every other day for two weeks. The tumor was measured with caliper every day and the volume (V) was computed according to Eq. (2) for graphing tumor growth curve:
| (2) |
When treatment was finished, blood or serum from mice were used to measure routine haematological parameters and alanine aminotransferase (ALT), aspartate aminotransferase (AST), uric acid (UA) and creatinine (Cr), which are regular toxicity markers of kidney and liver. After mice were sacrificed, tumors were separated, weighed and fixed with 4% paraformaldehyde or stored at −80 °C. Heart, liver, kidney, spleen and lung tissues were weighed separately to calculate the relative organ weight (%), and then fixed with 4% paraformaldehyde buffer. Efficiency of drugs on tumor was evaluated according to “tumor inhibitory rate (%)” and “relative tumor growth rate (T/C%)”.
| (3) |
| (4) |
| (5) |
where V0 was tumor volume at the beginning of treatment, Vt was tumor volume at every treatment, TRTV was the mean of RTV in experiment group during the treatment, and CRTV was the mean of RTV in the control group during the treatment. T/C%≤40% and P < 0.05 were considered as effective treatment, T/C%>40% was considered as invalid treatment. Operation in animal experiment was agreed by the Animal Ethics Committee, Zhengzhou University, and accordance with the ARRIVE guidelines.
2.11. H&E staining and TUNEL assay
Liver, kidney and xenograft tissues fixed in 4% paraformaldehyde buffer were embedded using paraffin and sliced to 4 mm sections for hematoxylin and eosin staining (H&E staining) as described previously28. Moreover, cell apoptosis in sections from xenografts was detected by Terminal deoxynucleotidyl transferase dUTP nick end labeling (TUNEL) assay using In Situ Cell Death Detection Kit (Roche, Oceanside, CA, USA) as described previously29. The number of TUNEL-positive cells (brown-stained) was counted based on an examination of 1500 tumor cells of each section.
2.12. Statistical analysis
All cellular experiments were independently repeated no less than three times. Statistical analysis was done by SPSS 21.0 software (SPSS Inc., Chicago, IL, USA) and the cell experiment and Western blotting results are expressed as mean ± standard deviation (SD). Independent samples t-test or one-way ANOVA was employed to analyze the possible differences between groups, and statistical significance was estimated when P < 0.05.
3. Results
3.1. SFN inhibits proliferation of ESCC cells
After ECa109, EC9706 and Het-1A cells were treated with different concentrations (0, 10, 20, 40, 60 and 80 μmol/L) of SFN for 24, 48 and 72 h, cell viability was investigated by CCK-8 assay. The results demonstrate that SFN could inhibit proliferation of ECa109 and EC9706 cells along with the increase of SFN concentration and time (Fig. 1A). The IC50 values of SFN were 47.36 ± 1.68, 20.77 ± 1.32 and 15.20 ± 1.18 μmol/L in ECa109 cells and 75.30 ± 1.88, 40.97 ± 1.70 and 17.50 ± 1.24 μmol/L in EC9706 cells at 24, 48 and 72 h, respectively. However, SFN also had proliferation-inhibiting effects on Het-1A cells and the IC50 value was 34.09 ± 1.53 and 21.30 ± 1.33 μmol/L at 48 and 72 h, respectively.
Figure 1.

SFN inhibited proliferation of ESCC cells. (A) After ECa109 and EC9706 cells were incubated with various concentrations (0, 10, 20, 40, 60 and 80 μmol/L) of SFN for 24, 48 and 72 h, viability of cells was determined by CCK-8 assay (n = 3). (B) Effects of SFN on proliferation of normal esophageal Het-1A cells (n = 3). (C) Clonogenic assay of cells treated with SFN (0, 5, and 10 μmol/L) for 7 days and the number of colonies in three independent experiments were quantified and statistically analyzed (n = 3). ∗∗∗P < 0.001 compared to control group.
Clonogenic assay was performed to further confirm the effects of SFN on cell proliferation ability after ECa109 and EC9706 cells, respectively, were treated with 0, 5 and 10 μmol/L SFN. As shown in Fig. 1C, SFN significantly inhibited the colony formation of ECa109 and EC9706 cells. The results indicate that SFN could suppress proliferation of ESCC cells in a time- and dose-dependent manner.
3.2. SFN induces apoptosis of ESCC cells by activating caspase pathway
Induction of apoptosis is a prominent mode of cytotoxicity for many chemotherapeutic drugs, we therefore investigated cell apoptosis by flow cytometry after ECa109 and EC9706 cells were treated with SFN (0, 10, 20, and 30 μmol/L) for 72 h. As shown in Fig. 2A, SFN significantly increased the apoptotic population of ECa109 and EC9706 cells in a dose-dependent manner compared to control group. Moreover, we analyzed the expression of several apoptotic markers, such as cleaved-caspase 9, pro-apoptotic protein BAX and anti-apoptotic protein BCL-2 by Western blot in ECa109 and EC9706 cells treated with 10 μmol/L of SFN for 0, 3, 6, 12 and 24 h, respectively. As shown in Fig. 2B, SFN increased the levels of cleaved-caspase 9 in a time-dependent manner, but not BAX and BCL-2, which indicated that SFN could induce cell apoptosis through activating caspase pathway.
Figure 2.

SFN induced apoptosis of ESCC cells by activating caspase pathway. (A) Apoptosis of ECa109 and EC9706 cells treated with SFN (0, 10, 20 and 30 μmol/L) for 72 h was analyzed by flow cytometry. Late stage apoptosis rate (Q2) and early stage apoptosis (Q4) of cells were quantified (n = 3). (B) Expression of apoptotic markers BCL-2, BAX and cleaved-caspase 9 was investigated by Western blot after ECa109 and EC9706 cells were treated with 10 μmol/L of SFN for 0, 3, 6, 12 and 24 h (n = 3). (C) Viability of ECa109 and EC9706 cells treated with SFN (40 μmol/L) and Z-VAD-FMK (20 μmol/L) alone or combination for 48 h was detected by CCK-8 assay (n = 3). (D) Apoptosis of ECa109 and EC9706 cells treated with SFN (40 μmol/L) and Z-VAD-FMK (20 μmol/L) alone or combination for 48 h was analyzed by flow cytometry. Late stage apoptosis rate (Q2) and early stage apoptosis (Q4) of cells were quantified (n = 3). ∗P < 0.05, and ∗∗∗P < 0.001 compared to control group; ###P < 0.001 compared to single-drug treatment group.
To further confirm that SFN-induced cell death is mediated by an activation of caspase pathway, Z-VAD-FMK (20 μmol/L), a specific inhibitor of caspase, was used alone or combined with SFN (40 μmol/L) to treat ECa109 and EC9706 cells, then cell proliferation and apoptosis were detected by CCK-8 assay and flow cytometry, respectively. As shown in Fig. 2C, Z-VAD-FMK had no obvious effects on cell proliferation, while the inhibiting effects of SFN on cell proliferation became weaken after cells treated with Z-VAD-FMK, indicating that Z-VAD-FMK could impair the inhibiting effects of SFN on proliferation. Moreover, Z-VAD-FMK abolished partly the inducing-effects of SFN on cell apoptosis (Fig. 2D). In brief, our data demonstrate that SFN could induce cell apoptosis by activating caspase pathway in ESCC cells.
3.3. SFN induces autophagy by activating autophagy flux in ESCC cells
To explore effects of SFN on autophagy of ESCC cells, we firstly investigated the expression of LC3B-Ⅱ and P62, the key proteins in autophagy, by Western blot after ECa109 and EC9706 cells were treated with 10 μmol/L of SFN for 0, 3, 6, 12 and 24 h, respectively. As shown in Fig. 3A, expression of increased LC3B-II and decreased P62 was observed in ESCC cells along with the extension of treatment time, indicating that SFN could affect expression of LC3B-II and P62 in a time-dependent manner in ESCC. Next, we detected the distribution and expression of LC3 by immunofluorescence assay and Western blot after ECa109 and EC9706 cells were treated with SFN (10 μmol/L) and CQ (20 μmol/L), an autophagy lysosomal inhibitor, alone or combined for 24 h. The results of immunofluorescence show that SFN and CQ alone markedly induced the aggregation of GFP-LC3 puncta in ESCC cells, while LC3 level had a further elevation when cells were treated with SFN combined with CQ compared to cells treated with SFN or CQ alone (Fig. 3B). In Western blot experiment, CQ alone promoted expression LC3B-II and P62, while in cells treated with CQ combined with SFN, expression of LC3B-II increased and P62 had a mild decrease compared to cells treated with CQ, indicating that SFN might promote the autophagy flux in ESCC cells (Fig. 3C). In addition, in order to further confirm the autophagy-inducing effects of SFN, fluorescent dots were analyzed by confocal microscopy after ECa109 and EC9706 cells were infected with mRFP-GFP-LC3 adenovirus vector and treated with 10 μmol/L of SFN or 100 nmol/L of bafilomycin A1, a regular function of lysosome inhibitor, for 24 h. As shown in Fig. 3D, compared to control cells, many yellow puncta were observed in cells treated with bafilomycin A1, while many yellow puncta and red puncta were observed in cells treated with SFN because of the green immunofluorescence quenched in the process of autophagosomes transforming to autolysosomes, indicating that SFN could promote the formation of autophagosomes and autolysosomes. Collectively, our data indicate that SFN could induce autophagy of ESCC cells by promoting the autophagy flux.
Figure 3.

SFN induced autophagy flux in ESCC cells. (A) Expression of LC3 and P62 was investigated by Western blot after ECa109 and EC9706 cells were treated with 10 μmol/L of SFN for different times (0, 3, 6, 12 and 24 h), respectively (n = 3). (B) Puncta of LC3 were detected by immunofluorescence assay under a confocal microscope after ECa109 and EC9706 cells were treated with SFN (10 μmol/L) and CQ (20 μmol/L) for 24 h (n = 3). (C) Expression of P62 and LC3 was investigated by Western blot after ECa109 and EC9706 cells were treated with SFN (10 μmol/L) and CQ (20 μmol/L) alone or combination for 48 h (n = 3). (D) autophagosomes (Green + Red) and autophagolysosomes (Red) were observed and quantified using a confocal microscopy after ECa109 and EC9706 cells infected with mRFP-GFP-LC3 adenovirus were treated with SFN (10 μmol/L) or bafilomycin A1 (100 nmol/L) for 24 h (n = 3). ∗P < 0.05, ∗∗P < 0.01 and ∗∗∗P < 0.001 compared to control group; #P < 0.05, ##P < 0.01 and ###P < 0.001 compared to single-drug treatment group. Scale = 50 μm.
3.4. SFN induces protective autophagy by activating NRF2 signaling in ESCC cells
To further explore molecular mechanism of SFN inducing autophagy, we firstly investigated the expression of autophagy-related gene ATG3, ATG5 and ATG7 by Western blot after ECa109 and EC9706 cells were treated with 10 μmol/L of SFN for 0, 3, 6, 12 and 24 h, respectively. As shown in Fig. 4A, the expression of ATG3, ATG5 and ATG7 has no changes after ESCC cells were treated with SFN, indicating that SFN inducing autophagy of ESCC cells had no relationship with autophagy-related genes.
Figure 4.

SFN induced protective autophagy by activating NRF2 pathway in ESCC cells. (A) Expression of ATG5, ATG7 and ATG3 was investigated by Western blot analysis after ECa109 and EC9706 cells were treated with 10 μmol/L of SFN for different times (0, 3, 6, 12 and 24 h), respectively (n = 3). (B) Expression of NRF2 in nuclear and cytoplasm was detected by Western blot after ECa109 and EC9706 cells were treated with SFN (0, 5 and 10 μmol/L) for 48 h, respectively (n = 3). (C) Expression of NRF2 and HO-1 was investigated by Western blot after ECa109 and EC9706 cells were treated with ML385 (0, 5, 10, 20 and 30 μmol/L) for 48 h, respectively (n = 3). (D) Expression of LC3 and P62 was determined by Western blot after ECa109 and EC9706 cells were treated with SFN (10 μmol/L) and ML385 (20 μmol/L) alone or combination for 48 h (n = 3). (E) Viability of ECa109 and EC9706 cells was detected using CCK-8 assay after cells were treated with ML385 (0, 5, 10, 50, 100 and 200 μmol/L) for 48 and 72 h, respectively (n = 3). (F) Clone formation ability of ECa109 and EC9706 cells was investigated by clonogenic assay after cells were treated with SFN (0, 5 and 10 μmol/L) for 7 days, respectively, and the number of colonies in three independent experiments were quantified and statistically analyzed (n = 3). ∗∗P < 0.01 and ∗∗∗P < 0.001 versus control group; ###P < 0.001 versus single-drug treatment group.
SFN has been previously shown to stimulate NRF2 signaling in many cancers30 and the translocation of NRF2 to the nuclear is a crucial step for its activation13. To determine whether SFN increased the transcriptional activity of NRF2 in ESCC, the expression of NRF2 in cytoplasm and nuclear was evaluated by Western blot analysis after ECa109 and EC9706 cells were treated with SFN (0, 5, and 10 μmol/L), GAPDH and histone H3 were used as markers of cytosolic and nuclear fractions, respectively. As shown in Fig. 4B, NRF2 was mainly expressed in cell nucleus and SFN increased the expression of NRF2 in nucleus of ECa109 and EC9706 cells, indicated that SFN could significantly activate NRF2 signaling in human ESCC cells. In addition, we treated cells with ML385 (0, 5, 10, 20, and 30 μmol/L), a specific NRF2 inhibitor, for 24 h, and found ML385 decreased expression of NRF2 and HO-1 in a dose-dependent manner in ESCC (Fig. 4C), while when we treated ECa109 and EC9706 cells with 10 μmol/L of SFN and 20 μmol/L of ML385 alone or combined for 24 h, we found ML385 alone inhibited LC3B-II and promoted P62 expression, and thus relieved the increase of LC3B-II and decrease of P62 caused by SFN when combined with SFN (Fig. 4D). Moreover, we also investigated effects of ML385 on cell proliferation and colony formation, and found that ML385 significantly inhibited cell viability and colony formation (Fig. 4E and F), indicating that targeting NRF2 could inhibit cancer and the activation of NRF2 was a disadvantage element for anti-tumor effects of SFN, just as shown in previous reports31,32. These results indicate that SFN inducing autophagy was mediated by activating NRF2 pathway, which might impair the sensitivity of ESCC cells to SFN, that is, SFN might induce protective autophagy in ESCC cells.
3.5. Autophagy inhibition improves antitumor responses of ESCC cells to SFN
According to the results above, we supposed that autophagy inhibition might improve sensitivity of ESCC cells to SFN, we, therefore, explored the effects of inhibiting autophagy by CQ on the anti-tumor effects of SFN through detecting proliferation, colony formation and apoptosis of ESCC cells treated with SFN combined with CQ. Cell proliferation was firstly detected by CCK-8 assay after ECa109 and EC9706 cells were treated with 20 μmol/L of SFN alone or combined with 20 μmol/L of CQ and serum-free starvation, respectively, for 72 h. As shown in Fig. 5A, CQ enhanced while serum-free starvation impaired the proliferation-inhibiting effects of SFN (P < 0.001). We also investigated cell proliferation by CCK-8 assay after ECa109 and EC9706 cells were treated with different concentration of SFN (0, 10, 20, 40 and 80 μmol/L) alone or combined with 20 μmol/L CQ for different times (24, 48 and 72 h). The results also demonstrate that CQ enhanced the proliferation-inhibiting effects of SFN (P < 0.05, P < 0.01 or P < 0.001, Fig. 5B). Subsequently, colony formation ability of ESCC cells was detected by clonogenic assay after ECa109 and EC9706 cells were treated with 5 μmol/L of SFN alone or combined with 10 μmol/L of CQ for 7 days. The results demonstrate that SFN and CQ co-treatment strongly reduced the number of colonies formed compared to cells treated with SFN alone (P < 0.01 or P < 0.001, Fig. 5C). Moreover, we explored cell apoptosis by flow cytometry after ECa109 and EC9706 cells were treated with 10 μmol/L of SFN and 20 μmol/L of CQ alone or combination for 72 h. As shown in Fig. 5D, CQ had no obvious effects on cell apoptosis, while compared to cells treated with SFN alone, SFN and CQ co-treatment significantly increased apoptosis rates of ECa109 and EC9706 cells, which indicated that inhibition of autophagy by CQ could promote SFN-induced apoptosis in ESCC cells. The results above indicate that autophagy inhibition with CQ could enhance the anti-tumor effects of SFN on ESCC.
Figure 5.

Autophagy inhibition by CQ improved antitumor responses of ESCC cells to SFN. (A) Cell proliferation was detected by CCK-8 assay after ECa109 and EC9706 cells were treated with 20 μmol/L of SFN alone or combined with 20 μmol/L of CQ or serum-free starvation, respectively, for 72 h (n = 3). (B) Cell proliferation was detected by CCK-8 assay after ECa109 and EC9706 cells were treated with SFN (0, 20, 40, and 80 μmol/L) alone or combined with 20 μmol/L of CQ for 24, 48 and 72 h, respectively (n = 3). (C) Clone formation ability of cells was investigated by clonogenic assay after ECa109 and EC9706 cells were treated with 5 μmol/L of SFN and 10 μmol/L of CQ alone or combination for 7 days, and the number of colonies in three independent experiments was quantified and statistically analyzed (n = 3). (D) Apoptosis of ECa109 and EC9706 cells treated with SFN (10 μmol/L) and CQ (20 μmol/L) alone or combination for 72 h was analyzed by flow cytometry. Late stage apoptosis rate (Q2) and early stage apoptosis (Q4) of cells were quantified. (E) Expression of BCL-2, BAX and cleaved-caspase 9 was investigated by Western blot after ECa109 and EC9706 cells were treated with SFN (10 μmol/L) and CQ (20 μmol/L) alone or combination for 48 h, respectively (n = 3). (F) Expression of NRF2 in nuclear and cytoplasm was detected by Western blot after ECa109 and EC9706 cells were treated with SFN (10 μmol/L) and CQ (20 μmol/L) alone or combination for 48 h (n = 3). (G) Puncta of NRF2 were detected by immunofluorescence assay under a confocal microscope after ECa109 and EC9706 cells were treated with SFN (10 μmol/L) and CQ (20 μmol/L) alone or combination for 24 h (n = 3). ∗P < 0.05, ∗∗P < 0.01 and ∗∗∗P < 0.001 versus control group; #P < 0.05, ##P < 0.01 and ###P < 0.001 versus single-drug treatment group. Scale = 50 μm.
In order to gain some insights in the molecular mechanisms of CQ enhancing the anti-tumor effects of SFN on ESCC, expression of proteins in apoptosis pathway was detected by Western blot after ECa109 and EC9706 cells were treated with 10 μmol/L of SFN and 20 μmol/L of CQ alone or combined for 48 h. The results are shown as Fig. 5E, SFN and CQ co-treatment decreased BCL-2 and increased cleaved-caspase 9 expression compare with control or SFN-treated cells (P < 0.001). Moreover, expression of NRF2 in nucleus and cytoplasm was investigated by Western blot and immunofluorescence assay after ECa109 and EC9706 cells were treated as described above. As shown in Fig. 5F, NRF2 had no obvious expression in the cytoplasm of ECa109 and EC9706 cells, SFN promoted the expression of NRF2 in cell nucleus, while CQ markedly inhibited the activation of SFN to NRF2 when cells were treated with CQ and SFN combination (P < 0.001). The results of immunofluorescence assay further demonstrate the low expression of NRF2 (green fluorescence) in nucleus of cells co-treated with SFN and CQ (Fig. 5G). These results indicate that inhibition of autophagy by CQ could improve the sensitivity of ESCC cells to SFN through eliminating the activation of SFN to NRF2 in nucleus.
In addition, we also investigated effects of inhibiting autophagy by down-regulating beclin-1, an important protein to regulate early step of autophagosome formation, in EC9706 cells using beclin-1-shRNA on the sensitivity of ESCC cells to SFN. The results are shown as Fig. 6, beclin-1-shRNA down-regulated markedly expression of beclin-1, and improved the proliferation- and colony formation-inhibiting effects of SFN on ESCC cells, suggesting that inhibiting autophagy by down-regulating autophagy protein beclin-1 also could improve the anti-tumor effects of SFN on ESCC.
Figure 6.

Autophagy inhibition by downregulating beclin-1 improved antitumor responses of ESCC cells to SFN. (A) Expression of beclin-1 was investigated by Western blot after EC9706 cells were transfected with NC-shRNA or beclin-1-shRNA (n = 3). (B) Viability of EC9706 cells with beclin-1-shRNA or NC-shRNA was detected using CCK-8 assay after cells were treated with SFN (0, 5, 25, 50 and 100 μmol/L) for 72 h (n = 3). (C) Colony formation ability of EC9706 cells with beclin-1-shRNA or NC-shRNA was investigated by clonogenic assay after cells were treated with 5 μmol/L SFN for 7 days, and the number of colonies in three independent experiments was quantified and statistically analyzed (n = 3). ∗∗∗P < 0.001 versus control group; #P < 0.05 and ###P < 0.001 versus single-drug treatment group.
3.6. CQ increases chemosensitivity of ESCC cells to SFN in vivo
We investigated the effects of CQ on the anti-tumor efficiency of SFN on ESCC using xenografts in nude mice, the results are shown in Fig. 7. SFN and CQ combination significantly inhibited tumor growth, the inhibition efficiency was obvious better than the two single-drug treatment groups (Fig. 7A and B), and the weight of tumors in CQ + SFN group were less than that in control or the two single-drug treatment groups (Fig. 7C). The anti-tumor efficiency of the treatments was shown as Table 1, tumor suppression rate were 30.75%, 24.32%, and 63.48%, respectively, and relative tumor growth rate (T/C%) were 58.57%, 72.46% and 39.77% (P < 0.05) in SFN group, CQ group, and combination group, respectively. According to the judgment criteria, SFN and CQ alone in this dosage had no obvious efficiency on tumor growth, while the combination of SFN and CQ had obvious anti-tumor effects on ESCC. Moreover, tumor tissues from nude mice were analyzed by H&E staining and TUNEL assay (Fig. 7D). In the results of H&E staining, some morphological changes associated with cell apoptosis such as condensed nuclei, cytoplasmic vacuolization and cell shrinkage were observed in SFN and SFN + CQ group, especially in the latter group. The results of TUNEL assay show that there were large number of TUNEL positive cells (brown staining) in SFN and SFN + CQ group compared with that in control group, especially in SFN + CQ group.
Figure 7.

CQ increased chemosensitivity of ESCC cells to SFN in vivo (n = 5). (A) Tumors from xenograft mice at the end of treatment (n = 5). (B)Tumor growth curves of every group (n = 5). (C) Tumor weight of every group at the end of treatment (n = 5). (D) Cells apoptosis of tumor tissues were analyzed by H&E staining and TUNEL assay (n = 5). (E) The body weight curve of every group (n = 5). (F) H&E staining of liver and kidney tissues (n = 5). (G) Expression of LC3, P62, NRF2, HO-1, BCL-2, BAX and cleaved-caspase 9 in tumor tissues were analyzed by Western blot analysis (n = 3). ∗P < 0.05, ∗∗P < 0.01 and ∗∗∗P < 0.001 versus control group; ##P < 0.01 and ###P < 0.001 versus single-drug treatment group. Scale = 100 μm.
Table 1.
Relative growth rates of tumor and tumor inhibitory rates.
| Group | RTV | T/C (%) | Tumor weight (g) | Tumor inhibitory rate (%) |
|---|---|---|---|---|
| Control | 8.29 | – | 1.24 ± 0.09 | – |
| SFN | 4.86 | 58.57 | 0.86 ± 0.19 | 30.75 |
| CQ | 6.01 | 72.46 | 0.94 ± 0.08 | 24.32 |
| SFN + CQ | 3.30 | 39.77∗ | 0.45 ± 0.23 | 63.48 |
After mice were treated with SFN and CQ alone or combination for two weeks, the xenografts were collected and weighed separately to calculated “tumor inhibitory rate (%)” and “relative tumor growth rate (T/C%)”. ∗P < 0.05 compared to control group.
The toxicity of SFN and CQ to nude mice was primary evaluated through measuring body weight, toxicity markers of kidney and liver such as aminotransferase (ALT), aspartate aminotransferase (AST), uric acid (UA) or creatinine (Cr), haematological parameters, as well as relative organ weights. The results show that body weight of mice in every group had no obvious differences during the therapeutic period (Fig. 7E) and no obvious pathological lesions associated with the treatment were observed in liver and kidney according to H&E staining results (Fig. 7F). Moreover, compared to control group, no significant differences in plasma levels of ALT, AST, UA or Cr, haematological parameters as well as relative organ weights were observed in every experiment group (Table 2, Table 3, Table 4), indicating that therapeutic doses of SFN and CQ had no obvious toxicity to nude mice.
Table 2.
Level of ALT, AST, UA and Cr in serum of xenograft mice.
| Parameter | Control | SFN | CQ | SFN + CQ |
|---|---|---|---|---|
| AST/GOT (U/L) | 18.97 ± 5.41 | 20.24 ± 4.17 | 18.61 ± 2.85 | 18.24 ± 3.83 |
| ALT/GPT (U/L) | 3.36 ± 1.78 | 5.34 ± 1.92 | 6.27 ± 1.35 | 5.90 ± 2.16 |
| UA (μmol/L) | 131.82 ± 18.17 | 139.09 ± 7.25 | 127.27 ± 5.63 | 119.09 ± 16.33 |
| Cr (μmol/L) | 23.97 ± 5.46 | 23.38 ± 3.69 | 21.70 ± 3.97 | 16.42 ± 2.38 |
At the end of treatment, serum samples were used to measure the levels of ALT, AST, UA or Cr using their assay kit, respectively, for evaluating the toxicity of drugs to liver and kidney of mice. No statistically significant differences were found.
Table 3.
Haematological parameters of xenograft mice.
| Parameter | Control | SFN | CQ | SFN + CQ |
|---|---|---|---|---|
| WBC ( × 109/L) | 5.41 ± 1.08 | 4.18 ± 0.48 | 4.71 ± 0.99 | 4.03 ± 0.66 |
| RBC ( × 1012/L) | 8.83 ± 0.24 | 8.59 ± 0.83 | 8.60 ± 0.38 | 8.91 ± 0.34 |
| HGB (g/L) | 145.50 ± 3.27 | 139.00 ± 13.78 | 140.67 ± 6.31 | 143.50 ± 5.50 |
| HCT (%) | 44.52 ± 1.28 | 42.62 ± 4.07 | 43.05 ± 1.75 | 44.12 ± 1.78 |
| MCV (fL) | 50.40 ± 0.37 | 49.62 ± 0.55 | 50.10 ± 0.78 | 49.50 ± 0.44 |
| RDW (%) | 16.47 ± 0.19 | 16.18 ± 0.08 | 16.38 ± 0.08 | 16.07 ± 0.16 |
| MCH (pg) | 14.77 ± 0.54 | 15.20 ± 0.65 | 15.28 ± 0.28 | 15.62 ± 0.41 |
| MCHC (g/L) | 327.00 ± 3.41 | 326.17 ± 3.82 | 326.67 ± 4.50 | 325.33 ± 3.08 |
| PLT ( × 109/L) | 889.00 ± 101.40 | 867.83 ± 134.68 | 941.00 ± 45.99 | 935.67 ± 107.55 |
| MPV (fL) | 6.78 ± 0.26 | 6.62 ± 0.17 | 6.52 ± 0.13 | 6.67 ± 0.19 |
At the end of treatment, blood samples were used to measure the routine haematological parameters. No statistically significant differences were found.
Table 4.
Relative organ weights (%) of xenograft mice.
| Organ | Control | SFN | CQ | SFN + CQ |
|---|---|---|---|---|
| Heart | 0.54 ± 0.07 | 0.63 ± 0.13 | 0.59 ± 0.06 | 0.59 ± 0.10 |
| Liver | 6.38 ± 0.34 | 6.74 ± 0.35 | 6.42 ± 0.26 | 5.72 ± 0.73 |
| Spleen | 0.77 ± 0.07 | 0.79 ± 0.14 | 0.78 ± 0.09 | 0.72 ± 0.12 |
| Lung | 0.69 ± 0.07 | 0.72 ± 0.19 | 0.66 ± 0.07 | 0.64 ± 0.06 |
| Left kidney | 0.84 ± 0.12 | 0.84 ± 0.19 | 0.86 ± 0.08 | 0.82 ± 0.08 |
| Right kidney | 0.83 ± 0.08 | 0.98 ± 0.17 | 0.79 ± 0.07 | 0.81 ± 0.07 |
During necropsy, the heart, liver, kidney, spleen and lung tissues were collected and weighed separately to calculate the relative organ weight (organ weight/body weight × 100). No statistically significant differences were found.
Molecular mechanism of CQ enhancing the anti-tumor effects of SFN in vivo was explored by Western blot using the tumors from nude mice. As shown in Fig. 7G, compared to control group, SFN increased of LC3B-Ⅱ and decreased P62 expression (P < 0.001). Compared to SFN group, the level of accumulated LC3B-Ⅱ and P62 further increased in SFN and CQ co-treatment group, indicating SFN induced autophagy of ESCC cells and CQ inhibited the inducing effects of SFN on autophagy in vivo. In addition, SFN and CQ co-treatment inhibited the expression of NRF2 and HO-1 (P < 0.001), and activated the caspase pathway through decreasing BCL-2 and increasing cleaved-caspase 9 expression (P < 0.001) compare with that SFN alone. These results are accordance with the data we demonstrate in vitro, which further indicate that SFN could inhibit ESCC through activating apoptosis pathway while promote protective autophagy to ESCC cells by activating NRF2 pathway, and autophagy inhibitor CQ could enhance the anti-tumor effects of SFN on ESCC by inhibiting the activation of SFN to NRF2.
4. Discussion
ESCC is one kind of malignant gastrointestinal cancer and 90% of ESCC happens in countries of Asia33. Although many new therapeutic and diagnostic measures have been employed, ESCC is still beyond cure because of its inferior prognosis and high relapse rate, especially the chemoresistance. Thus, exploration of new effective drugs for ESCC treatment is significantly urgent.
Many evidences indicated that natural ingredients may be dominant drugs for cancer treatment, for example, curcumin, paclitaxel, resveratrol, epigallocatechin gallate19,34 and SFN19,34,35. SFN is an anti-tumor ingredient from cruciferous vegetables, which has been suggested as a promising anticancer agent without significant adverse effects by recent clinical studies30. In this study, we discovered that SFN was able to inhibit viability and induce apoptosis of ESCC cells by activating caspase pathway (Figure 1, Figure 2). Research has been showed that SFN can block tumor initiation via inhibiting phase Ⅰ enzymes, which could promote tumorigenesis by converting procarcinogens to carcinogens, and inducing phase Ⅱ enzymes, which could prevent tumorigenesis by detoxifying and promoting excretion of carcinogens36. Moreover, SFN can suppress cancer development through affecting various molecular targets in proliferation, apoptosis, and cell cycle36, such as BCL-2 family proteins, caspases, and cyclin-dependent kinases37 as well as proteins in MAPK and PI3K/AKT/mTOR pathway36, and effectively enhance the anticancer activity of chemotherapeutic drugs by inhibiting tumor stem cell growth38. In addition, SFN could activate NRF2, thus regulates its downstream cytoprotective genes through modifying KEAP1 cysteine residues39. In the recent years increasing evidences suggest that NRF2 plays seemingly contradictory roles in cancer40,41, pharmacological activation of NRF2 is, therefore, regarded as a promising therapeutic approach for several chronic diseases, such as cardiovascular, neurodegenerative, and metabolic diseases42. However, in the last decade, many studies have described that NRF2 is activated in cancers and high activity of NRF2 can promote cell viability and invasion40,43, as well as lead to excessive expression of specific antioxidant enzymes, phase II enzymes and transporters, which will hinder drugs entering into cells and block decomposition and efflux of drugs, and result in the decrease of drugs efficacy40. In this study, we demonstrate SFN could activate NRF2 in ESCC and NRF2 inhibitor ML385 could inhibit proliferation and clonogenic formation of ESCC cells (Fig. 4E and F), indicating that the activation of NRF2 might be a disadvantage element for the anti-tumor effects of SFN on ESCC.
Autophagy, an evolutionarily conserved catabolic process, could degrade cytoplasmic components such as proteins and defective organelles7. Each stage of autophagy could be tightly regulated by specific autophagy complexes44. At the initial stage of autophagy, Unc-51 like autophagy activating kinase 1 (ULK1) protein kinase complex is activated and localized to the phagophore for activating class Ⅲ PI3K45, then beclin-1 is involved in class III PI3K complex to regulate an early step of autophagosome formation45. Meanwhile, LC3-I in cell cytoplasm is sheared and modified by ubiquitination, and combines with PE on the surface of autophagosome membrane to form LC3-II for binding with degraded substrates, the process above is catalyzed by ATG7, E2-like ATG3, and the ATG12–ATG5 conjugate46. Moreover, P62 (sequestosome) protein preferentially recognizes and recruits polyubiquitinated proteins into the phagocytic vesicles through interacting with LC3-II, and then degrades together with of these proteins47. Therefore, increase of LC3-II companied with decrease of P62 was recognized the mark of autophagy activity48. In recent years, autophagy has been recognized as a vital mechanism in the chemoresistance induced by NRF249. Research has shown that NRF2 promotes resistance of cisplatin by activating autophagy in ovarian cancer14 and isodeoxyelephantopin could induce protective autophagy through regulating NRF2-P62-KEAP1 feedback loop in lung cancer50. However, the cross-talk of NRF2 and autophagy is still obscure. HO-1 is the main cytoprotective gene downstream of NRF215, and some evidences indicated that chemotherapy drugs could promote ROS-dependent apoptosis and autophagy via the NRF2/HO-1 pathway51,52.
There are contradictory opinions about the roles of autophagy in cancer progression8, and autophagy can function as a survival mechanism or as an alternative pro-apoptosis mechanism in tumors7. Majority studies support that SFN could induce protective autophagy20,25, while autophagy is also a initiator or executioner of cell death53. In the present study, we demonstrated that SFN could induce cell autophagy by promoting the formation of autophagosome and autolysosome in ESCC (Fig. 3), but SFN had no effects on ATGs, which indicated that SFN inducing autophagy might have no relationship with autophagy-related genes (Fig. 4A). To explore the molecular mechanism of SFN inducing autophagy, we investigated effects of SFN on expression of NRF2 in ESCC and found SFN promoted the expression of NRF2 in nucleus (Fig. 4B), while NRF2 inhibitor ML385 could inhibit autophagy and impair the inducing effects of SFN on cell autophagy by inhibiting expression of NRF2 and HO-1 (Fig. 4C and D), indicating that SFN could induce autophagy in ESCC cell by activating NRF2. Moreover, the results that NRF2 inhibitor ML385 inhibiting proliferation and colony formation of ESCC cells (Fig. 4E and F) suggest that SFN activating NRF2 might induce a protective autophagy for ESCC cells, and thus impairs the anti-tumor effects of SFN on ESCC.
Recently studies have been reported that autophagy can promote chemoresistance in cancers, including ESCC54, just as we show above that SFN induced the protective autophagy for ESCC cells. Large numbers of researches, therefore, highlight the potential of autophagy as a therapeutic target to overcome drug-resistant problems in tumor therapy, and inhibiting autophagy using miRNA, 3-methyl adenine (3-MA) or CQ improves chemoresistance in many cancers55. Thus, targeting autophagy may be a potential strategy for eliminating therapeutic resistance in cancers. In our study, we confirm that inhibiting autophagy using CQ or beclin-1 shRNA could enhance the sensitivity of ESCC cells to SFN (Fig. 5A–D and Fig. 6). We explored the molecular mechanism and found that CQ could enhance the activating effects of SFN on caspase pathway and offset the activation of SFN on NRF2 in ESCC. Furthermore, we validated that CQ improved significantly the inhibition efficiency of SFN on tumor growth in nude mice and the co-treatment of CQ and SFN had no obvious toxicity. In addition, to highlight effects of autophagy on the antitumor effects of SFN, the dosage of SFN we chose to treat animals was lower (5 mg/kg) than that other studies21,56 and the volume of tumor at the beginning of treatment was bigger (90–120 mm3) than that in other studies (60–80 mm3)27,57, which caused that SFN alone in this study had no obvious anti-tumor effects on ESCC according to our judgment criteria. The molecular mechanism that CQ enhancing the sensitivity of xenografts to SFN was accordance with that we confirmed in vitro.
5. Conclusions
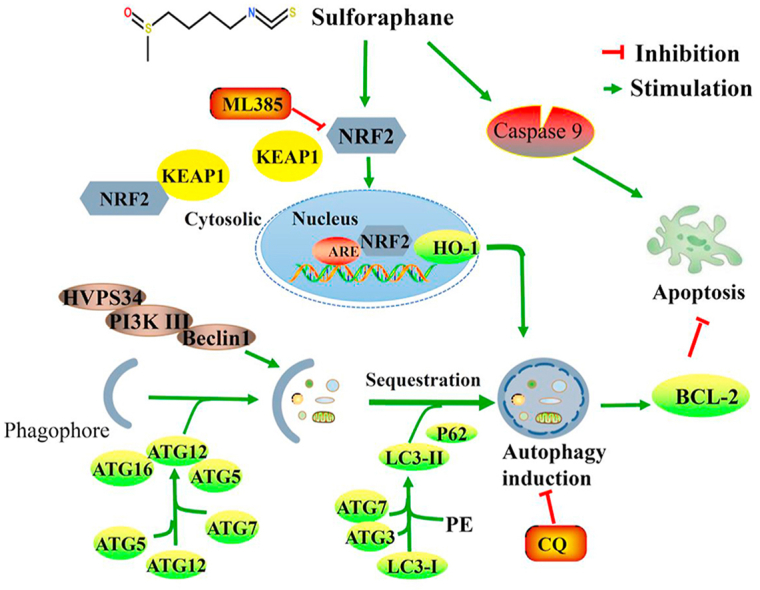
Our findings demonstrate that SFN could inhibit ESCC by activating caspase pathway while induce protective autophagy to ESCC cells by activating NRF2, and CQ could enhance the sensitivity of ESCC cells to SFN in vitro and in vivo by enhancing the activating effects of SFN on caspase pathway and neutralizing the activation of SFN to NRF2 in ESCC (Fig. 8). Our study provides a preclinical rationale for development of SFN and its analogs to the future treatment of ESCC.
Figure 8.

Working model summarizing the results obtained in this work. A short schematic diagram that how NRF2 regulates autophagy induced by SFN in ESCC.
Acknowledgments
This work was supported by the Key Project of Science and Technology, Department of Science and Technology of Henan Province (Grant No. 202102310127, China), Key Research Project of University, Department of Education of Henan Province (Grant No. 21A350011, China), Henan Provincial University Science and Technology Innovation Team, Department of Education of Henan Province (Grant No. 19IRTSTHN001, China) and the National Science and Technology Major Project of China (Grant No. 2018ZX10302205).
Footnotes
Peer review under responsibility of Institute of Materia Medica, Chinese Academy of Medical Sciences and Chinese Pharmaceutical Association.
Supporting data to this article can be found online at https://doi.org/10.1016/j.apsb.2020.12.009.
Author contributions
Guiqin Hou and Zhaoming Lu conceived the project. Guiqin Hou, Zhaoming Lu, Wen Zhao, and Jianying Zhang designed the experiments and secured funding. Yandan Ren, Li Yang, Ang Jia, Yi Hu, Yu Zhao performed the experiments. Zhaoming Lu, Wuduo Zhao and Bin Yu analyzed the data. Zhaoming Lu and Yandan Ren wrote the manuscript. Guiqin Hou provided critical discussion, editing and final approval of the manuscript.
Conflicts of interest
The authors declare there is no conflict of interest in this study.
Appendix A. Supplementary data
The following is the Supplementary data to this article:
References
- 1.Jiang Y., Zhang J., Zhao J., Li Z., Chen H., Qiao Y. TOPK promotes metastasis of esophageal squamous cell carcinoma by activating the Src/GSK3beta/STAT3 signaling pathway via gamma-catenin. BMC Cancer. 2019;19:1264. doi: 10.1186/s12885-019-6453-z. [DOI] [PMC free article] [PubMed] [Google Scholar]
- 2.Kang X., Chen K., Li Y., Li J., D'Amico T.A., Chen X. Personalized targeted therapy for esophageal squamous cell carcinoma. World J Gastroenterol. 2015;21:7648–7658. doi: 10.3748/wjg.v21.i25.7648. [DOI] [PMC free article] [PubMed] [Google Scholar]
- 3.Tian J., Shang M., Shi S.B., Han Y., Xu J. Cetuximab plus pemetrexed as second-line therapy for fluorouracil-based pre-treated metastatic esophageal squamous cell carcinoma. Cancer Chemother Pharmacol. 2015;76:829–834. doi: 10.1007/s00280-015-2854-0. [DOI] [PubMed] [Google Scholar]
- 4.Zhou J., Wu Z., Wong G., Pectasides E., Nagaraja A., Stachler M. CDK4/6 or MAPK blockade enhances efficacy of EGFR inhibition in oesophageal squamous cell carcinoma. Nat Commun. 2016;8:13687. doi: 10.1038/ncomms13897. [DOI] [PMC free article] [PubMed] [Google Scholar]
- 5.Jiang X., Overholtzer M., Thompson C.B. Autophagy in cellular metabolism and cancer. J Clin Invest. 2015;125:47–54. doi: 10.1172/JCI73942. [DOI] [PMC free article] [PubMed] [Google Scholar]
- 6.Li G., Boyle J.W., Ko C.N., Zeng W., Wong V.K.W., Wan J.B. Aurone derivatives as Vps34 inhibitors that modulate autophagy. Acta Pharm Sin B. 2019;9:537–544. doi: 10.1016/j.apsb.2019.01.016. [DOI] [PMC free article] [PubMed] [Google Scholar]
- 7.Rebecca V.W., Amaravadi R.K. Emerging strategies to effectively target autophagy in cancer. Oncogene. 2016;35:1–11. doi: 10.1038/onc.2015.99. [DOI] [PMC free article] [PubMed] [Google Scholar]
- 8.White E. Deconvoluting the context-dependent role for autophagy in cancer. Nat Rev Cancer. 2012;12:401–410. doi: 10.1038/nrc3262. [DOI] [PMC free article] [PubMed] [Google Scholar]
- 9.Yu T., Guo F., Yu Y., Sun T., Ma D., Han J. Fusobacterium nucleatum promotes chemoresistance to colorectal cancer by modulating autophagy. Cell. 2017;170:548–563 e16. doi: 10.1016/j.cell.2017.07.008. [DOI] [PMC free article] [PubMed] [Google Scholar]
- 10.Li S., Song Y., Quach C., Guo H., Jang G.B., Maazi H. Transcriptional regulation of autophagy-lysosomal function in BRAF-driven melanoma progression and chemoresistance. Nat Commun. 2019;10:1693. doi: 10.1038/s41467-019-09634-8. [DOI] [PMC free article] [PubMed] [Google Scholar]
- 11.Rangwala R., Chang Y.C., Hu J., Algazy K.M., Evans T.L., Fecher L.A. Combined MTOR and autophagy inhibition: phase I trial of hydroxychloroquine and temsirolimus in patients with advanced solid tumors and melanoma. Autophagy. 2014;10:1391–1402. doi: 10.4161/auto.29119. [DOI] [PMC free article] [PubMed] [Google Scholar]
- 12.Datta S., Choudhury D., Das A., Mukherjee D.D., Dasgupta M., Bandopadhyay S. Autophagy inhibition with chloroquine reverts paclitaxel resistance and attenuates metastatic potential in human nonsmall lung adenocarcinoma A549 cells via ROS mediated modulation of beta-catenin pathway. Apoptosis. 2019;24:414–433. doi: 10.1007/s10495-019-01526-y. [DOI] [PubMed] [Google Scholar]
- 13.Schmoll D., Engel C.K., Glombik H. The Keap1–Nrf2 protein–protein interaction: a suitable target for small molecules. Drug Discov Today Technol. 2017;24:11–17. doi: 10.1016/j.ddtec.2017.10.001. [DOI] [PubMed] [Google Scholar]
- 14.Bao L.J., Jaramillo M.C., Zhang Z.B., Zheng Y.X., Yao M., Zhang D.D. Nrf2 induces cisplatin resistance through activation of autophagy in ovarian carcinoma. Int J Clin Exp Pathol. 2014;7:1502–1513. [PMC free article] [PubMed] [Google Scholar]
- 15.Abed D.A., Goldstein M., Albanyan H., Jin H., Hu L. Discovery of direct inhibitors of Keap1–Nrf2 protein–protein interaction as potential therapeutic and preventive agents. Acta Pharm Sin B. 2015;5:285–299. doi: 10.1016/j.apsb.2015.05.008. [DOI] [PMC free article] [PubMed] [Google Scholar]
- 16.Ly C. Heme oxygenase-1: emerging target of cancer therapy. J Biomed Sci. 2015;22:22. doi: 10.1186/s12929-015-0128-0. [DOI] [PMC free article] [PubMed] [Google Scholar]
- 17.Jiang T., Harder B., Rojo de la Vega M., Wong P.K., Chapman E., Zhang D.D. P62 links autophagy and Nrf2 signaling. Free Radic Biol Med. 2015;88:199–204. doi: 10.1016/j.freeradbiomed.2015.06.014. [DOI] [PMC free article] [PubMed] [Google Scholar]
- 18.Herr I., Buchler M.W. Dietary constituents of broccoli and other cruciferous vegetables: implications for prevention and therapy of cancer. Cancer Treat Rev. 2010;36:377–383. doi: 10.1016/j.ctrv.2010.01.002. [DOI] [PubMed] [Google Scholar]
- 19.Pistollato F., Calderon Iglesias R., Ruiz R., Aparicio S., Crespo J., Dzul Lopez L. The use of natural compounds for the targeting and chemoprevention of ovarian cancer. Cancer Lett. 2017;411:191–200. doi: 10.1016/j.canlet.2017.09.050. [DOI] [PubMed] [Google Scholar]
- 20.Vyas A.R., Hahm E.R., Arlotti J.A., Watkins S., Stolz D.B., Desai D. Chemoprevention of prostate cancer by d,l-sulforaphane is augmented by pharmacological inhibition of autophagy. Cancer Res. 2013;73:5985–5995. doi: 10.1158/0008-5472.CAN-13-0755. [DOI] [PMC free article] [PubMed] [Google Scholar]
- 21.Jakubikova J., Cervi D., Ooi M., Kim K., Nahar S., Klippel S. Anti-tumor activity and signaling events triggered by the isothiocyanates, sulforaphane and phenethyl isothiocyanate, in multiple myeloma. Haematologica. 2011;96:1170–1179. doi: 10.3324/haematol.2010.029363. [DOI] [PMC free article] [PubMed] [Google Scholar]
- 22.Lv H.H., Zhen C.X., Liu J.Y., Shang P. PEITC triggers multiple forms of cell death by GSH-iron-ROS regulation in K7M2 murine osteosarcoma cells. Acta Pharmacol Sin. 2020;41:1119–1132. doi: 10.1038/s41401-020-0376-8. [DOI] [PMC free article] [PubMed] [Google Scholar]
- 23.Herman-Antosiewicz A., Johnson D.E., Singh S.V. Sulforaphane causes autophagy to inhibit release of cytochrome C and apoptosis in human prostate cancer cells. Cancer Res. 2006;66:5828–5835. doi: 10.1158/0008-5472.CAN-06-0139. [DOI] [PubMed] [Google Scholar]
- 24.Wang H., Wang L., Cao L., Zhang Q., Song Q., Meng Z. Inhibition of autophagy potentiates the anti-metastasis effect of phenethyl isothiocyanate through JAK2/STAT3 pathway in lung cancer cells. Mol Carcinog. 2018;57:522–535. doi: 10.1002/mc.22777. [DOI] [PubMed] [Google Scholar]
- 25.Kanematsu S., Uehara N., Miki H., Yoshizama K., Kawanaka A., Yuri T. Autophagy inhibition enhances sulforaphane-induced apoptosis in human breast cancer cells. Anticancer Res. 2010;30:3381–3390. [PubMed] [Google Scholar]
- 26.Zhang Q.C., Pan Z.H., Liu B.N., Meng Z.W., Wu X., Zhou Q.H. Benzyl isothiocyanate induces protective autophagy in human lung cancer cells through an endoplasmic reticulum stress-mediated mechanism. Acta Pharmacol Sin. 2017;38:539–550. doi: 10.1038/aps.2016.146. [DOI] [PMC free article] [PubMed] [Google Scholar]
- 27.Peng K.Z., Ke Y., Zhao Q., Tian F., Liu H.M., Hou G. OP16, a novel ent-kaurene diterpenoid, potentiates the antitumor effect of rapamycin by inhibiting rapamycin-induced feedback activation of Akt signaling in esophageal squamous cell carcinoma. Biochem Pharmacol. 2017;140:16–27. doi: 10.1016/j.bcp.2017.05.013. [DOI] [PubMed] [Google Scholar]
- 28.Lu Z., Shi X., Gong F., Li S., Wang Y., Ren Y. RICTOR/mTORC2 affects tumorigenesis and therapeutic efficacy of mTOR inhibitors in esophageal squamous cell carcinoma. Acta Pharm Sin B. 2020;10:1004–1019. doi: 10.1016/j.apsb.2020.01.010. [DOI] [PMC free article] [PubMed] [Google Scholar]
- 29.Hou G., Zhang Q., Wang L., Liu M., Wang J., Xue L. mTOR inhibitor rapamycin alone or combined with cisplatin inhibits growth of esophageal squamous cell carcinoma in nude mice. Cancer Lett. 2010;290:248–254. doi: 10.1016/j.canlet.2009.09.015. [DOI] [PubMed] [Google Scholar]
- 30.Briones-Herrera A., Eugenio-Perez D., Reyes-Ocampo J.G., Rivera-Mancia S., Pedraza-Chaverri J. New highlights on the health-improving effects of sulforaphane. Food Funct. 2018;9:2589–2606. doi: 10.1039/c8fo00018b. [DOI] [PubMed] [Google Scholar]
- 31.Saw C.L., Kong A.N. Nuclear factor-erythroid 2-related factor 2 as a chemopreventive target in colorectal cancer. Expert Opin Ther Targets. 2011;15:281–295. doi: 10.1517/14728222.2011.553602. [DOI] [PMC free article] [PubMed] [Google Scholar]
- 32.Zhang P., Singh A., Yegnasubramanian S., Esopi D., Kombairaju P., Bodas M. Loss of Kelch-like ECH-associated protein 1 function in prostate cancer cells causes chemoresistance and radioresistance and promotes tumor growth. Mol Cancer Therapeut. 2010;9:336–346. doi: 10.1158/1535-7163.MCT-09-0589. [DOI] [PMC free article] [PubMed] [Google Scholar]
- 33.Tan H.Z., Wu Z.Y., Wu J.Y., Long L., Jiao J.W., Peng Y.H. Single nucleotide polymorphism rs13042395 in the SLC52A3 gene as a biomarker for regional lymph node metastasis and relapse-free survival of esophageal squamous cell carcinoma patients. BMC Cancer. 2016;16:560. doi: 10.1186/s12885-016-2588-3. [DOI] [PMC free article] [PubMed] [Google Scholar]
- 34.Chikara S., Nagaprashantha L.D., Singhal J., Horne D., Awasthi S., Singhal S.S. Oxidative stress and dietary phytochemicals: role in cancer chemoprevention and treatment. Cancer Lett. 2018;413:122–134. doi: 10.1016/j.canlet.2017.11.002. [DOI] [PubMed] [Google Scholar]
- 35.Tortorella S.M., Royce S.G., Licciardi P.V., Karagiannis T.C. Dietary sulforaphane in cancer chemoprevention: the role of epigenetic regulation and HDAC inhibition. Antioxidants Redox Signal. 2015;22:1382–1424. doi: 10.1089/ars.2014.6097. [DOI] [PMC free article] [PubMed] [Google Scholar]
- 36.Clarke J.D., Dashwood R.H., Ho E. Multi-targeted prevention of cancer by sulforaphane. Cancer Lett. 2008;269:291–304. doi: 10.1016/j.canlet.2008.04.018. [DOI] [PMC free article] [PubMed] [Google Scholar]
- 37.Zhang Y., Tang L. Discovery and development of sulforaphane as a cancer chemopreventive phytochemical. Acta Pharmacol Sin. 2007;28:1343–1354. doi: 10.1111/j.1745-7254.2007.00679.x. [DOI] [PubMed] [Google Scholar]
- 38.Rausch V., Liu L., Kallifatidis G., Baumann B., Mattern J., Gladkich J. Synergistic activity of sorafenib and sulforaphane abolishes pancreatic cancer stem cell characteristics. Cancer Res. 2010;70:5004–5013. doi: 10.1158/0008-5472.CAN-10-0066. [DOI] [PubMed] [Google Scholar]
- 39.Hu C., Eggler A.L., Mesecar A.D., van Breemen R.B. Modification of keap1 cysteine residues by sulforaphane. Chem Res Toxicol. 2011;24:515–521. doi: 10.1021/tx100389r. [DOI] [PMC free article] [PubMed] [Google Scholar]
- 40.Rojo de la Vega M., Chapman E., Zhang D.D. NRF2 and the hallmarks of cancer. Cancer Cell. 2018;34:21–43. doi: 10.1016/j.ccell.2018.03.022. [DOI] [PMC free article] [PubMed] [Google Scholar]
- 41.Menegon S., Columbano A., Giordano S. The dual roles of NRF2 in cancer. Trends Mol Med. 2016;22:578–593. doi: 10.1016/j.molmed.2016.05.002. [DOI] [PubMed] [Google Scholar]
- 42.Robledinos-Anton N., Fernandez-Gines R., Manda G., Cuadrado A. Activators and inhibitors of NRF2: a review of their potential for clinical development. Oxid Med Cell Longev. 2019;2019:9372182. doi: 10.1155/2019/9372182. [DOI] [PMC free article] [PubMed] [Google Scholar]
- 43.Zhang M., Zhang C., Zhang L., Yang Q., Zhou S., Wen Q. Nrf2 is a potential prognostic marker and promotes proliferation and invasion in human hepatocellular carcinoma. BMC Cancer. 2015;15:531. doi: 10.1186/s12885-015-1541-1. [DOI] [PMC free article] [PubMed] [Google Scholar]
- 44.Antonioli M., Di Rienzo M., Piacentini M., Fimia G.M. Emerging mechanisms in initiating and terminating autophagy. Trends Biochem Sci. 2017;42:28–41. doi: 10.1016/j.tibs.2016.09.008. [DOI] [PubMed] [Google Scholar]
- 45.Hac A., Domachowska A., Narajczyk M., Cyske K., Pawlik A., Herman-Antosiewicz A. S6K1 controls autophagosome maturation in autophagy induced by sulforaphane or serum deprivation. Eur J Cell Biol. 2015;94:470–481. doi: 10.1016/j.ejcb.2015.05.001. [DOI] [PubMed] [Google Scholar]
- 46.Jiang X., Overholtzer M., Thompson C.B. Autophagy in cellular metabolism and cancer. J Clin Invest. 2015;125:47–54. doi: 10.1172/JCI73942. [DOI] [PMC free article] [PubMed] [Google Scholar]
- 47.Pankiv S., Clausen T.H., Lamark T., Brech A., Bruun J.A., Outzen H. p62/SQSTM1 binds directly to Atg8/LC3 to facilitate degradation of ubiquitinated protein aggregates by autophagy. J Biol Chem. 2007;282:24131–24145. doi: 10.1074/jbc.M702824200. [DOI] [PubMed] [Google Scholar]
- 48.Mizushima N., Yoshimori T. How to interpret LC3 immunoblotting. Autophagy. 2007;3:542–545. doi: 10.4161/auto.4600. [DOI] [PubMed] [Google Scholar]
- 49.Sun W., Yi Y., Xia G., Zhao Y., Yu Y., Li L. Nrf2-miR-129-3p-mTOR axis controls an miRNA regulatory network involved in HDACi-induced autophagy. Mol Ther. 2019;27:1039–1050. doi: 10.1016/j.ymthe.2019.02.010. [DOI] [PMC free article] [PubMed] [Google Scholar]
- 50.Wang Y., Zhang J., Huang Z.H., Huang X.H., Zheng W.B., Yin X.F. Isodeoxyelephantopin induces protective autophagy in lung cancer cells via Nrf2-p62-keap1 feedback loop. Cell Death Dis. 2017;8 doi: 10.1038/cddis.2017.265. [DOI] [PMC free article] [PubMed] [Google Scholar]
- 51.Sun X., Li J., Li Y., Wang S., Li Q. Apatinib, a novel tyrosine kinase inhibitor, promotes ROS-dependent apoptosis and autophagy via the Nrf2/HO-1 pathway in ovarian cancer cells. Oxid Med Cell Longev. 2020;2020:3145182. doi: 10.1155/2020/3145182. [DOI] [PMC free article] [PubMed] [Google Scholar]
- 52.Jeong J.Y., Cha H.J., Choi E.O., Kim C.H., Kim G.Y., Yoo Y.H. Activation of the Nrf2/HO-1 signaling pathway contributes to the protective effects of baicalein against oxidative stress-induced DNA damage and apoptosis in HEI193 Schwann cells. Int J Med Sci. 2019;16:145–155. doi: 10.7150/ijms.27005. [DOI] [PMC free article] [PubMed] [Google Scholar]
- 53.Minina E.A., Bozhkov P.V., Hofius D. Autophagy as initiator or executioner of cell death. Trends Plant Sci. 2014;19:692–697. doi: 10.1016/j.tplants.2014.07.007. [DOI] [PubMed] [Google Scholar]
- 54.Hall T.M., Tetreault M.P., Hamilton K.E., Whelan K.A. Autophagy as a cytoprotective mechanism in esophageal squamous cell carcinoma. Curr Opin Pharmacol. 2018;41:12–19. doi: 10.1016/j.coph.2018.04.003. [DOI] [PMC free article] [PubMed] [Google Scholar]
- 55.Li Y.J., Lei Y.H., Yao N., Wang C.R., Hu N., Ye W.C. Autophagy and multidrug resistance in cancer. Chin J Cancer. 2017;36:52. doi: 10.1186/s40880-017-0219-2. [DOI] [PMC free article] [PubMed] [Google Scholar]
- 56.Xu X., Wang D., Zheng C., Gao B., Fan J., Cheng P. Progerin accumulation in nucleus pulposus cells impairs mitochondrial function and induces intervertebral disc degeneration and therapeutic effects of sulforaphane. Theranostics. 2019;9:2252–2267. doi: 10.7150/thno.30658. [DOI] [PMC free article] [PubMed] [Google Scholar]
- 57.Hou G., Zhao Q., Zhang M., Fan T., Liu M., Shi X. Down-regulation of Rictor enhances cell sensitivity to PI3K inhibitor LY294002 by blocking mTORC2-medicated phosphorylation of Akt/PRAS40 in esophageal squamous cell carcinoma. Biomed Pharmacother. 2018;106:1348–1356. doi: 10.1016/j.biopha.2018.07.075. [DOI] [PubMed] [Google Scholar]
Associated Data
This section collects any data citations, data availability statements, or supplementary materials included in this article.