Abstract
The discovery of dynamic and reversible modifications in messenger RNA (mRNA) is opening new directions in RNA modification-mediated regulation of biological processes. Methylation is the most prevalent modification occurring in mRNA and the methyl group is mainly decorated in the adenine, cytosine, and guanine base or in the 2′-hydroxyl group of ribose. However, methylation of the uracil base (5-methyluridine, m5U) has not been discovered in mRNA of eukaryotes. In the current study, we established a method of N-cyclohexyl-N′-β-(4-methylmorpholinium) ethylcarbodiimide p-toluenesulfonate (CMCT) labelling coupled with liquid chromatography-electrospray ionization-mass spectrometry (LC-ESI-MS/MS) analysis for the sensitive determination of uridine modifications in RNA. Our results demonstrated that the detection sensitivities of uridine modifications in RNA increased up to 1408 fold upon CMCT labelling. Using the developed method, we identified the distinct existence of m5U in mRNA of various mammalian cells and tissues. In addition, the stable isotope tracing monitored by mass spectrometry revealed that the methyl group of m5U originated from S-adenosyl-l-methionine (SAM). Our study expanded the list of modifications occurring in mRNA of mammals. Future work on transcriptome-wide mapping of m5U will further uncover the functional roles of m5U in mRNA of mammals.
The discovery of dynamic and reversible modifications in messenger RNA is opening new directions in RNA modification-mediated regulation of biological processes.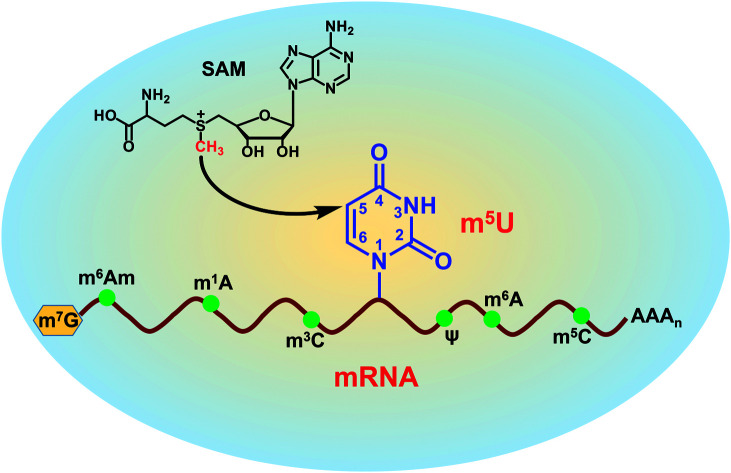
Introduction
Chemical modification in nucleic acids can delicately regulate gene expression.1 The functional roles of DNA modifications in regulation of gene expression have been well established.2 However, how RNA modifications affect translation and eventually tune gene expression has just begun to be understood.3 The discovery of a variety of modifications in RNA broadens our views on the structures and functions of RNA.4 To date, over 150 chemically distinct modifications have been identified in various species of RNA in all three kingdoms of life.5,6 Most of these modifications are characterized in the abundant ribosomal RNA (rRNA) and transfer RNA (tRNA), where they can alter the RNA secondary structure by affecting base stacking or changing hydrogen bonding patterns.7,8
RNA modifications are found to be involved in various RNA processing and metabolism procedures, including alternative splicing, stability, translation, folding and molecular recognition.7–10 The discovery of dynamic and reversible modifications in messenger RNA (mRNA) is opening new directions in RNA modification-mediated regulation of biological processes.11 The technical breakthroughs led to the discovery of a series of modifications in eukaryotic mRNA, including N6-methyladenosine (m6A), N1-methyladenosine (m1A), N6,2′-O-dimethyladenosine (m6Am), 5-methylcytidine (m5C), N3-methylcytidine (m3C), N7-methylguanosine (m7G), 2′-O-methylation, inosine (I), and pseudouridine (Ψ).11–13 Very recently, N4-acetylcytidine was newly discovered to be present in mRNA of mammals.14 These studies demonstrated that the modifications play versatile roles in mRNA processing and eventually affect the epitranscriptomic state of cells.15
Methylation is the most prevalent modification occurring in mRNA, such as m6A, m1A, m6Am, m5C, m3C, and m7G, and 2′-O-methylation.11 The methyl group is mainly decorated in adenine, cytosine, and guanine base or in ribose. However, methylation of the uracil base (5-methyluridine, m5U) has not been discovered in mRNA of eukaryotes. m5U is a common modification found in rRNA and tRNA.16 Two m5U sites were previously identified at positions 747 and 1939 in E. coli 23S rRNA, and one m5U site was found at position 54 in E. coli tRNA.17,18 One early study showed that m5U was also present in the tRNA-like domain of tmRNA in E.coli cells.19 It was proposed that TrmA protein can methylate U54 in the T-arm of most E. coli tRNAs.18,20 And the RumA protein was responsible for the methylation of U1939 in E. coli 23S rRNA to form m5U that may play an important role in translation.17 But the existence of m5U in mRNA of eukaryotes remains elusive.
In eukaryotic cells, the RNA pool predominantly consists of rRNA (∼80%) and tRNA (∼15%), whereas mRNA only constitutes a small fraction (<5%).21 The modifications in mRNA generally exist in low abundance.13 For example, m3C is present at a frequency around ∼1 to 5 modifications per 105 cytidine.22 Therefore, the low in vivo contents can lead to the detection of modifications in mRNA being a challenging task. The mass spectrometry (MS)-based analytical platform has been widely employed for determining modifications due to its superior detection sensitivity and powerful capability in the identification of the chemical structures of modifications.23–28 However, the ionization efficiencies of uridine and uridine modifications in electrospray ionization (ESI)-MS are much poorer than those of other canonical nucleosides and their corresponding modifications,29,30 which makes the detection of uridine modifications more difficult.
The chemical labelling strategy that can introduce an easily ionizable functional group into analytes has been developed to improve the detection sensitivities of compounds while in combination with mass spectrometry analysis.31–33 In this respect, the reagent N-cyclohexyl-N′-β-(4-methylmorpholinium) ethylcarbodiimide p-toluenesulfonate (CMCT) was previously used to label Ψ and U followed by treatment under alkaline conditions to differentiate Ψ from U.34–36 The CMCT group can stably link to uridine and uridine modifications if omitting the alkaline treatment, which then can be utilized to detect the low-abundant uridine modifications since the introduction of the permanently positively charged quaternary ammonium group from CMCT can enhance the ionization efficiency of uridine modifications. In the current study, we established a method of CMCT labelling coupled with liquid chromatography-electrospray ionization-tandem mass spectrometry (LC-ESI-MS/MS) analysis for sensitive determination of the uridine modifications in RNA. Our results demonstrated that the detection sensitivities of uridine modifications in RNA increased by 6–1408 fold upon CMCT labelling. Using the developed method, we identified, for the first time, the existence of m5U in mRNA of mammalian cells.
Materials and methods
Chemicals and reagents
Adenosine (A), uridine (U), cytidine (C), guanosine (G), N6-methyladenosine (m6A) and venom phosphodiesterase I were purchased from Sigma-Aldrich (Beijing, China). N6-isopentenyladenosine (i6A), N6-threonylcarbamoyladenosine (t6A), 1-methylguanosine (m1G), N2-methylguanosine (m2G), pseudouridine (Ψ), 5-methyluridine (m5U), 1-methylpseudouridine (m1Ψ), 5-hydroxymethyluridine (hm5U), 5-methoxyuridine (mo5U), 5-methoxycarbonylmethyluridine (mcm5U), and 1-cyclohexyl-3-(2-(4-morpholinyl)ethyl) carbodiimide (CME) were purchased from Carbosynth China Ltd. (Jiangsu, China). 6-Methyluridine (m6U) was purchased from Granlen Inc. (Henan, China). N-cyclohexyl-N′-β-(4-methylmorpholinium) ethylcarbodiimide p-toluenesulfonate (CMCT), D3-iodomethane (CD3I), cerium oxide (CeO2), and l-methionine-(methyl-D3) (D3-Met) were purchased from Aladdin Industrial Inc. (Shanghai, China). S1 nuclease and calf intestinal alkaline phosphatase were obtained from Takara Biotechnology (Dalian, China). The E.Z.N.A. miRNA kit was obtained from Omega Bio-tek Inc. (Norcross, GA, USA). Dulbecco's modified Eagle medium (DMEM), RPMI-1640 medium and fetal bovine serum were obtained from Thermo-Fisher Scientific (Beijing, China). Chromatographic grade acetonitrile (ACN) and methanol (MeOH) were purchased from Merck (Darmstadt, Germany). Analytical grade formic acid, ammonium bicarbonate, diethyl ether and ammonia hydroxide were purchased from Sinopharm Chemical Reagent Co., Ltd. (Shanghai, China).
Biological samples and stable isotope labelling tracing
Human embryonic kidney 293T cell line (HEK293T), human cervical carcinoma cell line (HeLa), human hepatic cell line (HL-7702), and human liver carcinoma cell lines (HepG2) were obtained from the China Center for Type Culture Collection. HEK293T, HeLa, and HepG2 cells were grown in DMEM medium supplemented with 10% fetal bovine serum, 100 U mL−1 penicillin, and 100 μg mL−1 streptomycin at 37 °C in a 5% CO2 atmosphere. HL-7702 cells were cultured in RPMI-1640 medium supplemented with 10% fetal bovine serum, 100 U mL−1 penicillin, and 100 μg mL−1 streptomycin at 37 °C in a 5% CO2 atmosphere. Male wild-type C57BL/6J mice (2 months old) were obtained from the Center for Animal Experiment/ABSL-3 Laboratory of Wuhan University and sacrificed to collect tissues. This study was performed in strict accordance with the NIH guidelines for the care and use of laboratory animals (NIH Publication No. 85-23 Rev. 1985) and was approved by the Animal Care and Use Committee of Wuhan University (Wuhan, China).
As for stable isotope labelling tracing monitored by mass spectrometry, HEK293T cells were cultured in DMEM medium supplemented with 0.3 mM of D3-Met to metabolically label the RNA with the CD3 group. The cells were collected after culturing for 72 h and then mRNA was extracted.
Purification and enzymatic digestion of different species of RNA
Total RNA was extracted using an E.Z.N.A. HP Total RNA kit (Omega Bio-Tek Inc., Norcross, GA, USA) according to the manufacturer's recommended procedure. Small RNA (<200 nt) was purified using the E.Z.N.A. miRNA kit (Omega Bio-Tek Inc., Norcross, GA, USA). For mRNA isolation, the obtained large RNA (>200 nt) after small RNA depletion using the E.Z.N.A. miRNA kit was further extracted twice using a PolyATtract mRNA isolation system (Promega, Madison, WI, USA). The resulting mRNA was further processed with agarose gel electrophoresis-based purification, which can remove the potential trace level of contamination of small RNA (<200 nt). The detailed procedure of agarose gel electrophoresis-based purification can be found in the ESI.† The rRNA was purified from the obtained large RNA (>200 nt) by means of size-exclusion chromatography (SEC) on a Bio SEC-5 column (5 μm, 1000 Å, 4.6 × 150 mm; Agilent Technologies, Foster City, CA, USA) according to a previous study.37 Isocratic separation was performed at a flow rate of 0.35 mL min−1 at 35 °C with 100 mM NH4Ac (pH 7.0) as the mobile phase. The fraction was collected and further processed with the E.Z.N.A. miRNA kit to remove NH4Ac. The purification was repeated twice to obtain high purity of rRNA.
Enzymatic digestion of RNA was performed according to a previously described method under neutral conditions.37 Briefly, 3 μL of 10 × buffer (500 mM Tris–HCl, 100 mM NaCl, 10 mM MgCl2, 10 mM ZnSO4, pH 7.0), 1 μL of S1 nuclease (180 U μL−1), 1 μL of venom phosphodiesterase I (0.001 U μL−1), and 1 μL of calf intestinal alkaline phosphatase (30 U μL−1) were added to the RNA (0.2–5 μg) dissolved in 24 μL H2O. The mixture was incubated at 37 °C for 4 h. 270 μL of H2O and 300 μL of CHCl3 were added to the resulting solution followed by vortexing for 3 min and centrifugation at 12 000 rpm for 10 min. The upper aqueous phase was collected. The extraction process was repeated 3 times to fully remove the proteins. The aqueous phase was collected and lyophilized and then subjected to subsequent analysis.
Synthesis of N-cyclohexyl-N′-β-(4-methylmorpholinium) ethylcarbodiimide p-toluenesulfonate-(methyl-D3) (D3-CMCT)
D3-CMCT was synthesized from 1-cyclohexyl-3-(2-(4-morpholinyl)ethyl) carbodiimide (CME) and D3-iodomethane (CD3I) according to a previous report38 with slight modification. The synthesis route is shown in Fig. S1 in the ESI.† Briefly, 40 μL of CME (50 mM in ACN) was incubated with 10 μL of CD3I at 30 °C for 15 h. Then 100 μL of borate buffer (50 mM, pH 8.5) and 200 μL of diethyl ether were added to the mixture. The mixture was separated into a lower aqueous phase and an upper diethyl ether. The unreacted CME and CD3I remained in the diethyl ether phase while the newly synthesized D3-CMCT was in the aqueous phase. After removing the diethyl ether phase, the aqueous phase was collected and used for the labelling reaction.
Chemical labelling
CMCT and D3-CMCT were used to label uridine and uridine modifications. The labelling reaction was carried out in borate buffer (50 mM, pH 8.5). The reaction conditions, including reaction time and temperature and the concentration of CMCT, were optimized to achieve the best labelling efficiency. After the labelling reaction, the mixture was subjected to CeO2 solid phase extraction (SPE) to remove excess CMCT according to a previously described procedure,39 and the resulting derivatives were then subjected to LC-ESI-MS/MS analysis. The detailed procedure for the extraction of CMCT labelled nucleosides by CeO2 SPE is shown in the ESI.†
Analysis of CMCT\D3-CMCT labelled uridine modifications by LC-ESI-MS/MS
Analysis of CMCT\D3-CMCT labelled uridine modifications was performed on an AB 3200 QTRAP mass spectrometer (Applied Biosystems, Foster City, CA, USA) equipped with an electrospray ionization (ESI) source (Turbo Ionspray) and a Shimadzu LC-20AD HPLC system (Tokyo, Japan). Data acquisition and processing were performed with AB SCIEX Analyst 1.5 software (Applied Biosystems). ESI-MS was conducted in positive-ion mode and multiple-reaction monitoring (MRM) was employed for the detection. To achieve the best performance, the mass spectrometric parameters were optimized, and the optimized MS conditions are listed in Table S1 in the ESI.† The separation of CMCT labelled uridine modifications was performed on an Inersil ODS-3 reversed-phase column (5 μm, 2.1 × 250 mm; GL Sciences Lnc., Tokyo, Japan). NH4HCO3 (2 mM, pH 4.5, solvent A) and ACN (solvent B) were used as the mobile phases. Gradients of 0–3 min, 5% B; 3–20 min, 5–40% B; 20–29 min, 40% B; 29–31 min, 40–5% B; and 31–45 min, 5% B were used. The flow rate was set at 200 μL min−1. Quantification of uridine modifications is shown in the ESI.†
High-resolution mass spectrometry analysis
The CMCT\D3-CMCT labelled uridine modifications were also examined with a high-resolution LTQ-Orbitrap Elite mass spectrometer (Thermo-Fisher Scientific, Waltham, MA, USA) equipped with an electrospray ionization (ESI) source and a Dionex Ultimate 3000 UPLC system (Thermo-Fisher Scientific, Waltham, MA, USA). The LC separation conditions were the same as those for the AB 3200 QTRAP mass spectrometer system. Full MS scans were acquired in positive-ion mode at a resolution of 60 000. Collision induced dissociation (CID) with a collision energy of 25–35 eV was used. The fragments were acquired with a mass range of m/z 200–700 at a resolution of 60 000. The source and ion transfer parameters applied were as follows: heater temperature, 300 °C; capillary temperature, 350 °C; sheath gas flow, 35 arbitrary units; auxiliary gas flow, 15 arbitrary units; spray voltage, 3.5 kV; capillary voltage, 35 V; and the S-lens RF level, 60%. Data analysis was carried out using Xcalibur v3.0.63 (Thermo-Fisher Scientific, Waltham, MA, USA).
siRNA knockdown and overexpression of TRMT2A
Knockdown of TRMT2A was performed using siRNA (Sangon Biotech, Shanghai, China) targeting human TRMT2A mRNA. Non-targeting siRNA was used as a negative control. The sequences of TRMT2A siRNA are 5′-GCUACAUCAGGGAUGACUUTT-3′/3′-TTCGAUGUAGUCCCUACUGAA-5′, 5′-GCAGACUGAGUAUCGUAAUTT-3′/3′-TTCGUCUGACUCAUAGCAUUA-5′, and 5′-GGACAAUGAGUUGAGUAAUTT-3′/3′-TTCCUGUUACUCAACUCAUUA-5′ and the sequence of the control siRNA is 5′-UUCUCCGAACGUGUCACGUTT-3′/3′-TTAAGAGGCUUGCACAGUGCA-5′. The plasmid pcDNA3.1(+)-TRMT2A was purchased from Sangon Biotech (Shanghai, China). Human HEK293T cells were transfected with siRNA or pcDNA3.1(+)-TRMT2A plasmid using Lipofectamine 2000 (Invitrogen, USA) according to the manufacturer's instruction. The culture medium was exchanged at 10 h after transfection and cells were harvested at 48 h after transfection. As for the rescue experiment, HEK293T cells were transfected with siRNA for 48 h and then further transfected with pcDNA3.1(+)-TRMT2A plasmid for additional 48 h. For the relative quantification of the mRNA of TRMT2A, 1 μg of isolated total RNA was used to generate cDNA using PrimeScript™ RT reagent with gDNA Eraser (Takara Biotechnology). Real-time quantitative PCR was performed using a CFX Connect real-time PCR detection system (Bio-Rad Laboratories) and a SYBR® Premix Ex Taq II (Tli RNaseH Plus) (Takara Biotechnology) according to the manufacturer's instructions. The levels of gene expression were normalized to glyceraldehyde 6-phosphate dehydrogenase gene (GAPDH). PCR primers sequences are as follows: TRMT2A forward primer 5′-CGGAAGGTAAAGAGGGTCATTGG-3′, TRMT2A reverse primer 5′-GAATGCAAGCCAGCACGGGGT-3′, GAPDH forward primer 5′-CTGGGCTACACTGAGCACC-3′, and GAPDH reverse primer 5′-AAGTGGTCGTTGAGGGCAATG-3′. Western blotting analysis of TRMT2A was carried out to evaluate the siRNA knockdown and overexpression of TRMT2A according to a previous study,40 and the detailed procedure can be found in the ESI.†
Analysis of mRNA by high-throughput sequencing
The isolated mRNA was processed using a KAPA Stranded RNA-Seq Library Prep Kit (Illumina) for sequencing library construction following the manufacturer's protocol. RNA-seq was carried out on an Illumina HiSeq 4000 (Illumina) platform by Aksomics Inc (Shanghai, China). Detailed information can be found in the ESI.†
Results and discussion
Chemical labelling
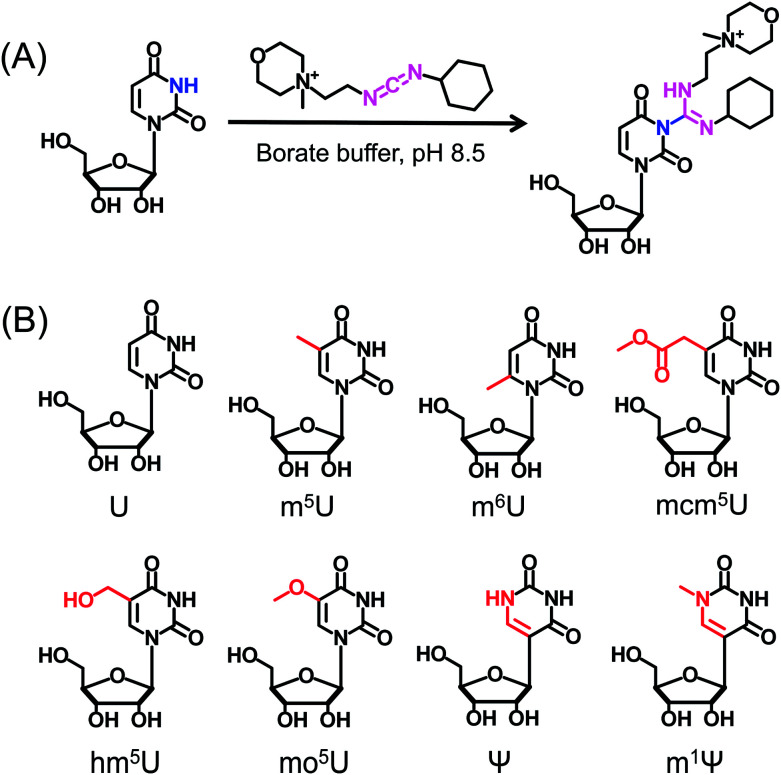
CMCT carries a carbodiimide group that can selectively react with the NH group at the N3 position of the uracil base (Fig. 1A). The introduction of a constant positively charged quaternary ammonium group from CMCT can efficiently enhance the ionization efficiency of the derivatives in electrospray ionization (ESI)-MS. To achieve good accuracy for quantification and identification, we also synthesized D3-CMCT (Fig. S1 in the ESI†). The high-resolution mass spectrometry analysis demonstrated that D3-CMCT was successfully synthesized (Fig. S2 in the ESI†).
Fig. 1. Chemical reaction for labelling of uridine with CMCT. (A) CMCT carries a carbodiimide group that can selectively react with the NH group at the N3 position of the uracil base. (B) The chemical structures of uridine and uridine modifications.
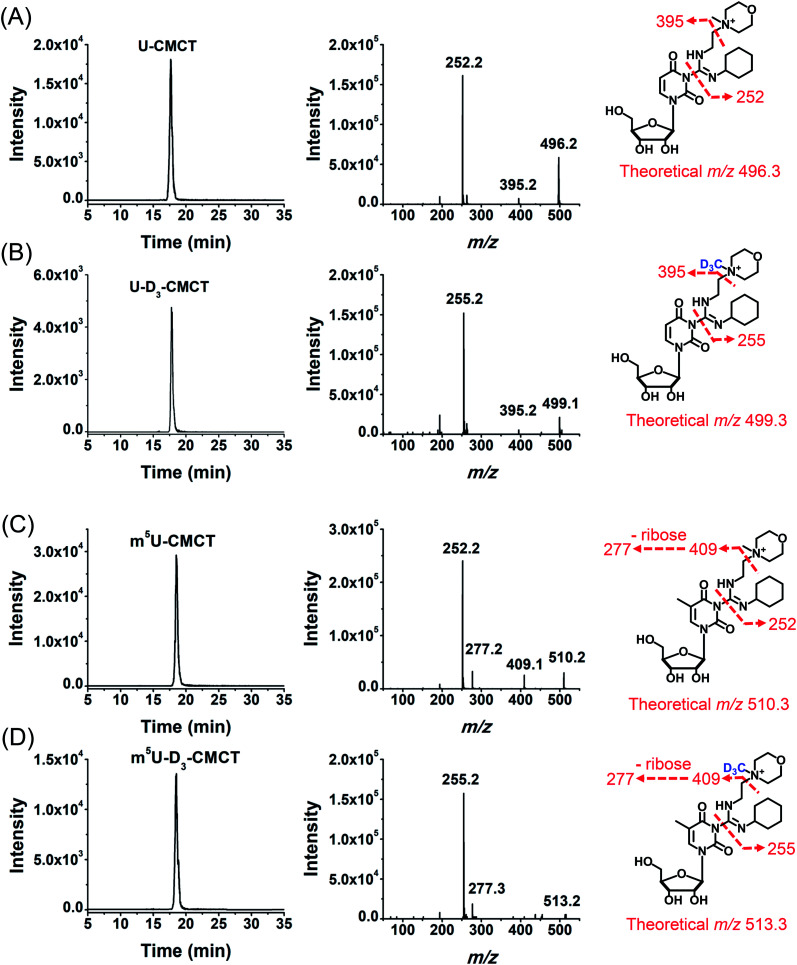
We then used 8 standards of uridine and uridine modifications to evaluate the CMCT/D3-CMCT labelling reaction (Fig. 1B). Shown in Fig. 2 are the extracted-ion chromatograms and the fragment ions of the CMCT/D3-CMCT labelled uridine and m5U. The measured precursor ions and product ions of CMCT/D3-CMCT labelled uridine and m5U were identical to the theoretical values, suggesting that uridine and m5U were successfully labelled and the desired derivatives were obtained. The fragmentation analysis demonstrated that the other 6 uridine modifications (Ψ, m1Ψ, m6U, hm5U, mo5U, and mcm5U) were also successfully labelled with CMCT/D3-CMCT (Fig. S3 in the ESI†). In addition, the CMCT/D3-CMCT labelled uridine modifications were further confirmed by high-resolution mass spectrometry analysis (Fig. S4 in the ESI†).
Fig. 2. Examination of the CMCT/D3-CMCT labelling reaction. Extracted-ion chromatogram and fragment ions of (A) CMCT labelled U, (B) D3-CMCT labelled U, (C) CMCT labelled m5U, and (D) D3-CMCT labelled m5U. The mass transitions 496.3 → 252.2 for CMCT labelled U, 499.3 → 255.2 for D3-CMCT labelled U, 510.3 → 252.2 for CMCT labelled m5U, and 513.3 → 255.2 for D3-CMCT labelled m5U were used for the detection in MRM detection mode.
It is worth noting that protonated molecules generally undergo fragmentation based on a charge-directed mechanism. But when the charge is fixed at one specific atom, charge-remote fragmentation may occur,41,42 which is caused by hydrogen transfer instead of proton transfer among different atoms of the precursor ion.43,44 For example, CMCT labelled m5U is constantly and positively charged due to carrying a quaternary ammonium group and CMCT labelled m5U undergoes charge-remote fragmentation to generate the fragment ion of m/z 252.2 (Fig. 2C and S5 in the ESI†). CMCT labelled m5U can also lose a neutral fragment of 4-methylmorpholine and generate the fragment ion of m/z 409.2, which can further lose a ribose to form the fragment ion of m/z 277.2 (Fig. 2C and S5 in the ESI†).
It can be seen that the fragment ion of m/z 252.2 is the predominant fragment ion of CMCT labelled uridine modifications (Fig. 2 and S3 in the ESI†). We examined the fragmentation pathway of the CMCT labelled m5U with different collision energies ranging from 1 eV to 30 eV. The result showed that the ion of m/z 252.2 was the predominant fragment ion under different collision energies (Fig. S6 in the ESI†). However, we did not observe the cleavage of the N-glycosidic bond that would produce the fragment ion of m/z 378.2 (Fig. S6 in the ESI†). These results suggested that the N–C bond between nucleosides and CMCT was more prone to break than the N-glycosidic bond.
To obtain good labelling efficiency, we optimized the reaction conditions, including reaction temperature and time and the concentrations of CMCT. The result showed that the best labelling efficiencies were obtained at 40 °C for most of the uridine modifications (Fig. S7A in the ESI†). Therefore, 40 °C was used as the reaction temperature. We next optimized the reaction time. The results demonstrated that 14 h of reaction was sufficient for the CMCT labelling (Fig. S7B in the ESI†). As for the optimization of the concentration of CMCT, the results showed that the signals of CMCT labelled uridine modifications reached a plateau when the concentration of CMCT was 50 mM (Fig. S7C in the ESI†). Taken together, the optimized CMCT labelling conditions for uridine modifications were 40 °C for 14 h with 50 mM CMCT. Under the optimized reaction conditions, more than 91% of uridine modifications could react with CMCT to form their corresponding derivatives (Table S2 in the ESI†). And the formed derivatives also exhibited good stability, which was suitable for the subsequent analysis by LC-ESI-MS/MS (Fig. S7D in the ESI†).
CMCT labelling improves the detection sensitivities of uridine modifications
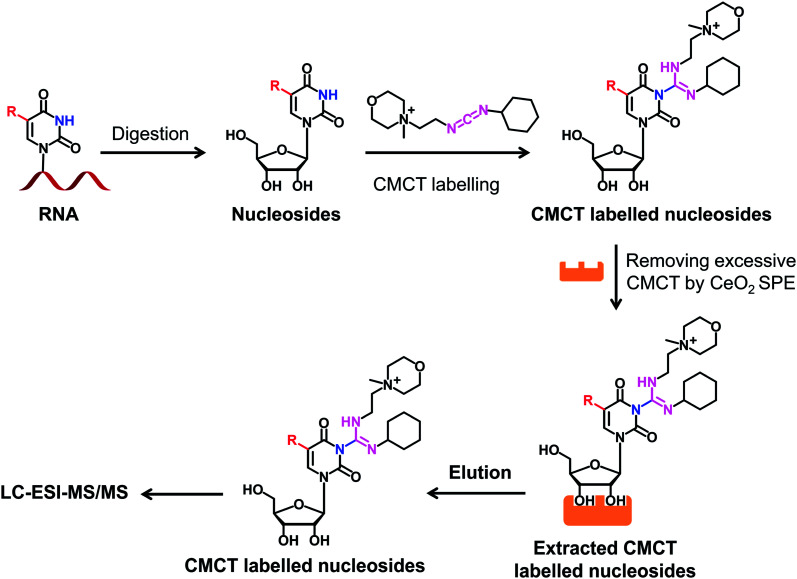
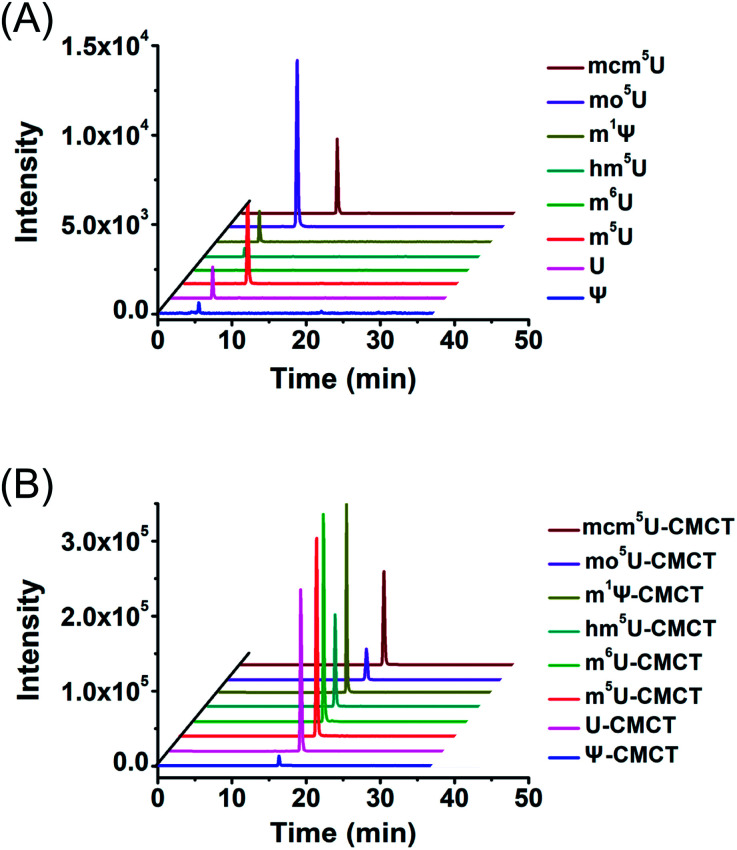
We next evaluated the detection sensitivities of the uridine modifications upon CMCT labelling. The CMCT labelled uridine modifications were extracted with CeO2 to remove the excess CMCT followed by LC-ESI-MS/MS analysis (Fig. 3). The results showed that the retention of uridine modifications without CMCT labelling on the reversed-phase column was relatively weak (Fig. 4A). However, the retention greatly increased after CMCT labelling (Fig. 4B), which is due to the enhanced hydrophobicity of the derivatives by the introduction of cyclohexyl group from CMCT.
Fig. 3. Schematic illustration of the procedure for determination of uridine modifications by CMCT labelling coupled with LC-ESI-MS/MS analysis. Isolated RNA was enzymatically digested followed by CMCT labelling. Then the CMCT labelled uridine modifications were extracted and enriched by CeO2 solid phase extraction (SPE). The resulting CMCT labelled uridine modifications were subjected to LC-ESI-MS/MS analysis.
Fig. 4. Extracted-ion chromatograms of Ψ, U, m5U, m6U, mcm5U, hm5U, m1Ψ and mo5U without (A) and with (B) CMCT labelling. The optimized MS conditions are listed in Table S1 in the ESI.†.
We then examined the detection sensitivities of these uridine modifications upon CMCT labelling. The limits of detection (LODs) defined as the amounts of the analytes at a signal-to-noise ratio (S/N) of 3 were employed to evaluate the detection sensitivities of uridine modifications. The results demonstrated that the detection sensitivities of uridine modifications improved by 6 to 1408 fold upon CMCT labelling (Table 1). We reason that the introduction of positively charged quaternary ammonium group into uridine modifications could greatly improve the ionization efficiency during ESI-MS analysis, which eventually leads to enhanced detection sensitivities. Upon CMCT labelling, the LODs of the CMCT labelled uridine modifications are at similar levels (Table 1). However, the LODs of these native uridine modifications without CMCT labelling have relatively large differences (LODs ranging from 6.6 to 408.2 fmol, Table 1). Due to the large differences of the LODs among native uridine modifications, the improved folds of detection sensitivities (LODs of native uridine modifications/LODs of CMCT labelled uridine modifications) were different among these uridine modifications.
Evaluation of the detection sensitivities of uridine, uridine modifications and guanosine upon CMCT labelling. Independent measurements of three samples were performed.
| Analytes | Without labelling (fmol, LODs) | With CMCT labelling (fmol, LODs) | Detection sensitivities improved fold |
|---|---|---|---|
| U | 160.0 ± 17.0 | 0.44 ± 0.04 | 364 |
| Ψ | 276.9 ± 22.1 | 2.20 ± 0.13 | 126 |
| m5U | 26.4 ± 3.2 | 0.29 ± 0.02 | 91 |
| m6U | 408.2 ± 28.1 | 0.29 ± 0.03 | 1408 |
| m1Ψ | 99.0 ± 10.3 | 0.31 ± 0.02 | 319 |
| hm5U | 145.8 ± 13.3 | 0.39 ± 0.03 | 374 |
| mo5U | 7.8 ± 0.8 | 1.28 ± 0.10 | 6 |
| mcm5U | 20.3 ± 4.2 | 0.54 ± 0.02 | 38 |
| G | 6.6 ± 0.6 | 0.90 ± 0.08 | 7 |
In addition to uridine modifications, guanosine can also react with CMCT as in previous studies.45,46 CMCT labelling can increase the detection sensitivity of guanosine by 7-fold, which is smaller than that for most of the uridine modifications (Table 1). It can be seen that the ionization efficiency of guanosine is better than those of uridine modifications and the increased detection sensitivity of guanosine by chemical labelling is therefore not as dramatic as that of uridine modifications (Table 1). Although guanosine reacts with CMCT, this will not affect the sensitive detection of m5U and other uridine modifications since they have distinctly different molecular weights (Table S1 in the ESI†).
Method validation
The calibration curves were constructed to quantitatively measure the modifications in RNA. A mixture of uridine modification standards with a series of amounts ranging from 0.016 pmol to 16 pmol and fixed amounts of isotope internal standards (D3-CMCT labelled derivatives) was prepared. The calibration curves were constructed by plotting the peak area ratios (analytes/IS) against the amounts of uridine modifications with triplicate measurements. The results showed that good linearities were obtained with the coefficient of determination (R2) being great than 0.9994 (Table S3 in the ESI†).
In addition, the accuracy of the established method was evaluated by comparing the measured contents of uridine modifications to the theoretical contents of uridine modifications. The intra- and inter-day relative standard deviations (RSDs) were calculated with different amounts of uridine modification standards for evaluation of the precision of the method. Three measurements over a day gave the intra-day RSDs, and the inter-day RSDs were determined by measuring samples for three consecutive days. The results showed that the intra- and inter-day RSDs for uridine modifications were less than 15.3% and relative errors (REs) were less than 7.8% (Table S4 in the ESI†), indicating that good precision and accuracy were achieved. Taken together, the results demonstrated that the developed method was reliable for the accurate quantification of uridine modifications.
Determination of m5U in mRNA in mammalian cells
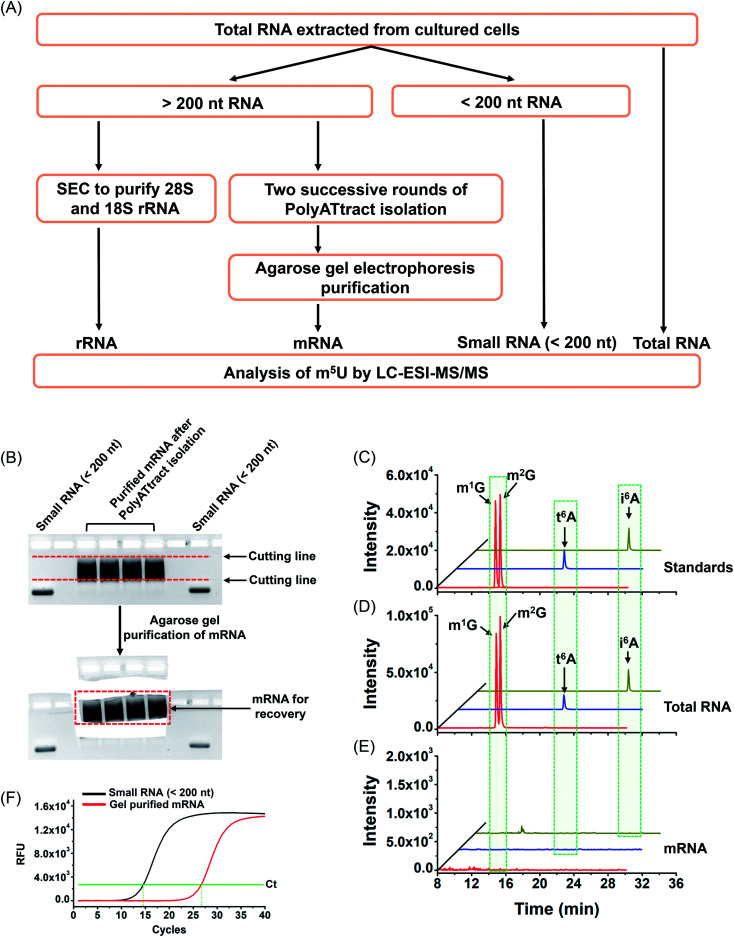
With the established method, we explored the potential existence of endogenous uridine modifications in mRNA from cultured human cell lines. Obtaining highly pure mRNA is very important for the determination of the existence of new modifications in mRNA. In this respect, here we developed a method to purify mRNA by successive three different methods, including (1) small RNA (<200 nt) depletion, (2) PolyATtract mRNA isolation (twice), and (3) agarose gel electrophoresis-based purification (Fig. 5A and B).
Fig. 5. Schematic illustration of the extraction of different species of RNA and evaluation of the purity of the isolated mRNA. (A) Schematic illustration of the extraction of different species of RNA. (B) Agarose gel electrophoresis-based purification. (C) Extracted-ion chromatograms of the standards of 4 modifications (m1G, m2G, t6A, and i6A). (D) Extracted-ion chromatograms of the 4 modifications detected in total RNA of HEK293T cells. (E) Extracted-ion chromatograms of the 4 modifications detected in mRNA of HEK293T cells. (F) Evaluation of the purity of the isolated mRNA by real-time quantitative PCR.
As tRNA contains abundant m5U modification,47 tRNA contamination could lead to a false positive result for the determination of m5U in mRNA. In this respect, small RNA (<200 nt) was first depleted from total RNA using the E.Z.N.A. miRNA kit. The resulting RNA was further purified twice with the PolyATtract mRNA isolation system followed by agarose gel electrophoresis-based purification (Fig. 5A and B). Four modifications (m1G, m2G, i6A, and t6A) that were reported to be only present in tRNA or rRNA were used to evaluate the purity of the isolated mRNA.9,48,49 Shown in Fig. 5C, D and 5E are the extracted-ion chromatograms of the standards of these 4 modifications, the detected modifications from total RNA and from mRNA of HEK293T cells, respectively. The results demonstrated that all these 4 modifications were clearly detected in total RNA (Fig. 5D), but were undetectable in mRNA (Fig. 5E), indicating the high purity of mRNA.
In addition, we used real-time quantitative PCR to evaluate the purity of the isolated mRNA. The detailed evaluation can be found in the ESI.† The real-time quantitative PCR analysis demonstrated that the potential contamination of small RNA was less than 0.023% in mRNA (Fig. S8 in the ESI†), i.e. less than 0.12 ng of small RNA in 500 ng of mRNA. We then analyzed m5U from 500 ng of mRNA. The peak of m5U from 500 ng of mRNA was clear and distinct (Fig. S9 in the ESI†). However, no signal of m5U was observed from 0.12 ng of small RNA (Fig. S9 in the ESI†), indicating that the m5U signal from 500 ng of mRNA indeed comes from mRNA, but not the potential trace level of small RNA. Similarly, the potential trace levels of 18S and 28S rRNA in mRNA should not compromise the detection of m5U in mRNA (details can be found in the ESI†). Moreover, the RNA-seq analysis demonstrated that 12 299 genes were detected in the isolated mRNA (Table S5 and S6 in the ESI†), indicating the good quality of the isolated mRNA.
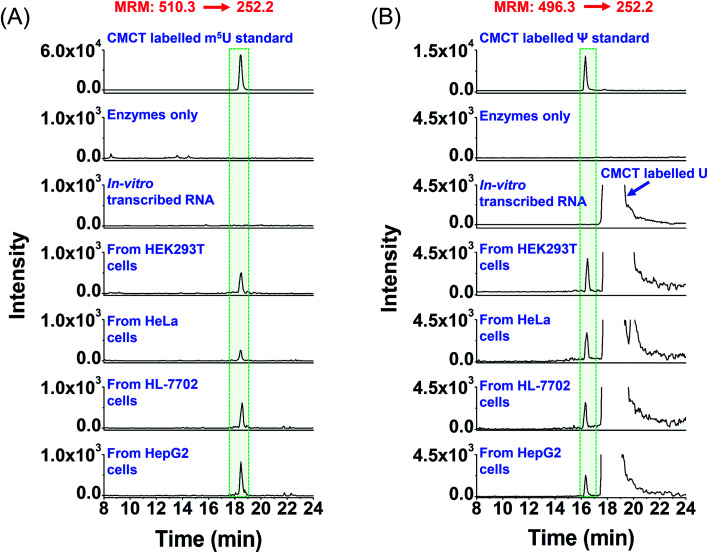
We then analysed the potential uridine modifications in mRNA. It turned out that among the 7 uridine modifications (Ψ, m5U, m6U, m1Ψ, hm5U, mo5U, and mcm5U), only m5U and Ψ were detectable in mRNA. Shown in Fig. 6A and B are the extracted-ion chromatograms of CMCT labelled m5U and Ψ in mRNA, respectively, from various cultured human cells. Although CMCT labelled m5U, m6U, and m1Ψ have the same molecular weight and the same MRM ion transition was used to monitor CMCT labelled m5U, m6U, and m1Ψ (Table S1 in the ESI†), they could be well separated in HPLC (the retention times of m5U, m6U, and m1Ψ were 21.06 min, 19.18 min and 18.55 min, respectively; Fig. S10A in the ESI†). Under these separation conditions, we confirmed that only m5U was detected in mRNA; no m6U or m1Ψ was detected (Fig. S10B in the ESI†). Since there is no detectable m6U or m1Ψ in mRNA of cultured human cells, we used the shorter gradient (Fig. 6) instead of the longer gradient (Fig. S10 in the ESI†) to detect m5U from mRNA.
Fig. 6. Extracted-ion chromatograms of the detected m5U and Ψ in mRNA of various human cells. (A) Extracted-ion chromatograms of m5U standards and the m5U detected in mRNA from human HEK293T, HeLa, HL-7702, and HepG2 cells. (B) Extracted-ion chromatograms of Ψ standards and the Ψ detected in mRNA from human HEK293T, HeLa, HL-7702, and HepG2 cells. “Enzyme only” represents the sample only containing the enzymes used for digestion (S1 nuclease, venom phosphodiesterase I, and calf intestinal alkaline phosphatase) and omitting the mRNA. The sequence of the in vitro transcribed RNA can be found in Table S7 in the ESI.† The mass transitions 510.3 → 252.2 for CMCT labelled m5U and 496.3 → 252.2 for CMCT labelled Ψ were used for the detection in MRM detection mode.
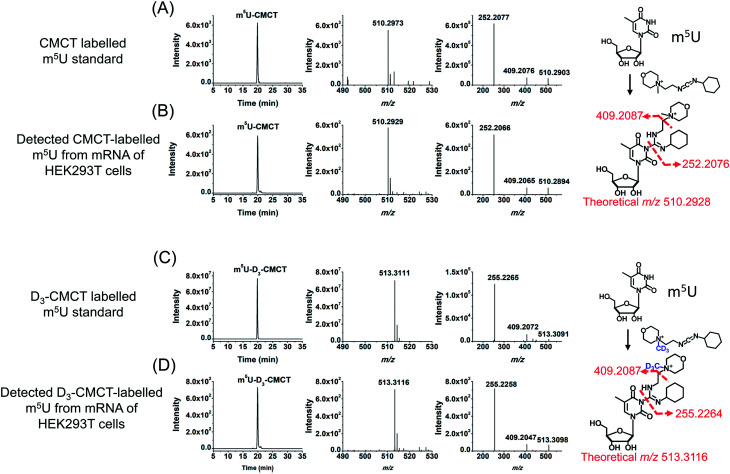
It can be seen that m5U and Ψ were undetectable in the control samples (only adding enzymes and omitting mRNA or in vitro transcribed RNA) (Fig. 6), which excludes the possibility that the detected m5U and Ψ were from the contamination of enzymes used in mRNA digestion. To further confirm the detected m5U and Ψ in mRNA, we also employed high-resolution mass spectrometry to examine the CMCT labelled m5U and Ψ. The results showed that the extracted-ion chromatograms, MS spectra and MS/MS spectra of CMCT/D3-CMCT labelled m5U and Ψ from the cultured HEK293T cells are identical to those of the standards (Fig. 7 and S11 in the ESI†), further confirming the detected m5U and Ψ in mRNA. These results collectively suggested that both m5U and Ψ were distinctly present in mRNA of mammals.
Fig. 7. Identification of m5U in mRNA of HEK293T cells by high-resolution mass spectrometry analysis. (A) The extracted-ion chromatogram (left panel), MS spectrum (middle panel) and MS/MS spectrum (right panel) of the CMCT labelled m5U standard. (B) The extracted-ion chromatogram (left panel), MS spectrum (middle panel) and MS/MS spectrum (right panel) of CMCT labelled m5U from mRNA of HEK293T cells. (C) The extracted-ion chromatogram (left panel), MS spectrum (middle panel) and MS/MS spectrum (right panel) of the D3-CMCT labelled m5U standard. (D) The extracted-ion chromatogram (left panel), MS spectrum (middle panel) and MS/MS spectrum (right panel) of D3-CMCT labelled m5U from mRNA of HEK293T cells.
Ψ modification has been previously reported to be present in mRNA of mammals with a potential role in enhancing transcript stability.35,36,50 It is worth noting that the universal existence of m5U in mRNA of various cell lines is first reported in the current study. On the other hand, detection of m5U by LC-ESI-MS/MS without CMCT labelling showed that no m5U was observed (Fig. S12 in the ESI†), indicating that the direct analysis of m5U is challenging and our developed chemical labelling method is capable of detecting low abundance of m5U in mRNA.
Metabolic labelling of cells
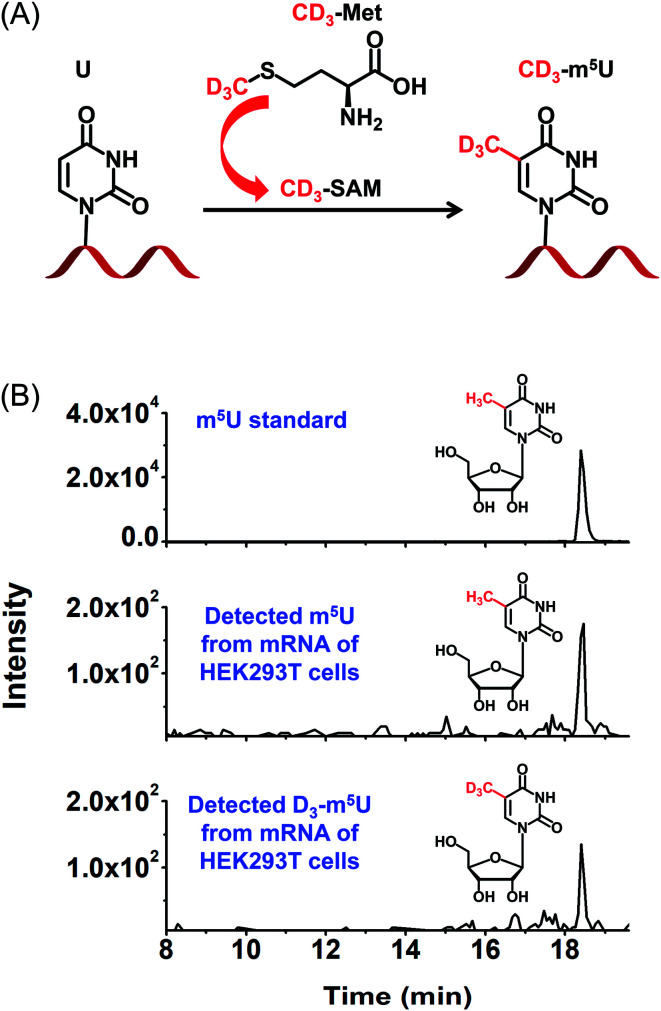
To further confirm the occurrence of m5U in mRNA of mammals, we used stable isotope tracing monitored by mass spectrometry (Fig. 8A). It has been known that ATP and l-methionine could be converted to S-adenosyl-l-methionine (SAM) by methionine adenosyltransferase, and SAM is a universal methylating agent for the methylation of nucleic acids.51 We cultured human HEK293T cells in DMEM medium supplied with 0.3 mM stable isotope labelled l-methionine (D3-Met). Then mRNA was isolated and analysed by our developed method. The result showed D3-m5U was distinctly detected besides m5U (Fig. 8B). The concentration of unlabelled methionine in the DMEM medium is 0.2 mM. Thus, the percentage of D3-Met in medium is approximately 60% of the total methionine. And approximately half of the measured m5U carried the CD3 group, which is comparable to the percentage of D3-Met in total methionine of the media. Extended culturing time of cells in the DMEM medium with added D3-Met will not increase the percentage of D3-m5U, further indicating that the methyl group of m5U is from SAM. Collectively, this result indicated that SAM was the methyl donor for the methylation of uridine in mRNA.
Fig. 8. Identification of m5U in mRNA of HEK293T cells using stable isotope tracing monitored by mass spectrometry. (A) DMEM medium supplied with D3-Met was used for the cell culturing. D3-Met could be converted to D3-SAM that is a methylating reagent for methylation of nucleic acids. (B) The extracted-ion chromatograms of the CMCT labelled m5U standard (upper panel), detected CMCT labelled m5U from mRNA of HEK293T cells (middle panel), and detected CMCT labelled D3-m5U from mRNA of HEK293T cells (bottom panel).
Content of m5U in different species of RNA
We then further quantitatively measured the content of m5U in different RNA species. In this respect, we isolated different types of RNA, including mRNA, 28S rRNA, 18S rRNA and small RNA (<200 nt) from HEK293T and HeLa cells. The purified 28S rRNA, 18S rRNA, and small RNA (<200 nt) were confirmed by agarose and polyacrylamide gel electrophoresis analysis (Fig. S13 in the ESI†).
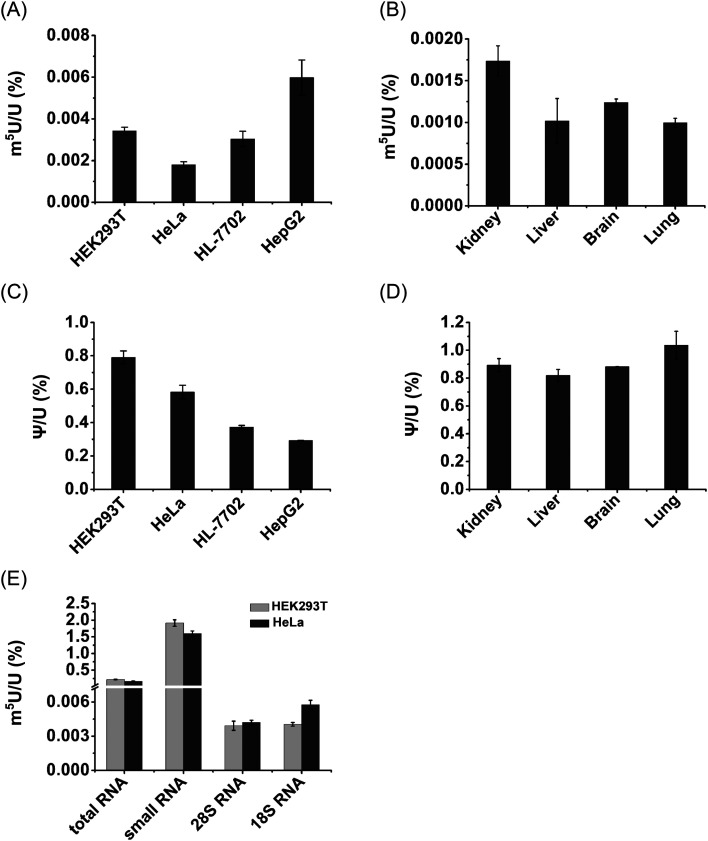
Notably, m5U was detectable in all species of RNA in both HEK293T and HeLa cells. The measured contents of m5U in mRNA of various human cells and mouse tissues ranged from 0.001% to 0.0059% (m5U/U) (Fig. 9A and B). In addition, the measured contents of Ψ in mRNA ranged from 0.29% to 1.04% (Ψ/U) (Fig. 9C and D), which are comparable to previously reported levels of Ψ in mRNA of mammals,13,36 indicating the good accuracy of the developed method.
Fig. 9. Measured contents of m5U in different cells, tissues and RNA species. (A) Measured contents of m5U in mRNA from various human cell lines. (B) Measured contents of m5U in mRNA from various mouse tissues. (C) Measured contents of Ψ in mRNA from various human cell lines. (D) Measured contents of Ψ in mRNA from various mouse tissues. (E) Measured contents of m5U in different RNA species from HEK293T and HeLa cells. These data represent the mean and standard deviation of results acquired from three independent experiments.
The contents of m5U in small RNA (<200 nt) of HEK293T and HeLa cells were 1.9% and 1.6% (m5U/U), respectively (Fig. 9E). The contents of m5U in 28S and 18S rRNA of HEK293T and HeLa cells ranged from 0.0039% to 0.0057% (m5U/U) (Fig. 9E). These results showed that small RNA (<200 nt) contained the most abundant m5U, while mRNA and rRNA had similar levels of m5U. It was reported that m5U was an abundant modification in tRNA.16 And a pervious study showed tRNA presents ∼90% of small RNA (<200 nt).52 Thus, the detected m5U in small RNA should mainly come from tRNA.
It has been known that over 150 types of modifications were identified in RNA,53 but only a small number of modifications were detected in mRNA of eukaryotes.9,11 Here, we demonstrated the existence of appreciable levels of m5U (0.001% to 0.0059%, m5U/U) in mRNA of mammalian cells. The measured content of m5U in mRNA is comparable to that of recently identified m6Am (∼0.003%, m6Am/A) and m3C (∼0.001–0.005%, m3C/C) in mRNA of mammals.22,54 It has been proposed that the modifications of m6Am and m3C in mRNA may affect the mRNA stability and translation efficiency.55,56 Although the potential role of m5U in mRNA remains elusive, we speculate that m5U in mRNA may affect its interaction with the ribosome as some other modifications. m5U could also lead to the alteration of RNA secondary structures and recruit m5U-specific binding proteins, and eventually impact translation.
Evaluation of the level of m5U in mRNA upon siRNA knockdown or overexpression of TRMT2A
In E. coli, TrmA catalyzes the formation of m5U in tRNA.57 In Saccharomyces cerevisiae, Trm2p is responsible for the formation of m5U in tRNA.58 TrmA and Trm2p catalyze methyl group transfer from S-adenosyl-methionine (SAM) to the C5 of U54 of tRNA.59 In mammals, tRNA methyltransferase 2 homologs (TRMT2A and TRMT2B) are predicted to be the homologs of yeast Trm2p.60 The predicted methyltransferase domain of TRMT2A has an identity of 36% with that of Trm2p. TRMT2A contains a RNA recognition motif (RRM) in the N-terminus. However, the shared identity between TRMT2B and Trm2p is 28%, and the TRMT2B protein does not have an RRM motif.60 This indicates that TRMT2A is the likely mammalian homolog of Trm2p.40 In this respect, here we examined whether TRMT2A was responsible for depositing m5U in mRNA upon siRNA knockdown or overexpression of the TRMT2A gene.
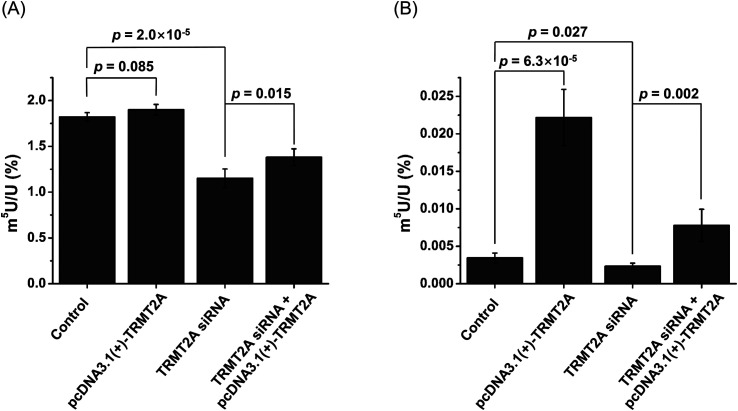
The real-time quantitative PCR and western blotting results demonstrated the efficient knockdown or overexpression of TRMT2A was achieved (Fig. S14 in the ESI†). Then we analyzed the level of m5U in small RNA and mRNA upon siRNA knockdown or overexpression of TRMT2A. The results showed a significant decrease of m5U in small RNA (p = 2.0 × 10⁻⁵, Fig. 10A), indicating that TRMT2A may be responsible for the formation of m5U in small RNA. However, no obvious increase of m5U in small RNA was observed for the overexpression of TRMT2A (p = 0.085, Fig. 10A). We reason that the increased amount of TRMT2A does not affect the homeostasis of m5U in small RNA in cells, which was also reported by a recent study.40 The rescue experiment showed the certain recovery of m5U in small RNA (Fig. 10A). As for the m5U in mRNA, we observed a significant decrease (p = 0.027) and significant increase (p = 6.3 × 10⁻⁵) of m5U in mRNA upon siRNA knockdown and overexpression of TRMT2A, respectively (Fig. 10B). The rescue experiment showed the efficient recovery of m5U in mRNA (Fig. 10B). The results demonstrated that TRMT2A should be responsible for the formation of m5U in mRNA.
Fig. 10. Effect of overexpression and siRNA knockdown of TRMT2A on the contents of m5U in small RNA and mRNA. (A) Contents of m5U in small RNA upon overexpression or siRNA knockdown of TRMT2A. (B) Contents of m5U in mRNA upon overexpression or siRNA knockdown of TRMT2A. Two-side unpaired t-test was performed. These data represent the mean and standard deviation of results acquired from three independent experiments.
Deciphering the distribution and dynamic change of m5U in mRNA will uncover the underlying mechanism of m5U. The transcriptome-wide mapping of m5U could be achieved by affinity pulldown of the m5U-containing RNA fragment followed by high-throughput sequencing. In addition, some modifications in RNA can lead to reverse transcription arrest or misincorporation of dNTP, which has been utilized as a characteristic signature for locating modifications by subsequent sequencing analysis.61 By virtue of this strategy of reverse transcription induced arrest or misincorporation of dNTP, people may evolve enzymes that are suitable for probing m5U and develop method for mapping m5U at single-base resolution. Moreover, the exploration of the m5U-specific binding proteins may reveal the readers of m5U and promote the understanding of the functional roles of m5U.
Conclusions
In summary, we established a method of CMCT labelling coupled with LC-ESI-MS/MS analysis for the sensitive determination of uridine modifications in RNA. The introduction of positively charged quaternary ammonium from CMCT can greatly increase the detection sensitivities of uridine modifications. Using the developed method, we identified the universal existence of m5U in mRNA of cultured mammalian cells and tissues. In addition, the stable isotope tracing monitored by mass spectrometry revealed that the methylation group of m5U was from SAM. The identification of demethylases and reader proteins of m5U will facilitate understanding the functions of m5U in the future.
Data availability
Gene expression by RNA-seq is available in the Gene Expression Omnibus (GEO) database at NCBI with accession number GSE135049.
Conflicts of interest
The authors declare no competing financial interest.
Supplementary Material
Acknowledgments
The work is supported by the National Key R&D Program of China (2017YFC0906800) and the National Natural Science Foundation of China [21672166, 21635006, 21721005, 21728802].
Electronic supplementary information (ESI) available: Quantification of modifications in RNA; CeO2 extraction of CMCT labelled nucleosides; evaluation of the purity of isolated mRNA by real-time quantitative PCR; analysis of mRNA by high-throughput sequencing; Table S1–S7; and Fig. S1–S14. See DOI: 10.1039/c9sc05094a
References
- Chen K. Zhao B. S. He C. Cell Chem. Biol. 2016;23:74–85. doi: 10.1016/j.chembiol.2015.11.007. [DOI] [PMC free article] [PubMed] [Google Scholar]
- Luo C. Hajkova P. Ecker J. R. Science. 2018;361:1336–1340. doi: 10.1126/science.aat6806. [DOI] [PMC free article] [PubMed] [Google Scholar]
- Frye M. Harada B. T. Behm M. He C. Science. 2018;361:1346–1349. doi: 10.1126/science.aau1646. [DOI] [PMC free article] [PubMed] [Google Scholar]
- Roundtree I. A. Evans M. E. Pan T. He C. Cell. 2017;169:1187–1200. doi: 10.1016/j.cell.2017.05.045. [DOI] [PMC free article] [PubMed] [Google Scholar]
- Boccaletto P. Machnicka M. A. Purta E. Piatkowski P. Baginski B. Wirecki T. K. de Crecy-Lagard V. Ross R. Limbach P. A. Kotter A. Helm M. Bujnicki J. M. Nucleic Acids Res. 2018;46:D303–D307. doi: 10.1093/nar/gkx1030. [DOI] [PMC free article] [PubMed] [Google Scholar]
- Liu T. Ma C. J. Yuan B. F. Feng Y. Q. Sci. China: Chem. 2018;61:381–392. doi: 10.1007/s11426-017-9186-y. [DOI] [Google Scholar]
- Jiang J. Seo H. Chow C. S. Acc. Chem. Res. 2016;49:893–901. doi: 10.1021/acs.accounts.6b00014. [DOI] [PubMed] [Google Scholar]
- Pan T. Cell Res. 2018;28:395–404. doi: 10.1038/s41422-018-0013-y. [DOI] [PMC free article] [PubMed] [Google Scholar]
- Song J. Yi C. ACS Chem. Biol. 2017;12:316–325. doi: 10.1021/acschembio.6b00960. [DOI] [PubMed] [Google Scholar]
- Chen Y. Hong T. Wang S. Mo J. Tian T. Zhou X. Chem. Soc. Rev. 2017;46:2844–2872. doi: 10.1039/C6CS00599C. [DOI] [PubMed] [Google Scholar]
- Zhao B. S. Roundtree I. A. He C. Nat. Rev. Mol. Cell Biol. 2017;18:31–42. doi: 10.1038/nrm.2016.132. [DOI] [PMC free article] [PubMed] [Google Scholar]
- Fisher A. J. Beal P. A. Curr. Opin. Struct. Biol. 2018;53:59–68. doi: 10.1016/j.sbi.2018.05.003. [DOI] [PubMed] [Google Scholar]
- Li X. Xiong X. Yi C. Nat. Methods. 2016;14:23–31. doi: 10.1038/nmeth.4110. [DOI] [PubMed] [Google Scholar]
- Arango D. Sturgill D. Alhusaini N. Dillman A. A. Sweet T. J. Hanson G. Hosogane M. Sinclair W. R. Nanan K. K. Mandler M. D. Fox S. D. Zengeya T. T. Andresson T. Meier J. L. Coller J. Oberdoerffer S. Cell. 2018;175:1872–1886. doi: 10.1016/j.cell.2018.10.030. [DOI] [PMC free article] [PubMed] [Google Scholar]
- Lian H. Wang Q. H. Zhu C. B. Ma J. Jin W. L. Trends Cancer. 2018;4:207–221. doi: 10.1016/j.trecan.2018.01.006. [DOI] [PubMed] [Google Scholar]
- Motorin Y. Helm M. Wiley Interdiscip. Rev.: RNA. 2011;2:611–631. doi: 10.1002/wrna.79. [DOI] [PubMed] [Google Scholar]
- Lee T. T. Agarwalla S. Stroud R. M. Structure. 2004;12:397–407. doi: 10.1016/j.str.2004.02.009. [DOI] [PubMed] [Google Scholar]
- Hur S. Stroud R. M. Finer-Moore J. J. Biol. Chem. 2006;281:38969–38973. doi: 10.1074/jbc.R600034200. [DOI] [PubMed] [Google Scholar]
- Felden B. Hanawa K. Atkins J. F. Himeno H. Muto A. Gesteland R. F. McCloskey J. A. Crain P. F. EMBO J. 1998;17:3188–3196. doi: 10.1093/emboj/17.11.3188. [DOI] [PMC free article] [PubMed] [Google Scholar]
- Kealey J. T. Gu X. Santi D. V. Biochimie. 1994;76:1133–1142. doi: 10.1016/0300-9084(94)90042-6. [DOI] [PubMed] [Google Scholar]
- Westermann A. J. Gorski S. A. Vogel J. Nat. Rev. Microbiol. 2012;10:618–630. doi: 10.1038/nrmicro2852. [DOI] [PubMed] [Google Scholar]
- Xu L. Liu X. Sheng N. Oo K. S. Liang J. Chionh Y. H. Xu J. Ye F. Gao Y. G. Dedon P. C. Fu X. Y. J. Biol. Chem. 2017;292:14695–14703. doi: 10.1074/jbc.M117.798298. [DOI] [PMC free article] [PubMed] [Google Scholar]
- Li Q. Y. Yuan B. F. Feng Y. Q. Chem. Lett. 2018;47:1453–1459. [Google Scholar]
- Lan M. D. Yuan B. F. Feng Y. Q. Chin. Chem. Lett. 2019;30:1–6. doi: 10.1016/j.cclet.2018.04.021. [DOI] [Google Scholar]
- Chen B. Yuan B. F. Feng Y. Q. Anal. Chem. 2019;91:743–756. doi: 10.1021/acs.analchem.8b04078. [DOI] [PubMed] [Google Scholar]
- Liu B. Liu X. Lai W. Wang H. Anal. Chem. 2017;89:6202–6209. doi: 10.1021/acs.analchem.7b01152. [DOI] [PubMed] [Google Scholar]
- Yin R. Mo J. Lu M. Wang H. Anal. Chem. 2015;87:1846–1852. doi: 10.1021/ac5038895. [DOI] [PubMed] [Google Scholar]
- Zhao B. Yang Y. Wang X. Chong Z. Yin R. Song S. H. Zhao C. Li C. Huang H. Sun B. F. Wu D. Jin K. X. Song M. Zhu B. Z. Jiang G. Rendtlew Danielsen J. M. Xu G. L. Yang Y. G. Wang H. Nucleic Acids Res. 2014;42:1593–1605. doi: 10.1093/nar/gkt1090. [DOI] [PMC free article] [PubMed] [Google Scholar]
- Tang Y. Chu J. M. Huang W. Xiong J. Xing X. W. Zhou X. Feng Y. Q. Yuan B. F. Anal. Chem. 2013;85:6129–6135. doi: 10.1021/ac4010869. [DOI] [PubMed] [Google Scholar]
- Yuan B. F. Methods Mol. Biol. 2017;1562:33–42. doi: 10.1007/978-1-4939-6807-7_3. [DOI] [PubMed] [Google Scholar]
- Qi B. L. Liu P. Wang Q. Y. Cai W. J. Yuan B. F. Feng Y. Q. TrAC, Trends Anal. Chem. 2014;59:121–132. doi: 10.1016/j.trac.2014.03.013. [DOI] [Google Scholar]
- Zhang H. Y. Xiong J. Qi B. L. Feng Y. Q. Yuan B. F. Chem. Commun. 2016;52:737–740. doi: 10.1039/C5CC07354E. [DOI] [PubMed] [Google Scholar]
- Hong H. Wang Y. Anal. Chem. 2007;79:322–326. doi: 10.1021/ac061465w. [DOI] [PMC free article] [PubMed] [Google Scholar]
- Patteson K. G. Rodicio L. P. Limbach P. A. Nucleic Acids Res. 2001;29:E49. doi: 10.1093/nar/29.10.e49. [DOI] [PMC free article] [PubMed] [Google Scholar]
- Schwartz S. Bernstein D. A. Mumbach M. R. Jovanovic M. Herbst R. H. Leon-Ricardo B. X. Engreitz J. M. Guttman M. Satija R. Lander E. S. Fink G. Regev A. Cell. 2014;159:148–162. doi: 10.1016/j.cell.2014.08.028. [DOI] [PMC free article] [PubMed] [Google Scholar]
- Li X. Zhu P. Ma S. Song J. Bai J. Sun F. Yi C. Nat. Chem. Biol. 2015;11:592–597. doi: 10.1038/nchembio.1836. [DOI] [PubMed] [Google Scholar]
- Lan M. D. Xiong J. You X. J. Weng X. C. Zhou X. Yuan B. F. Feng Y. Q. Chem.–Eur. J. 2018;24:9949–9956. doi: 10.1002/chem.201801640. [DOI] [PubMed] [Google Scholar]
- Augusti-Tocco G. Brown G. L. Nature. 1965;206:683–685. doi: 10.1038/206683a0. [DOI] [PubMed] [Google Scholar]
- Chu J. M. Qi C. B. Huang Y. Q. Jiang H. P. Hao Y. H. Yuan B. F. Feng Y. Q. Anal. Chem. 2015;87:7364–7372. doi: 10.1021/acs.analchem.5b01614. [DOI] [PubMed] [Google Scholar]
- Chang Y. H. Nishimura S. Oishi H. Kelly V. P. Kuno A. Takahashi S. Biochem. Biophys. Res. Commun. 2019;508:410–415. doi: 10.1016/j.bbrc.2018.11.104. [DOI] [PubMed] [Google Scholar]
- Seto C. Grossert J. S. Waddell D. S. Curtis J. M. Boyd R. K. J. Am. Soc. Mass Spectrom. 2001;12:571–579. doi: 10.1016/S1044-0305(01)00220-3. [DOI] [PubMed] [Google Scholar]
- Antoine M. Adams J. J. Am. Soc. Mass Spectrom. 1992;3:776–778. doi: 10.1016/1044-0305(92)87092-D. [DOI] [PubMed] [Google Scholar]
- Cheng C. Gross M. L. Mass Spectrom. Rev. 2000;19:398–420. doi: 10.1002/1098-2787(2000)19:6<398::AID-MAS3>3.0.CO;2-B. [DOI] [PubMed] [Google Scholar]
- Cydzik M. Rudowska M. Stefanowicz P. Szewczuk Z. J. Am. Soc. Mass Spectrom. 2011;22:2103–2107. doi: 10.1007/s13361-011-0245-2. [DOI] [PMC free article] [PubMed] [Google Scholar]
- Behm-Ansmant I. Helm M. Motorin Y. J. Nucleic Acids. 2011;2011:408053. doi: 10.4061/2011/408053. [DOI] [PMC free article] [PubMed] [Google Scholar]
- Ho N. W. Gilham P. T. Biochemistry. 1967;6:3632–3639. doi: 10.1021/bi00864a002. [DOI] [PubMed] [Google Scholar]
- Carell T. Brandmayr C. Hienzsch A. Muller M. Pearson D. Reiter V. Thoma I. Thumbs P. Wagner M. Angew. Chem., Int. Ed. 2012;51:7110–7131. doi: 10.1002/anie.201201193. [DOI] [PubMed] [Google Scholar]
- Taoka M. Nobe Y. Yamaki Y. Sato K. Ishikawa H. Izumikawa K. Yamauchi Y. Hirota K. Nakayama H. Takahashi N. Isobe T. Nucleic Acids Res. 2018;46:9289–9298. doi: 10.1093/nar/gky811. [DOI] [PMC free article] [PubMed] [Google Scholar]
- Duechler M. Leszczynska G. Sochacka E. Nawrot B. Cell. Mol. Life Sci. 2016;73:3075–3095. doi: 10.1007/s00018-016-2217-y. [DOI] [PMC free article] [PubMed] [Google Scholar]
- Carlile T. M. Rojas-Duran M. F. Zinshteyn B. Shin H. Bartoli K. M. Gilbert W. V. Nature. 2014;515:143–146. doi: 10.1038/nature13802. [DOI] [PMC free article] [PubMed] [Google Scholar]
- Landgraf B. J. McCarthy E. L. Booker S. J. Annu. Rev. Biochem. 2016;85:485–514. doi: 10.1146/annurev-biochem-060713-035504. [DOI] [PubMed] [Google Scholar]
- Su D. Chan C. T. Gu C. Lim K. S. Chionh Y. H. McBee M. E. Russell B. S. Babu I. R. Begley T. J. Dedon P. C. Nat. Protoc. 2014;9:828–841. doi: 10.1038/nprot.2014.047. [DOI] [PMC free article] [PubMed] [Google Scholar]
- Machnicka M. A. Milanowska K. Osman Oglou O. Purta E. Kurkowska M. Olchowik A. Januszewski W. Kalinowski S. Dunin-Horkawicz S. Rother K. M. Helm M. Bujnicki J. M. Grosjean H. Nucleic Acids Res. 2013;41:D262–D267. doi: 10.1093/nar/gks1007. [DOI] [PMC free article] [PubMed] [Google Scholar]
- Molinie B. Wang J. Lim K. S. Hillebrand R. Lu Z. X. Van Wittenberghe N. Howard B. D. Daneshvar K. Mullen A. C. Dedon P. Xing Y. Giallourakis C. C. Nat. Methods. 2016;13:692–698. doi: 10.1038/nmeth.3898. [DOI] [PMC free article] [PubMed] [Google Scholar]
- Mauer J. Luo X. Blanjoie A. Jiao X. Grozhik A. V. Patil D. P. Linder B. Pickering B. F. Vasseur J. J. Chen Q. Gross S. S. Elemento O. Debart F. Kiledjian M. Jaffrey S. R. Nature. 2017;541:371–375. doi: 10.1038/nature21022. [DOI] [PMC free article] [PubMed] [Google Scholar]
- Liu F. He C. J. Biol. Chem. 2017;292:14704–14705. doi: 10.1074/jbc.H117.798298. [DOI] [PMC free article] [PubMed] [Google Scholar]
- Ny T. Bjork G. R. J. Bacteriol. 1980;142:371–379. doi: 10.1128/JB.142.2.371-379.1980. [DOI] [PMC free article] [PubMed] [Google Scholar]
- Nordlund M. E. Johansson J. O. von Pawel-Rammingen U. Bystrom A. S. RNA. 2000;6:844–860. doi: 10.1017/S1355838200992422. [DOI] [PMC free article] [PubMed] [Google Scholar]
- Urbonavicius J. Jager G. Bjork G. R. Nucleic Acids Res. 2007;35:3297–3305. doi: 10.1093/nar/gkm205. [DOI] [PMC free article] [PubMed] [Google Scholar]
- Towns W. L. Begley T. J. DNA Cell Biol. 2012;31:434–454. doi: 10.1089/dna.2011.1437. [DOI] [PMC free article] [PubMed] [Google Scholar]
- Schwartz S. Motorin Y. RNA Biol. 2017;14:1124–1137. doi: 10.1080/15476286.2016.1251543. [DOI] [PMC free article] [PubMed] [Google Scholar]
Associated Data
This section collects any data citations, data availability statements, or supplementary materials included in this article.
Supplementary Materials
Data Availability Statement
Gene expression by RNA-seq is available in the Gene Expression Omnibus (GEO) database at NCBI with accession number GSE135049.


