

Abstract
Coronavirus disease 2019 (COVID-19), caused by severe acute respiratory syndrome coronavirus 2 (SARS-CoV-2), has been reported as a global emergency. As respiratory dysfunction is a major clinical presentation of COVID-19, chest computed tomography (CT) plays a central role in the diagnosis and management of patients with COVID-19. Recent advances in imaging approaches using artificial intelligence have been essential as a quantification and diagnostic tool to differentiate COVID-19 from other respiratory infectious diseases. Furthermore, cardiovascular involvement in patients with COVID-19 is not negligible and may result in rapid worsening of the disease and sudden death. Cardiac magnetic resonance imaging can accurately depict myocardial involvement in SARS-CoV-2 infection. This review summarizes the role of the radiology department in the management and the diagnosis of COVID-19, with a special emphasis on ultra-high-resolution CT findings, cardiovascular complications and the potential of artificial intelligence.
Keywords: COVID-19, Computed tomography, Cardiac magnetic resonance, Artificial intelligence, Pulmonary embolism
Abbreviations: ACE2, Angiotensin-converting enzyme 2; COVID-19, Coronavirus disease 2019; CO-RADS, COVID-19 reporting and data system classification system; CT, Computed tomography; DVT, Deep vein thrombosis; MRI, Magnetic resonance imaging; PCR, Polymerase chain reaction; PE, Pulmonary embolism; PPE, Personal protective equipment; RT, Radiological technologist; SARS-CoV-2, Severe acute respiratory syndrome coronavirus 2; U-HRCT, Ultra-high-resolution computed tomography; VTE, Venous thromboembolism
1. Introduction
Coronavirus disease 2019 (COVID-19), caused by severe acute respiratory syndrome coronavirus 2 (SARS-CoV-2), has been reported as a global emergency. Due to the extensive transmissibility and high rate of death, the World Health Organization declared the COVID-19 spread a pandemic. As respiratory dysfunction is a major clinical presentation of COVID-19, chest computed tomography (CT) plays a central role in the diagnosis and management of patients with COVID-19 [1], [2]. Recent advances in imaging approaches using artificial intelligence (AI) have been essential as a quantification and diagnostic tool for differentiating COVID-19 from other respiratory infectious diseases. Furthermore, cardiovascular involvement in patients with COVID-19 is not negligible and may be related to the rapid worsening of the disease and sudden death. Cardiac magnetic resonance imaging can accurately detect myocardial involvement in SARS-CoV-2 infection. The purpose of this review was to summarize the role of the radiology department in the management and the diagnosis of COVID-19.
2. Infection control inside CT suites
Human-to-human transmission via droplets and contact has been established as the main mode of transmission for COVID-19. The infection rate among people in the hospital is reportedly around 41% (29% for hospital staff and 12% for inpatients) [3]. In the radiology department, many outpatients and inpatients with various disease statuses, including COVID-19, undergo imaging examinations in a limited space [4], and there may be a substantial risk of hospital-related transmission of SARS-CoV-2 [5]. Therefore, careful attention should be paid to safety management in the CT suite.
In our institution, one of the three CT scanning machines has been used to evaluate COVID-19 patients. CT examinations were performed according to the flowchart in Fig. 1 to separate patients with positive and negative COVID-19 results. For the evaluation of positive or highly suspected COVID-19 patients, the CT examinations were performed using the “2 radiological technologist (RT)” protocol to avoid spreading the SARS-CoV-2 in the CT suite (Fig. 2, Fig. 3 ) [6]. One RT uses personal protective equipment (PPE) to set up the patient on the CT imaging table, while the other RT operated the CT console. The PPE includes eye protection (goggles), a filtering facepiece respirator (N95), a surgical cap, gloves, a fluid-resistant gown, and shoe covers. For disinfection after scanning, we wiped the contact surfaces in the CT suite with alcohol-based disinfectants and ultraviolet-wand sanitizers. However, our protocol was problematic. Asymptomatic and pre-symptomatic COVID-19 patients may be examined using a “usual” CT protocol (Fig. 1). If their CT images showed no significant lung opacity, the virus could potentially be transmitted to the next patient. To reduce the risk, the usual CT machine room equipment should be sanitized at least three times a day [7]. Compared with CT suites, there may be less risk of hospital-related transmission in the radiology reading room. However, it may be better for radiologists to work in remote rooms. In this regard, the importance of “teleradiology” has been increasing since the COVID-19 pandemic. Three-dimensional printed face protective shield may be helpful in an institution with shortage of PPE [8].
Fig. 1.

Flowchart for the CT examination. CT = computed tomography; COVID-19 = coronavirus disease 2019; HEPA = high efficiency particulate air; RT = radiological technologist.
Fig. 2.

Schematic of CT suite in the setting of the patient infected with SARS-CoV-2. CT = computed tomography; MD = medical doctor; P = patient; PPE = personal protective equipment; RT = radiological technologist; SARS-CoV-2 = severe acute respiratory syndrome coronavirus 2.
Fig. 3.

Process and staff distribution in the CT scanning machines and console rooms during CT examination of the patient infected with SARS-CoV-2. CT = computed tomography; P = patient; RT = radiological technologist; SARS-CoV-2 = severe acute respiratory syndrome coronavirus 2.
3. Typical CT characteristics of COVID-19
Typical chest CT findings of COVID-19 pneumonia include ground glass opacity (GGO) in a peripheral, posterior, and diffuse or lower lung zone distribution [9], [10], [11], [12], [13], [14], [15], [16]. “Crazy-paving pattern” and “reversed halo sign” were also representative chest CT findings observed in patients with COVID-19 pneumoniae [17], [18], [19]. Serial evaluation of chest CT scans may be useful for monitoring disease progression and patient condition (Fig. 4 ) [20], [21], [22]. Many studies have reported chest CT findings of COVID-19 pneumonia. For instance, a prior study showed that lesions adjacent to the pleura are associated with a high rate of respiratory failure in patients with COVID-19 [23]. Another study demonstrated that bilateral GGO, peripheral-predominant lesions without airway abnormalities, nodules, mediastinal lymph nodes, and pleural effusion, yielded high diagnostic performance with area under the curve in the receiver operating characteristic analysis of 0.88–0.92 for differentiating COVID-19 pneumonia from other respiratory diseases [24]. The COVID-19 Reporting and Data System classification system (CO-RADS) was established by the Dutch Radiological Society to classify the level of suspicion of COVID-19 pneumonia [25]. In CO-RADS, categories 3, 4, and 5 are indeterminate and typical for COVID-19 pneumonia, respectively [26]. However, most of these CT imaging features are non-specific, and pooled analysis showed high sensitivity (93%) and relatively low specificity (69%) using CO-RADS thresholds of at least 3 [26]. In addition, the usefulness of preoperative chest CT screening for COVID-19 is doubtful and may potentially lead to unnecessary delay of the surgery [27].
Fig. 4.

Serial change in ultra-high-resolution computed tomography images in a 69-year-old man with coronavirus disease 2019 pneumonia. (A) Five days after onset of symptom, ground glass opacity and reticulation are seen in the right lower lung. (B) Fourteen days after onset of symptom, consolidation worsened and linear opacities, indicating atelectasis, become apparent (thin arrows). Enlargement of pulmonary artery near the consolidation is detected (thick arrow). (C) Thirty-two day after onset of symptom, consolidation and atelectasis improved, but ground glass opacity remained. (D) Seven months after onset of symptom, CT reveals slight reticulation in the right lower lung. Enlargement of pulmonary artery improved.
4. Specific imaging features of the chest in COVID-19: Alveolar collapse and vascular enlargement
Alveolar collapse or focal atelectasis is an important feature of chest CT in COVID-19 [28]. As SARS-CoV-2 binds to the angiotensin-converting enzyme 2 (ACE2) on pulmonary epithelial cells and causes acute pneumonia, SARS-CoV-2 can also suppress pulmonary surfactant production in alveolar epithelial type II cells using the ACE2 receptor [29]. Reduced pulmonary surfactant may be one of the most important factors causing alveolar collapse in COVID-19, leading to acute respiratory distress syndrome. Drugs containing surfactants (e.g., ciclesonide) have been reported to be potentially effective against COVID-19 [30]. To evaluate the alveolar collapse, the tiny structures in the affected lung tissue, that is, the Reid's secondary lobules, should be visualized (Fig. 5 ). Ultra-high-resolution CT (U-HRCT), which has maximum in-plane spatial resolution of 0.15 mm (pixel size 2048 × 2048) and through-plane spatial resolution of 0.2 mm, can be clinically useful for such purpose [28]. The size of the Reid's secondary lobule was approximately 10 mm in diameter [31]. U-HRCT images have the capability to clearly demonstrate that the size of the affected lobule is smaller than that of unaffected lobules in the “crazy-paving” appearance, which may be highly suggestive of COVID-19 lung lesions (Fig. 5) [28]. In our experience, alveolar collapse may be related to lung volume reduction, leading to impaired pulmonary function [28]. Furthermore, CT disease severity is considered an independent predictor of fibrotic-like changes 6 months after COVID-19 infection (post-acute COVID-19 syndrome) [32].
Fig. 5.

Ultra-high-resolution computed tomography images in an 80-year-old woman with COVID 19. (A) Magnified CT image in the sagittal plane shows ground glass opacities and linear opacity patchy in dorsal peripheral zone of the right lower lung. (B) Magnified CT image in the coronal plane shows the Reid's secondary lobules (arrows). The size of affected lobule (arrowheads) is smaller than that of unaffected lobules (arrows). Crazy-paving appearance is also clearly depicted.
Another important CT imaging feature is pulmonary vascular enlargement in the affected lung [33], [34]. Underlying mechanisms of vascular findings has not been elucidated, but may be vascular inflammation, endothelial damage, microthrombosis and dysfunctional vasoregulation [35]. Although the pathophysiology has not been thoroughly investigated, “vascular enlargement” is an important diagnostic finding for COVID-19. Our previous study revealed that pulmonary vascular enlargement (subsegmental vascular diameter > 4 mm) and lesion extent on CT were independent predictors of disease severity [34]. For the visual assessment of the vascular enlargement, we believe that the comparison of the vessel diameters in the diseased and non-diseased lung by using the slab maximum intensity projection images (10–20 mm thickness) may be helpful (Fig. 6 ).
Fig. 6.
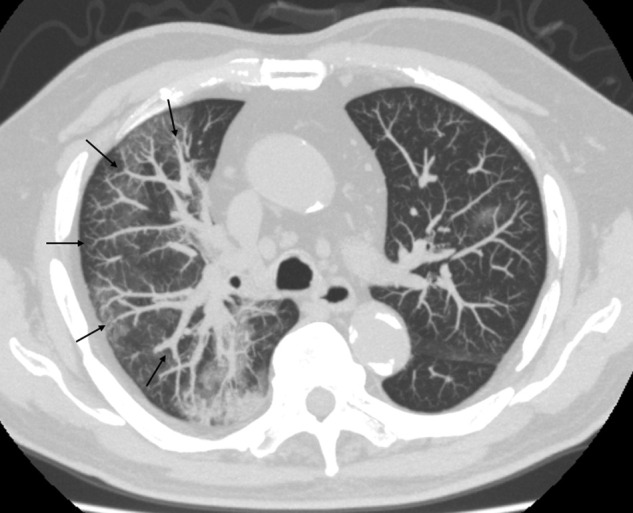
An 80-year-old man with coronavirus disease 2019 pneumonia. Thin-slab maximum intensity projection CT image (8-mm thickness) in the axial plane shows larger vessels in the affected lung (right upper lobe, arrows) than those in the less affected lung (left upper lobe).
Dual-energy CT imaging can depict not only dilated pulmonary vessels, but also perfusion abnormalities. Lang et al. reported that mosaic perfusion pattern, regional hyperemia overlapping with areas of pulmonary opacities or immediately surrounding the opacities, and opacities associated with corresponding oligemia were frequently observed in dual-energy CT in 96%, 52%, and 96% of the COVID-19 patients, respectively [33]. Imaging scrutiny using U-HRCT and dual-energy CT may improve the diagnostic ability and provide useful information for patient management.
5. Cardiovascular complications in COVID-19
Cardiovascular complications, such as acute myocardial injury, heart failure, pulmonary embolism, myocarditis/pericarditis, and ventricular arrhythmias, are not negligible in patients with COVID-19 [36]. The mechanism of this syndrome has not been elucidated, but it is suspected to have multifactorial causes, such as endothelial dysfunction, systemic cytokine-mediated injury, or stress-related cardiomyopathy [37]. A recent paper summarized the role of imaging modalities for the assessment of cardiac involvement in COVID-19 patients, recommending echocardiography for heart failure, contrast-enhanced CT for pulmonary embolism, and magnetic resonance imaging for myocarditis [38].
A significant rate of venous thromboembolism (VTE), such as pulmonary embolism (PE) or deep venous thrombosis (DVT), has been reported in patients with COVID-19 (Fig. 7 ) [39]. In hospitalized COVID-19 patients, the incidence of PE is reported to be approximately 1.9–8.9% [40], [41], [42]. The efficacy of antithrombotic therapy may be insufficient, as PE occurred in 16.7% of COVID-19 patients despite thromboprophylaxis [43]. Regarding the prevalence of DVT in COVID-19, an autopsy study including 12 consecutive patients revealed DVT in 58% (7/12) of patients without DVT suspicion before death [44]. A recent meta-analysis showed that the incidence rates of PE and DVT were 16.5% and 14.8%, respectively. DVT was present in 42.4% of patients with PE. D-dimer may be a useful test for screening of PE with an area under the receiver operating characteristic curve of 0.737 [45]. However, a substantial number of COVID-19 patients have elevated D-dimer, so careful interpretation should be needed to identify patients with PE [46], [47]. Little is known regarding the underlying mechanism of VTE in patients with COVID-19; however, hypoxia, inflammatory response, and cytokine storm may contribute to a hypercoagulable state [48]. In addition, a previous case report has shown the concomitant acute aortic thrombosis and pulmonary embolism, suggesting potential hyper-coagulability associated with SARS-CoV-2 infection [49].
Fig. 7.

Acute pulmonary embolism in a 71-year-old man with coronavirus disease 2019. (A) CT image in the axial plane shows consolidation in the right lower lung, and ground glass opacity in the left lower lung (arrowheads). (B, C), CT images in the axial (B) and coronal (B) planes reveal contrast defect suspicious of thrombus in the right lower pulmonary artery (arrows).
The prevalence of myocardial injury, defined as an elevation of the serum troponin levels, was reported to be 17–36% in patients with COVID-19 [37]. In a study performed in New York, 985 of 2736 (36%) patients with COVID-19 had elevated levels of serum troponin I (> 0.03 ng/dL), and patients showing even a slight elevation of troponin I had a significantly worse survival probability compared to those with normal troponin I [50]. In a study done in Wuhan, serum creatine kinase MB, myoglobin, troponin I, and NT-pro brain natriuretic peptide levels were significantly higher in those who died of COVID-19 patients than in those who survived [51]. These results demonstrate that myocardial injury is not rare and is an important complication in patients with COVID-19. Non-invasive imaging modalities, such as echocardiography and magnetic resonance imaging, play an important role in the detection of myocardial injury. Right ventricular dilatation was detected in 8–41% of COVID-19 patients [52], [53], [54], [55], [56] and is a significant predictor of mortality [54]. Cardiac MRI can detect inflammation or necrosis evoked by myocarditis [57], with a recent study showing that 78 (78%) of 100 COVID-19 patients had abnormal findings on cardiac MRI, including elevated native T1 time (73%), native T2 time (60%), and late gadolinium enhancement (32%) (Fig. 8 ). Further studies are necessary to elucidate the mechanism and clinical relevance, such as prognostic value, of these cardiac abnormalities in COVID-19 patients.
Fig. 8.

Myopericarditis in a 68-year-old man with coronavirus disease 2019. (A, B), CT images in the axial plane using lung (A) and mediastinal (B) windows reveal peripheral and bilateral consolidation and linear opacity in the lower lung (arrowheads, A) and a small amount of pericardial effusion was detected (arrows, B). (C), Cardiac magnetic resonance image (T1 mapping) shows elevated native T1 time in the anteroseptal-inferior wall (arrows), suggesting myocardial edema.
6. Artificial intelligence
As described previously, medical imaging, especially CT of the chest, plays an important role in the diagnosis of COVID-19; however, interpretation of chest CT findings of COVID-19 pneumonia is sometimes difficult for clinicians who are not familiar with chest CT images. Modern AI technology can assist clinicians mainly on two aspects: 1) improving the accuracy of COVID-19 pneumonia diagnosis and 2) automatic segmentation and quantification of lung disease by COVID-19.
To improve the accuracy for diagnosing COVID-19, many AI algorithms have been introduced [58]. For instance, COVNet based on ResNet50 was proposed by Li et al. [59], which included 4352 chest CT examinations obtained from 3322 patients, achieved a sensitivity of 90%, specificity of 96%, and area under the receiver operating characteristics curve of 0.96 for classifying COVID-19 class. A model made by Ni et al., which included 19,291 CT examinations of 14,435 individuals [60], yielded 94% accuracy and 100% sensitivity, and was superior to the diagnostic performance of radiologists. The fast-track COVID-19 classification network, based on VGG16 and ResNet-50, can classify COVID-19, other pneumonia, and non-pneumonia with an accuracy of 96.97% [61]. Use of these AI-based algorithms may improve the diagnostic process for COVID-19 pneumonia.
For the automatic segmentation of lung disease by COVID-19, we developed a machine learning method using the results of segmentation by an expert radiologist. This computer-based automatic segmentation enables classification of lung lesions into four parts as follows: normal (violet), GGO (green), reticulation (blue), and consolidation (orange) (Fig. 9 ) [34]. Furthermore, the volume of disease lesions (GGO, reticulation, and consolidation) are significantly correlated with disease severity, as reflected by low oxygen saturation, high serum C-reactive protein, high lactate dehydrogenase, and high D-dimer levels [34]. This algorithm enables objective segmentation of lung disease and may provide new insights into the risk stratification of COVID-19 patients.
Fig. 9.

Automated segmentation of lung disease by COVID-19 using artificial intelligence. Computer-based segmentation enables objective classification of lung lesions into four parts in a 76-year-old man with coronavirus disease 2019 pneumonia. (A)-(C): Two-dimensional CT segmentation images, (D): Three-dimensional CT segmentation image. Violet indicates normal lung parenchyma; green indicates ground glass opacity; blue indicates reticulation; orange indicates consolidation.
7. Conclusion
In summary, various non-invasive imaging modalities play important roles in the management of COVID-19. U-HRCT of the lung can precisely evaluate pathologic changes in the alveoli and pulmonary vessels, and serial assessment may be useful for monitoring disease severity. Myocardial involvement is not rare in patients with COVID-19, and cardiac MRI may be important for detecting myocardial abnormalities. Although there are many challenges, AI may improve the diagnostic process and quantification of disease severity, leading to appropriate risk stratification for COVID-19 pneumonia.
Human rights
The authors declare that the work described has been carried out in accordance with the Declaration of Helsinki of the World Medical Association revised in 2013 for experiments involving humans.
Informed consent and patient details
The authors declare that this report does not contain any personal information that could lead to the identification of the patients.
Disclosure of interest
The authors declare that they have no competing interest.
Funding
This work did not receive any grant from funding agencies in the public, commercial, or not-for-profit sectors.
Author contributions
All authors attest that they meet the current International Committee of Medical Journal Editors (ICMJE) criteria for Authorship.
CRediT author statement
Shingo Kato: conceptualization, writing; Yoshinobu Ishiwata: writing, Ryo Aoki: writing; Tae Iwasawa: writing; Eri Hagiwara: supervision; Takashi Ogura, supervision; Daisuke Utsunomiya: writing- reviewing and editing,
References
- 1.Li J., Long X., Wang X., Fang F., Lv X., Zhang D., et al. Radiology indispensable for tracking COVID-19. Diagn Interv Imaging. 2021;102:69–75. doi: 10.1016/j.diii.2020.11.008. [DOI] [PMC free article] [PubMed] [Google Scholar]
- 2.Farfour E., Mellot F., Lesprit P., Vasse M., group SA-C-Fhs SARS-CoV-2 RT-PCR and chest CT, two complementary approaches for COVID-19 diagnosis. Jpn J Radiol. 2020;38:1209–1210. doi: 10.1007/s11604-020-01016-1. [DOI] [PMC free article] [PubMed] [Google Scholar]
- 3.Wang D., Hu B., Hu C., Zhu F., Liu X., Zhang J., et al. Clinical characteristics of 138 hospitalized patients with 2019 novel coronavirus-infected pneumonia in Wuhan, China. JAMA. 2020;323:1061–1069. doi: 10.1001/jama.2020.1585. [DOI] [PMC free article] [PubMed] [Google Scholar]
- 4.Machitori A., Noguchi T., Kawata Y., Horioka N., Nishie A., Kakihara D., et al. Computed tomography surveillance helps tracking COVID-19 outbreak. Radiol. 2020;38:1169–1176. doi: 10.1007/s11604-020-01026-z. [DOI] [PMC free article] [PubMed] [Google Scholar]
- 5.Deng M. The prevention and management of the coronavirus disease 2019 (COVID-19) outbreak in radiology departments in epidemic areas. Jpn J Radiol. 2020;38:483–488. doi: 10.1007/s11604-020-00974-w. [DOI] [PMC free article] [PubMed] [Google Scholar]
- 6.Nakajima K., Kato H., Yamashiro T., Izumi T., Takeuchi I., Nakajima H., et al. COVID-19 pneumonia: infection control protocol inside computed tomography suites. Jpn J Radiol. 2020;38:391–393. doi: 10.1007/s11604-020-00948-y. [DOI] [PMC free article] [PubMed] [Google Scholar]
- 7.An P., Ye Y., Chen M., Chen Y., Fan W., Wang Y. Management strategy of novel coronavirus (COVID-19) pneumonia in the radiology department: a Chinese experience. Diagn Interv Radiol. 2020;26:200–203. doi: 10.5152/dir.2020.20167. [DOI] [PMC free article] [PubMed] [Google Scholar]
- 8.Sapoval M., Gaultier A.L., Del Giudice C., Pellerin O., Kassis-Chikhani N., Lemarteleur V., et al. 3D-printed face protective shield in interventional radiology: evaluation of an immediate solution in the era of COVID-19 pandemic. Diagn Interv Imaging. 2020;101:413–415. doi: 10.1016/j.diii.2020.04.004. [DOI] [PMC free article] [PubMed] [Google Scholar]
- 9.Chung M., Bernheim A., Mei X., Zhang N., Huang M., Zeng X., et al. CT imaging features of 2019 novel coronavirus (2019-nCoV) Radiology. 2020;295:202–207. doi: 10.1148/radiol.2020200230. [DOI] [PMC free article] [PubMed] [Google Scholar]
- 10.Bernheim A., Mei X., Huang M., Yang Y., Fayad Z.A., Zhang N., et al. Chest CT findings in coronavirus disease-19 (COVID-19): relationship to duration of infection. Radiology. 2020;295:200463. doi: 10.1148/radiol.2020200463. [DOI] [PMC free article] [PubMed] [Google Scholar]
- 11.Pan F., Ye T., Sun P., Gui S., Liang B., Li L., et al. Time course of lung changes at chest CT during recovery from coronavirus disease 2019 (COVID-19) Radiology. 2020;295:715–721. doi: 10.1148/radiol.2020200370. [DOI] [PMC free article] [PubMed] [Google Scholar]
- 12.Duan X., Guo X., Qiang J. A retrospective study of the initial 25 COVID-19 patients in Luoyang, China. Jpn J Radiol. 2020;38:683–690. doi: 10.1007/s11604-020-00988-4. [DOI] [PMC free article] [PubMed] [Google Scholar]
- 13.Fan N., Fan W., Li Z., Shi M., Liang Y. Imaging characteristics of initial chest computed tomography and clinical manifestations of patients with COVID-19 pneumonia. Jpn J Radiol. 2020;38:533–538. doi: 10.1007/s11604-020-00973-x. [DOI] [PMC free article] [PubMed] [Google Scholar]
- 14.Devie A., Kanagaratnam L., Perotin J.M., Jolly D., Ravey J.N., Djelouah M., et al. COVID-19: a qualitative chest CT model to identify severe form of the disease. Diagn Interv Imaging. 2021;102:77–84. doi: 10.1016/j.diii.2020.12.002. [DOI] [PMC free article] [PubMed] [Google Scholar]
- 15.Scialpi M., Piscioli I., Improta A., Carpini D.D., Mancioli F. Appropriate terms for chest CT features in COVID-19 infection. Jpn J Radiol. 2020;38:1108. doi: 10.1007/s11604-020-01002-7. [DOI] [PMC free article] [PubMed] [Google Scholar]
- 16.Neveu S., Saab I., Dangeard S., Bennani S., Tordjman M., Chassagnon G., et al. Incidental diagnosis of Covid-19 pneumonia on chest computed tomography. Diagn Interv Imaging. 2020;101:457–461. doi: 10.1016/j.diii.2020.05.011. [DOI] [PMC free article] [PubMed] [Google Scholar]
- 17.Salehi S., Abedi A., Balakrishnan S., Gholamrezanezhad A. Coronavirus disease 2019 (COVID-19): a systematic review of imaging findings in 919 patients. AJR Am J Roentgenol. 2020;215:87–93. doi: 10.2214/AJR.20.23034. [DOI] [PubMed] [Google Scholar]
- 18.Cellina M., Orsi M., Valenti Pittino C., Toluian T., Oliva G. Chest computed tomography findings of COVID-19 pneumonia: pictorial essay with literature review. Jpn J Radiol. 2020;38:1012–1019. doi: 10.1007/s11604-020-01010-7. [DOI] [PMC free article] [PubMed] [Google Scholar]
- 19.Bekci T. “Reversed halo sign” on 3D CT in COVID-19. Diagn Interv Radiol. 2020;26:379. doi: 10.5152/dir.2020.20254. [DOI] [PMC free article] [PubMed] [Google Scholar]
- 20.Zhuang Y., Lin L., Xu X., Xia T., Yu H., Fu G., et al. Dynamic changes on chest CT of COVID-19 patients with solitary pulmonary lesion in initial CT. Jpn J Radiol. 2021;39:32–39. doi: 10.1007/s11604-020-01037-w. [DOI] [PMC free article] [PubMed] [Google Scholar]
- 21.Hani C., Trieu N.H., Saab I., Dangeard S., Bennani S., Chassagnon G., et al. COVID-19 pneumonia: a review of typical CT findings and differential diagnosis. Diagn Interv Imaging. 2020;101:263–268. doi: 10.1016/j.diii.2020.03.014. [DOI] [PMC free article] [PubMed] [Google Scholar]
- 22.Jalaber C., Lapotre T., Morcet-Delattre T., Ribet F., Jouneau S., Lederlin M., et al. Chest CT in COVID-19 pneumonia: a review of current knowledge. Diagn Interv Imaging. 2020;101:431–437. doi: 10.1016/j.diii.2020.06.001. [DOI] [PMC free article] [PubMed] [Google Scholar]
- 23.Fukuda A., Yanagawa N., Sekiya N., Ohyama K., Yomota M., Inui T., et al. An analysis of the radiological factors associated with respiratory failure in COVID-19 pneumonia and the CT features among different age categories. Jpn J Radiol. 2021 doi: 10.1007/s.11604.021.01118.4. [DOI] [PMC free article] [PubMed] [Google Scholar]
- 24.Himoto Y., Sakata A., Kirita M., Hiroi T., Kobayashi K.I., Kubo K., et al. Diagnostic performance of chest CT to differentiate COVID-19 pneumonia in non-high-epidemic area in Japan. Jpn J Radiol. 2020;38:400–406. doi: 10.1007/s11604-020-00958-w. [DOI] [PMC free article] [PubMed] [Google Scholar]
- 25.Simpson S., Kay F.U., Abbara S., Bhalla S., Chung J.H., Chung M., et al. Radiological Society of North America Expert Consensus Statement on reporting chest CT findings related to COVID-19: endorsed by the Society of Thoracic Radiology, the American College of Radiology, and RSNA - secondary publication. J Thorac Imaging. 2020;35:219–227. doi: 10.1097/RTI.0000000000000524. [DOI] [PMC free article] [PubMed] [Google Scholar]
- 26.Kwee R.M., Adams H.J.A., Kwee T.C. Diagnostic performance of CO-RADS and the RSNA classification system in evaluating COVID-19 at chest CT: a meta-analysis. Radiol Cardiothorac Imaging. 2021;3 doi: 10.1148/ryct.2021200510. e200510. [DOI] [PMC free article] [PubMed] [Google Scholar]
- 27.Gümüs T., Kabaoglu Z.U., Coskun B., Kartal F., Artukoglu F., Atasoy K.C. Preoperative computerized tomography screening for COVID-19 pneumonia in asymptomatic patients: experiences from two centers. Jpn J Radiol. 2021;39:240–245. doi: 10.1007/s11604-020-01061-w. [DOI] [PMC free article] [PubMed] [Google Scholar]
- 28.Iwasawa T., Sato M., Yamaya T., Sato Y., Uchida Y., Kitamura H., et al. Ultra-high-resolution computed tomography can demonstrate alveolar collapse in novel coronavirus (COVID-19) pneumonia. Jpn J Radiol. 2020;38:394–398. doi: 10.1007/s11604-020-00956-y. [DOI] [PMC free article] [PubMed] [Google Scholar]
- 29.Frerking I., Günther A., Seeger W., Pison U. Pulmonary surfactant: functions, abnormalities and therapeutic options. Intensive Care Med. 2001;27:1699–1717. doi: 10.1007/s00134-001-1121-5. [DOI] [PubMed] [Google Scholar]
- 30.Takano H. Pulmonary surfactant itself must be a strong defender against SARS-CoV-2. Med Hypotheses. 2020;144:110020. doi: 10.1016/j.mehy.2020.110020. [DOI] [PMC free article] [PubMed] [Google Scholar]
- 31.Webb W.R. Thin-section CT of the secondary pulmonary lobule: anatomy and the image--the 2004 Fleischner lecture. Radiology. 2006;239:322–338. doi: 10.1148/radiol.2392041968. [DOI] [PubMed] [Google Scholar]
- 32.Han X., Fan Y., Alwalid O., Li N., Jia X., Yuan M., et al. Six-month follow-up chest CT findings after severe COVID-19 pneumonia. Radiology. 2021;299:E177–E186. doi: 10.1148/radiol.2021203153. [DOI] [PMC free article] [PubMed] [Google Scholar]
- 33.Lang M., Som A., Carey D., Reid N., Mendoza D.P., Flores E.J., et al. Pulmonary vascular manifestations of COVID-19 pneumonia. Radiol Cardiothorac Imaging. 2020;2 doi: 10.1148/ryct.2020200277. e200277. [DOI] [PMC free article] [PubMed] [Google Scholar]
- 34.Aoki R., Iwasawa T., Hagiwara E., Komatsu S., Utsunomiya D., Ogura T. Pulmonary vascular enlargement and lesion extent on computed tomography are correlated with COVID-19 disease severity. Jpn J Radiol. 2021;39:451–458. doi: 10.1007/s11604-020-01085-2. [DOI] [PMC free article] [PubMed] [Google Scholar]
- 35.Herrmann J., Mori V., Bates J.H.T., Suki B. Modeling lung perfusion abnormalities to explain early COVID-19 hypoxemia. Nat Commun. 2020;11:4883. doi: 10.1038/s41467-020-18672-6. [DOI] [PMC free article] [PubMed] [Google Scholar]
- 36.Hendren N.S., Drazner M.H., Bozkurt B., Cooper L.T., Jr. Description and proposed management of the acute COVID-19 cardiovascular syndrome. Circulation. 2020;141:1903–1914. doi: 10.1161/CIRCULATIONAHA.120.047349. [DOI] [PMC free article] [PubMed] [Google Scholar]
- 37.Giustino G., Pinney S.P., Lala A., Reddy V.Y., Johnston-Cox H.A., Mechanick J.I., et al. Coronavirus and cardiovascular disease, myocardial injury, and arrhythmia: JACC Focus Seminar. J Am Coll Cardiol. 2020;76:2011–2023. doi: 10.1016/j.jacc.2020.08.059. [DOI] [PMC free article] [PubMed] [Google Scholar]
- 38.Cosyns B., Lochy S., Luchian M.L., Gimelli A., Pontone G., Allard S.D., et al. The role of cardiovascular imaging for myocardial injury in hospitalized COVID-19 patients. Eur Heart J Cardiovasc Imaging. 2020;21:709–714. doi: 10.1093/ehjci/jeaa136. [DOI] [PMC free article] [PubMed] [Google Scholar]
- 39.Sakr Y., Giovini M., Leone M., Pizzilli G., Kortgen A., Bauer M., et al. Pulmonary embolism in patients with coronavirus disease-2019 (COVID-19) pneumonia: a narrative review. Ann Intensive Care. 2020;10:124. doi: 10.1186/s13613-020-00741-0. [DOI] [PMC free article] [PubMed] [Google Scholar]
- 40.Grillet F., Behr J., Calame P., Aubry S., Delabrousse E. Acute pulmonary embolism associated with COVID-19 pneumonia detected with pulmonary CT angiography. Radiology. 2020;296:E186–E188. doi: 10.1148/radiol.2020201544. [DOI] [PMC free article] [PubMed] [Google Scholar]
- 41.Lodigiani C., Iapichino G., Carenzo L., Cecconi M., Ferrazzi P., Sebastian T., et al. Venous and arterial thromboembolic complications in COVID-19 patients admitted to an academic hospital in Milan, Italy. Thromb Res. 2020;191:9–14. doi: 10.1016/j.thromres.2020.04.024. [DOI] [PMC free article] [PubMed] [Google Scholar]
- 42.Stoneham S.M., Milne K.M., Nuttall E., Frew G.H., Sturrock B.R., Sivaloganathan H., et al. Thrombotic risk in COVID-19: a case series and case-control study. Clin Med. 2020;20:e76–e81. doi: 10.7861/clinmed.2020-0228. [DOI] [PMC free article] [PubMed] [Google Scholar]
- 43.Helms J., Tacquard C., Severac F., Leonard-Lorant I., Ohana M., Delabranche X., et al. High risk of thrombosis in patients with severe SARS-CoV-2 infection: a multicenter prospective cohort study. Intensive Care Med. 2020;46:1089–1098. doi: 10.1007/s00134-020-06062-x. [DOI] [PMC free article] [PubMed] [Google Scholar]
- 44.Wichmann D., Sperhake J.P., Lutgehetmann M., Steurer S., Edler C., Heinemann A., et al. Autopsy findings and venous thromboembolism in patients with COVID-19: a prospective cohort study. Ann Intern Med. 2020;173:268–277. doi: 10.7326/M20-2003. [DOI] [PMC free article] [PubMed] [Google Scholar]
- 45.Suh Y.J., Hong H., Ohana M., Bompard F., Revel M.P., Valle C., et al. Pulmonary embolism and deep vein thrombosis in COVID-19: a systematic review and meta-analysis. Radiology. 2021;298:E70–E80. doi: 10.1148/radiol.2020203557. [DOI] [PMC free article] [PubMed] [Google Scholar]
- 46.Soyer P. Lessons learned from chest CT in COVID-19. Diagn Interv Imaging. 2020;101:261–262. doi: 10.1016/j.diii.2020.04.006. [DOI] [PMC free article] [PubMed] [Google Scholar]
- 47.Cellina M., Oliva G. Acute pulmonary embolism in a patient with COVID-19 pneumonia. Diagn Interv Imaging. 2020;101:325–326. doi: 10.1016/j.diii.2020.04.001. [DOI] [PMC free article] [PubMed] [Google Scholar]
- 48.Sakr Y., Giovini M., Leone M., Pizzilli G., Kortgen A., Bauer M., et al. Pulmonary embolism in patients with coronavirus disease-2019 (COVID-19) pneumonia: a narrative review. Ann Intensive Care. 2020;10:124. doi: 10.1186/s13613-020-00741-0. [DOI] [PMC free article] [PubMed] [Google Scholar]
- 49.Le Berre A., Marteau V., Emmerich J., Zins M. Concomitant acute aortic thrombosis and pulmonary embolism complicating COVID-19 pneumonia. Diagn Interv Imaging. 2020;101:321–322. doi: 10.1016/j.diii.2020.04.003. [DOI] [PMC free article] [PubMed] [Google Scholar]
- 50.Lala A., Johnson K.W., Russak A.J., Paranjpe I., Zhao S., Solani S., et al. Prevalence and impact of myocardial injury in patients hospitalized with COVID-19 infection. medRxiv. 2020 doi: 10.1016/j.jacc.2020.06.007. [DOI] [PMC free article] [PubMed] [Google Scholar]
- 51.Shi S., Qin M., Cai Y., Liu T., Shen B., Yang F., et al. Characteristics and clinical significance of myocardial injury in patients with severe coronavirus disease 2019. Eur Heart J. 2020;41:2070–2079. doi: 10.1093/eurheartj/ehaa408. [DOI] [PMC free article] [PubMed] [Google Scholar]
- 52.Szekely Y., Lichter Y., Taieb P., Banai A., Hochstadt A., Merdler I., et al. Spectrum of cardiac manifestations in COVID-19: a systematic echocardiographic study. Circulation. 2020;142:342–353. doi: 10.1161/CIRCULATIONAHA.120.047971. [DOI] [PMC free article] [PubMed] [Google Scholar]
- 53.Mahmoud-Elsayed H.M., Moody W.E., Bradlow W.M., Khan-Kheil A.M., Senior J., Hudsmith L.E., et al. Echocardiographic findings in patients with COVID-19 pneumonia. Can J Cardiol. 2020;36:1203–1207. doi: 10.1016/j.cjca.2020.05.030. [DOI] [PMC free article] [PubMed] [Google Scholar]
- 54.Argulian E., Sud K., Vogel B., Bohra C., Garg V.P., Talebi S., et al. Right ventricular dilation in hospitalized patients with COVID-19 infection. JACC Cardiovasc Imaging. 2020;13:2459–2461. doi: 10.1016/j.jcmg.2020.05.010. [DOI] [PMC free article] [PubMed] [Google Scholar]
- 55.Giustino G., Croft L.B., Stefanini G.G., Bragato R., Silbiger J.J., Vicenzi M., et al. Characterization of myocardial injury in patients with COVID-19. J Am Coll Cardiol. 2020;76:2043–2055. doi: 10.1016/j.jacc.2020.08.069. [DOI] [PMC free article] [PubMed] [Google Scholar]
- 56.Sud K., Vogel B., Bohra C., Garg V., Talebi S., Lerakis S., et al. Echocardiographic findings in patients with COVID-19 with significant myocardial injury. J Am Soc Echocardiogr. 2020;33:1054–1055. doi: 10.1016/j.echo.2020.05.030. [DOI] [PMC free article] [PubMed] [Google Scholar]
- 57.Ferreira V.M., Schulz-Menger J., Holmvang G., Kramer C.M., Carbone I., Sechtem U., et al. Cardiovascular magnetic resonance in nonischemic myocardial inflammation: expert recommendations. J Am Coll Cardiol. 2018;72:3158–3176. doi: 10.1016/j.jacc.2018.09.072. [DOI] [PubMed] [Google Scholar]
- 58.Ito R., Iwano S., Naganawa S. A review on the use of artificial intelligence for medical imaging of the lungs of patients with coronavirus disease 2019. Diagn Interv Radiol. 2020;26:443–448. doi: 10.5152/dir.2019.20294. [DOI] [PMC free article] [PubMed] [Google Scholar]
- 59.Li L., Qin L., Xu Z., Yin Y., Wang X., Kong B., et al. Using artificial intelligence to detect COVID-19 and community-acquired pneumonia based on pulmonary CT: evaluation of the diagnostic accuracy. Radiology. 2020;296:E65–E71. doi: 10.1148/radiol.2020200905. [DOI] [PMC free article] [PubMed] [Google Scholar]
- 60.Ko H., Chung H., Kang W.S., Kim K.W., Shin Y., Kang S.J., et al. COVID-19 pneumonia diagnosis using a simple 2D deep learning framework with a single chest CT image: model development and validation. J Med Internet Res. 2020;22 doi: 10.2196/19569. e19569. [DOI] [PMC free article] [PubMed] [Google Scholar]
- 61.Ni Q., Sun Z.Y., Qi L., Chen W., Yang Y., Wang L., et al. A deep learning approach to characterize 2019 coronavirus disease (COVID-19) pneumonia in chest CT images. Eur Radiol. 2020;30:6517–6527. doi: 10.1007/s00330-020-07044-9. [DOI] [PMC free article] [PubMed] [Google Scholar]