

Abstract
BACKGROUND AND PURPOSE: Focal cortical dysplasia (FCD) covers a spectrum of conditions in which the neuropathologic and electroclinic presentations and the surgical outcomes vary. The aim of this study was to identify the MR features of histologic subtypes of FCD that would be useful for differential diagnosis.
METHODS: We reviewed the MR data of 49 patients treated surgically for intractable partial epilepsy, who received a histologic diagnosis of FCD not associated with other brain abnormalities except hippocampal sclerosis and who were classified by histologic criteria as having architectural dysplasia (28 patients), cytoarchitectural dysplasia (six patients), or Taylor’s FCD (15 patients).
RESULTS: From the MR features, it was generally possible to distinguish Taylor’s FCD from architectural or cytoarchitectural dysplasias (non-Taylor’s FCD). Findings suggesting Taylor’s FCD were focal cortical thickening, blurring of the gray-white matter junction, and hyperintensity (on T2-weighted images) of subcortical white matter often tapering toward the ventricle. Focal brain hypoplasia with shrinkage and moderate signal intensity alterations in the white matter core were present in most patients with architectural dysplasia. The lesion was generally extratemporal in Taylor’s FCD and temporal in architectural dysplasia. Ipsilateral hippocampal sclerosis was often present in architectural dysplasia (dual abnormality).
CONCLUSIONS: In patients with FCD, Taylor’s FCD and non-Taylor’s FCD can usually be distinguished with MR imaging, although some overlap exists. A provisional MR diagnosis is important for presurgical investigations and surgical planning and may have prognostic implications.
In 1971, Taylor and Falconer (1) identified focal cortical dysplasias (FCDs) in specimens resected for the treatment of drug-refractory partial epilepsy. Then, FCDs were described as focal developmental anomalies of cortical structure characterized histologically by cortical dyslamination and the presence of abnormal giant neurons throughout the resected cortex and adjacent white matter, accompanied in many cases by grotesquely shaped balloon cells of uncertain lineage.
Subsequently, the term cortical dysplasia has been used extensively and misleadingly in the literature to refer to various malformations of cortical development such as agyria, pachygyria, polymicrogyria, heterotopia, and hemimegalencephaly. Numerous neuropathologic studies (2–12) have confirmed that FCD is distinct from other malformations of cortical development. However, FCD includes a wide spectrum of gray and white matter anomalies that range from mild cortical disruption without cytologic alterations (referred to in the literature as “mild cortical dysplasia” or “microdysgenesis”) to complete derangement of neocortical lamination accompanied by giant dysmorphic neurons, with or without balloon cells (Taylor’s FCD).
This heterogeneous assortment of microscopic abnormalities is attributable mainly to variations in the time at which the defect manifests during cortical development (7, 13). Because the various classifications of these manifestations have proved unsatisfactory, we recently developed a simple classification of FCDs based on easily recognized neuropathologic features (14). We in fact identified three histologic subtypes: architectural dysplasia, cytoarchitectural dysplasia, and Taylor’s FCD. Table 1 lists the defining characteristics of each subtype.
TABLE 1:
Histopathologic Classification of FCD
| Classification | Characteristics |
|---|---|
| Architectural dysplasia | Heterotopic neurons in white matter Derangement of cortical lamination |
| Cytoarchitectural dysplasia | Heterotopic neurons in white matter Derangement of cortical lamination Giant neurons |
| Taylor’s FCD | |
| Without balloon cells | Heterotopic neurons in white matter Derangement of cortical lamination Giant neurons Dysmorphic neurons |
| With balloon cells | Heterotopic neurons in white matter Derangement of cortical lamination Giant neurons Dysmorphic neurons Balloon cells |
With the progressive refinement of MR techniques, FCDs are being seen in vivo with increasing frequency in patients with epilepsy (15–18), and certain epilepsies previously considered cryptogenetic are now recognized as associated with cortical dysplasias. There is growing interest in the MR characterization of these lesions to assist electroclinical localization and surgical planning.
The aim of the present study was to analyze the MR characteristics of a series of patients operated on for drug-refractory partial epilepsy and characterized histologically as having one of the three histologic subtypes of FCD.
Methods
Patients
Between May 1996 and November 2000, 224 patients with medically refractory partial epilepsy underwent surgery at the Claudio Munari Surgery Center for Epilepsy in Milan, Italy, after thorough electroclinical and neuroimaging investigations. Fifty-four of these patients (24.1%) had a histologic diagnosis of FCD not associated with other pathologic conditions except hippocampal sclerosis; data for 49 of these patients (with adequate MR documentation) were selected for the present retrospective study. We excluded all cases with other potentially epileptogenic lesions (sometimes in addition to FCD) such as tumors, vascular lesions, sequelae of trauma, or malformations of cortical development other than FCD, revealed by MR or histopathologic examination. However, cases of FCD plus hippocampal sclerosis were included since this association (dual abormality) is reported frequently (19).
Histopathologic Classification
The 49 patients were classified retrospectively according to our recently proposed histopathologic scheme (14) as follows: architectural dysplasia, 28 patients; cytoarchitectural dysplasia, six patients; and Taylor’s FCD, 15 patients (13 with and two without balloon cells) (Fig 1). The classification was performed by two neuropathologists (C.G., R.S) working independently and unaware of the MR findings; disagreements were discussed and a consensus reached. In patients undergoing temporal lobe resection, lateral and mesial specimens were sent for histologic analysis and assessed for hippocampal sclerosis as defined by neuronal loss and reactive gliosis of the hippocampus. Of the 49 specimens reviewed, 29 were from the temporal lobe, and dual abnormality was found in 16 (55%) of the 29 specimens.
Fig 1.
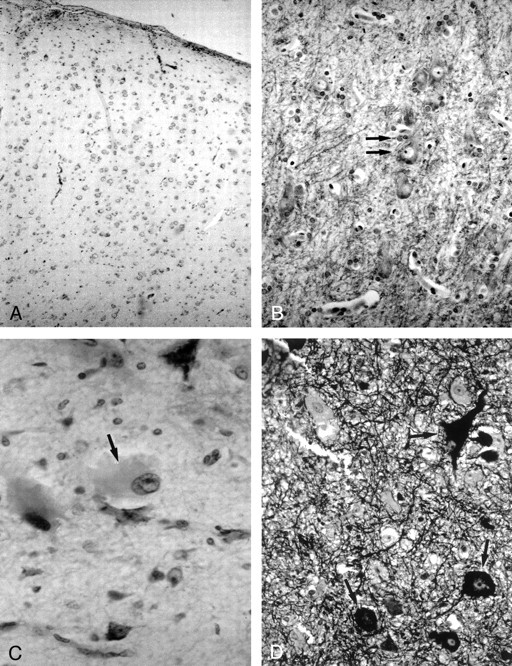
Photomicrographs show the histologic characteristics of the FCD subtypes.
A, Architectural dysplasia characterized by moderate derangement of cortical lamination, with neurons of the same shape and size scattered throughout the cortex (Kluver-Barrera stain; original magnification, ×250).
B, Cytoarchitectural dysplasia. Note the cluster of cytomegalic neurons with satellitosis (arrows) (Kluver-Barrera stain; original magnification, ×250).
C, Taylor’s FCD with balloon cells. Note large balloon cell characterized by homogeneous eosinophilic cytoplasm and peripheral nucleus with prominent nucleolus (arrow) (hematoxylin-eosin stain; original magnification, ×250).
D, Taylor’s FCD with balloon cells. Note large dysmorphic neurons containing abundant cytoplasmic neurofilaments (arrows) (Bielchowsky stain; original magnification, ×250).
MR Imaging
MR examinations were performed with a 1.5-T ACS-NT unit (Philips Medical Systems, Best, the Netherlands). The following sequences were performed in all cases: transverse double-echo spin-echo (SE) sequence of the entire brain (2000–2500/20–90/1 [TR/TE/excitations], 128 × 256 matrix, 230-mm field of view, 4–5-mm section thickness, 10% intersection gap); coronal turbo SE T2-weighted sequence (2300/100/4, 256 × 256 matrix, 230-mm field of view, 3-mm section thickness, 10% intersection gap, turbo factor of 15); coronal turbo SE fluid-attenuated inversion-recovery (FLAIR) T2-weighted sequence (6000/100/2000/3 [TR/TE/TI/excitations], 238 × 256 matrix, 230-mm field of view, 3-mm section thickness, 10% intersection gap, turbo factor of 15); and coronal turbo SE inversion-recovery (IR) T1-weighted sequence (3000/20/400/2, 256 × 256 matrix, 230-mm field of view, 3-mm section thickness, 20% intersection gap, turbo factor of 4). The coronal sequences were localized over the area of seizure generation (epileptogenic zone) as indicated by the electroclinical data. In most patients, 3D volume fast field echo T1-weighted images were also acquired in the sagittal plane (30/4.6/1 [TR/TE/excitations], 30° flip angle, 512 × 512 matrix, 230-mm field of view, 1-mm-thick contiguous sections); the source images were reconstructed in transverse and coronal sections. Additional FLAIR or turbo SE T2-weighted images in the sagittal plane were obtained in some patients as required. Intravenous contrast material was given to a few patients but did not generally provide additional information useful for diagnosis.
In patients with the epileptogenic zone in the temporal lobe, transverse images were acquired parallel to the major hippocampal axis and coronal images perpendicular to the hippocampal axis. In patients with extratemporal lobe epilepsies, images were acquired parallel with and perpendicular to the anteroposterior commissure line.
The MR data were reviewed by two neuroradiologists (N.C. and A.C.) blind to the histopathologic classification. The following characteristics were specifically looked for on each patient’s MR images: focal thickening of the cortex; blurring of the gray matter-white matter junction; increased signal intensity of gray matter and subcortical white matter on conventional and heavily T2-weighted (FLAIR) images; decreased white matter signal intensity on conventional and heavily T1-weighted (IR) images; tapering of white matter signal intensity alteration toward the ventricle on T1- and T2-weighted images; focal brain hypoplasia; and shrinkage of the white matter core. Subcortical white matter hyperintensity was judged subjectively as severe, moderate, or absent. Focal hypoplasia was considered present when lobar or sublobar volume loss with focal enlargement of the overlying subarachnoid space was observed, usually in association with the white matter core shrinkage, in comparison to the corresponding area in the opposite hemisphere. These particular variables were considered based on radiologic experience and previous studies dealing with various categories of FCD (16–18).
On the basis of these characteristics, we assigned each of the 49 patients to one of three categories: normal (unremarkable), non-Taylor’s FCD, or Taylor’s FCD. We diagnosed Taylor’s FCD in the presence of 1) focal cortical thickening, 2) blurring of the gray-white matter junction, and 3) marked hyperintensity of the subcortical white matter on T2-weighted images, which often appeared hypointense on T1-weighted images. In addition, the white matter signal intensity alterations often tapered toward the ventricle. By contrast, when this association was absent but moderate white matter signal intensity alterations, focal brain hypoplasia, and white matter core atrophy were present, we diagnosed non-Taylor’s FCD (ie, architectural or cytoarchitectural dysplasia).
The MR images were also examined for the presence of ipsilateral hippocampal sclerosis, as indicated by atrophy, loss of definition of the internal anatomy, hippocampal hyperintensity on conventional and heavily T2-weighted (FLAIR) images, and decreased signal intensity on conventional and heavily T1-weighted (IR) images. From these data, we determined the frequency of MR-detected dual abnormality.
We next compared the MR and histopathologic diagnoses and determined the frequency of the individual radiologic variables in each of the three neuropathologic subgroups—architectural dysplasia, cytoarchitectural dysplasia, and Taylor’s FCD. Associations between the histopathologic diagnoses and neuroradiologic variables were tested by using χ2 univariate analysis. A P value of less than or equal to .05 was considered to indicate a statistically significant association.
Results
Patient data, including surgical outcome at 1 year or more according to Engel (20), are given in Table 2.
TABLE 2:
Patient Characteristics and Surgical Outcome
| Sex (F/M) | Age at Surgery (y)* | Age at Clinical Onset (y)* | Seizure Duration (y)* | No. of Seizures per month* | Surgical Outcome Engel Class Ia† | |
|---|---|---|---|---|---|---|
| Whole series (n = 49) | 27/22 | 2–42 (24 ± 11) | 0–26 (6 ± 7) | 1–42 (17 ± 10) | 1–600 (69 ± 117) | 25 (51) |
| Histologic TFCD (n = 15) | 7/8 | 2–35 (19 ± 11) | 0–22 (6 ± 7) | 2–27 (13 ± 8) | 1–400 (97 ± 103) | 11 (73) |
| Histologic CD (n = 6) | 3/3 | 4–42 (20 ± 16) | 0–26 (6 ± 10) | 1–42 (14 ± 16) | 1–300 (152 ± 139) | 2 (33) |
| Histologic AD (n = 28) | 17/11 | 2–41 (27 ± 9) | 0–24 (7 ± 6) | 2–34 (20 ± 8) | 1–600 (39 ± 112) | 12 (43) |
Data are ranges. Numbers in parentheses are the mean ± SD.
Data are number (%) of patients seizure free at ≥1 year.
Note.—TFCD indicates Taylor’s FCD; CD = cytoarchitectural dysplasia; AD = architectural dysplasia.
The MR findings were abnormal in 34 patients (69%) and unrevealing in 15 (31%) (Table 3). FCD was identified in 17 cases, dual abnormality (FCD plus hippocampal sclerosis) in 14 cases, and only hippocampal sclerosis in three cases. Thus, in 31 (63%) of the 49 patients, MR imaging enabled detection of FCD, and this was diagnosed as Taylor’s FCD in 13 cases and non-Taylor’s FCD in 18 cases. However, one case of non-Taylor’s FCD could not be verified at histologic examination because the MR abnormalities were in the temporal lobe, whereas the ipsilateral frontal region had been resected, based on electroclinical findings. Therefore, MR enabled detection of histologically verified FCD in 30 patients (61%) but was unrevealing in 19 patients (39%), including three with only hippocampal sclerosis (Table 4). The individual MR variables in these 30 patients in relation to the neuropathologic findings are shown in Table 5.
TABLE 3:
MR Findings in 49 Patients with Histologically Diagnosed FCD Who Were Operated On for Drug-Resistant Partial Epilepsy
| MR Findings | No. (%) of Patients | MR Diagnosis |
|
|---|---|---|---|
| TFCD | Non-TFCD | ||
| Unrevealing | 15 (31) | ||
| HS | 3 (6) | – | – |
| FCD | 17 (35) | 12 | 5 |
| Dual abnormality (FCD + HS) | 14 (28) | 1 | 13 |
Note.—TFCD indicates Taylor’s FCD; HS = hippocampal sclerosis.
TABLE 4:
Comparison of Histopathologic and Detailed MR Diagnosis (TFCD vs non-TFCD)
| Histopathologic Diagnosis (n = 49) | MR Negative for FCD (n = 19 [39]) | MR Positive for FCD (n = 30 [61])* | Detailed MR Diagnosis |
|
|---|---|---|---|---|
| TFCD 13 | non-TFCD 17* | |||
| TFCD (n = 15) | 5 (33) | 10 (67) | 9 | 1 |
| CD (n = 6) | 3 (50) | 3 (50) | 2 | 1 |
| AD (n = 28) | 11 (39) | 17 (61) | 2 | 15 |
Note.—TFCD indicates Taylor’s FCD; CD = cytoarchitectural dysplasia; AD = architectural dysplasia.
Data are number of patients. Numbers in parentheses are percentages.
One MR-diagnosed non-TFCD case is not included because it could not be verified histologically (MR abnormalities in temporal lobe, but ipsilateral frontal region resected).
TABLE 5:
MR Imaging Variables in Relation to Histopathologic Findings
| MR Diagnosis | Cortical Thickening | GM-WM Blurring | WM Hyperintensity on T2WI |
WM Hypo-intensity on T1WI IR | Tapering to Ventricle | GM Hyper-intensity on T2WI | Focal Hypoplasia | WM Core Atrophy | Histopathologic Diagnosis | |
|---|---|---|---|---|---|---|---|---|---|---|
| Severe | Moderate | |||||||||
| TFCD (n = 13) | 10 | 13 | 13 | – | 10 | 3 | 6 | 3 | – | |
| 7 | 8 | 8 | – | 6 | 3 | 2 | 2 | – | TFCD with BC (n = 8) | |
| 1 | 1 | 1 | – | 1 | – | 1 | – | – | TFCD without BC (n = 1) | |
| 1 | 2 | 2 | – | 2 | – | 2 | – | – | CD (n = 2) | |
| 1 | 2 | 2 | – | 1 | – | 1 | 1 | – | AD (n = 2) | |
| Non-TFCD (n = 17) | 2 | 5 | – | 14 | 6 | – | 2 | 17 | 16 | |
| – | – | – | 1 | – | – | – | 1 | 1 | TFCD with BC (n = 1) | |
| – | – | – | 1 | – | – | – | 1 | – | CD (n = 1) | |
| 2 | 5 | – | 12 | 6 | – | 2 | 15 | 15 | AD (n = 15) | |
Note.—GM indicates gray matter; WM = white matter; WI = weighted images; TFCD = Taylor’s FCD; BC = balloon cells.
Data are number of patients.
Taylor’s FCD
Among the 15 histologically diagnosed cases of Taylor’s FCD, the MR findings were positive in 10 (67%) and unrevealing in five (33%) (Table 4). MR imaging enabled correct diagnosis of Taylor’s FCD in nine cases (60%), in which the specific findings were focal cortical thickening (n = 8 [χ21df = 14.78, P < .001]), blurring of the gray-white matter junction (n = 9 [χ21df = 5 .82, P < .025]), increased signal intensity in subcortical white matter on conventional and heavily T2-weighted (FLAIR) images (n = 9 [χ21df = 11.30, P < .01]), decreased signal intensity of the white matter on conventional and heavily (IR) T1-weighted images (n = 7 [χ21df = 0.15, not significant), and radial bands of white matter signal intensity changes reaching the ventricle (n = 3) (Table 5) (Figs 2 and 3). Increased T2 signal in the gray matter was rarely seen (n = 3 [χ21df = 0.2, not significant]). Non-Taylor’s FCD was diagnosed with MR imaging in the 10th positive MR case: the findings were a small anterior temporal lobe with moderate alterations in white matter signal intensity. The MR-identified lesions were frontal (n = 3), central (n = 1), temporal (n = 2), parietal (n = 1), temporo-occipital (n = 1), temporo-occipitoparietal (n = 1), and temporo-occipitofrontoparietal (n = 1). In all cases, these lesions were contained within the epileptogenic zone and the area of surgical resection. In the five cases of histologically diagnosed Taylor’s FCD with unrevealing MR findings, the epileptogenic zone was defined electroclinically, and tissue was removed from the frontal lobe (n = 4) or temporo-occipitoparietal region (n = 1).
Fig 2.

MR images of Taylor’s FCD with balloon cells.
A, Coronal turbo SE IR T1-weighted image (3000/20/400/2) demonstrates thickening of the right frontal cortex with loss of demarcation between gray and white matter and decreased white matter signal intensity (arrow) tapering toward the ventricle.
B, Coronal turbo SE T2-weighted image (2300/100/4) and C, coronal turbo SE FLAIR T2-weighted image (6000/100/2000/3), obtained at the same level as A, show increased signal intensity (arrow) of the subcortical white matter extending to the ventricle as a radial band. No mass effect is present.
Fig 3.

MR images of Taylor’s FCD without balloon cells.
A, Transverse SE T2-weighted image (2300/90/1) shows extensive hyperintense lesion in the left temporo-occipitobasal region, with no mass effect on adjacent structures.
B, Coronal turbo SE IR T1-weighted image (3000/20/400/2) better demonstrates thickening of the cortex (arrows) with blurring of the gray-white matter junction and subcortical white matter hypointensity.
C, Coronal turbo SE FLAIR T2-weighted image (6000/100/2000/3) reveals that the hyperintensity of the lesion mainly involves the subcortical white matter (arrows). The ventricular trigone is enlarged on the left.
Cytoarchitectural Dysplasia
Of the six histologically diagnosed cases of cytoarchitectural dysplasia, three (50%) had positive MR findings (Table 4); among these, the MR diagnosis was Taylor’s FCD in two cases, with focal cortical thickening (n = 1), reduced demarcation of gray-white matter junction (n = 2), and hyperintensity in the gray and white matter on T2-weighted images (n = 2) becoming hypointense on T1-weighted images (n = 2) (Table 5) (Fig 4). The third case with a positive MR finding was diagnosed as a non-Taylor’s FCD: the frontal and the temporal poles were of reduced volume, and there were modest signal intensity alterations in the white matter. The MR alterations were temporal (n = 2) or frontotemporal (n = 1) and always coincided with the epileptogenic zone and area of surgical resection. For the three cases with unremarkable MR findings, frontal (n = 1), temporoparietal (n = 1), and frontocentroparietal (n = 1) resections removed the electroclinically defined epileptogenic zone. There were insufficient patients in this group for statistical analysis.
Fig 4.

MR images of cytoarchitectural dysplasia.
A, Coronal turbo SE IR T1-weighted image (3000/20/400/2), B, coronal turbo SE T2-weighted image (2300/100/4), and C, sagittal turbo SE T2-weighted image of a 3D volume acquisition (2100/130/1). Note reduced demarcation of the gray-white matter boundary in the right temporal lobe, with marked signal intensity alterations of subcortical white matter, which is hypointense on the T1-weighted image in A and hyperintense on the T2-weighted images in B and C. These alterations induced us to diagnose Taylor’s FCD. Note, however, that the thickening of the cortex (arrows in A and B), is only mild. This is a case of histologic cytoarchitectural dysplasia resembling Taylor’s FCD.
Architectural Dysplasia
MR findings were positive in 21 (75%) of the 28 patients with histologically diagnosed architectural dysplasia. The specific findings were cortical dysplasia plus ipsilateral hippocampal sclerosis (n = 14), dysplasia only (n = 4), and hippocampal sclerosis only (n = 3). In one of the 18 cases with a dysplastic lesion on MR images, the lesion was located outside the resected area, and the MR finding was therefore considered negative relative to the histologic findings. Thus, a total of 17 FCDs (61%) were identified with MR imaging, and 11 cases (39%) cases were missed (Table 4).
In 15 (54% of the 28 cases) of the 17 cases of FCD detected with MR imaging, a detailed diagnosis of non-Taylor’s FCD was made with MR (Table 4); 14 had a temporal location and one an occipital location. Non-Taylor’s FCD was diagnosed from the following: lobar or sublobar hypoplasia (n = 15 [χ21df = 15.46, P < .01]), atrophy of white matter core (n = 15 [χ21df = 18.07, P < .01]), moderate subcortical white matter hyperintensity on T2-weighted images (n = 12 [χ21df = 3 .8, not significant]), decreased subcortical white matter signal intensity on T1-weighted images (n = 6 [χ21df = 3 .0, not significant]), blurred gray-white matter junction (n = 5 [χ21df = 5 .75, P < .05]), cortical thickening (n = 2 [χ21df = 8 .35, P < .01]), and hyperintensity of gray matter on T2-weighted images (n = 2 [χ21df = 1 .80, not significant]) (Table 5) (Fig 5).
Fig 5.

MR images of architectural dysplasia and ipsilateral hippocampal sclerosis (dual abnormality).
A, Coronal turbo SE T2-weighted image (2300/100/4) reveals hypoplasia of right temporal pole with white matter hyperintensity.
B, Transverse SE T2-weighted image (2300/90/1) confirms reduced volume of right temporal pole compared with the contralateral side, with enlargement of the overlying subarachnoid space.
C, Coronal turbo SE T2-weighted image (2300/100/4) shows right hippocampal head (arrow), characterized by atrophy and signal hyperintensity, suggesting hippocampal sclerosis.
In the remaining two MR-positive cases (one temporal and one frontal location), Taylor’s FCD was diagnosed from the presence of extensive blurring of the gray-white matter junction (n = 2), moderate cortical thickening (n = 1), and T2 hyperintensity in subcortical white matter (n = 2) becoming hypointense on T1-weighted images in one case (Table 5).
Ipsilateral hippocampal sclerosis in association with dysplasia was diagnosed with MR imaging in 14 cases, but in only 12 of these was hippocampal sclerosis observed at histologic examination: partial fragmentation of the hippocampus during surgery precluded a histologic diagnosis of hippocampal sclerosis in the other two cases.
In the patients with histologically diagnosed architectural dysplasia with MR-identified lesion outside the resected area, MR imaging revealed temporal alterations (abnormal temporal pole, with normal size but moderate hyperintensity in subcortical white matter on T2-weighted images, and ill-defined gray-white matter junction); however, a frontal lobe resection was performed as electroclinical investigation located the epileptogenic zone there. Except for this case, all lesions visualized with MR imaging coincided with the epileptogenic zone and the area of surgical resection. Surgical specimens from patients with cortical dysplasia missed with MR imaging were removed from the frontal lobe (n = 4), temporal lobe (n = 4), frontotemporal region (n = 2), or occipital lobe (n = 1), including three with only hippocampal sclerosis on MR images.
Discussion
Following the original precise description (1), the term FCD has often been used to indicate any cortical developmental disorder. Furthermore, during the last decade, despite the more frequent identification of FCD in patients with epilepsy who had been operated on (3–12,21–23), and the general recognition that it is a distinct pathologic entity, disparate classifications and terminology have appeared, and the term FCD was expanded to include less severe forms of cortical and subcortical neuronal abnormalities observed at histologic examination, accompanied by proliferation of terms such as “mild cortical dysplasia” and “microdysgenesis” (3–12).
With progressive refinements in MR imaging technique, FCDs have been more frequently visualized in vivo in patients with intractable partial epilepsy and their neuroimaging features clarified. Unfortunately, separate grading systems for FCDs based, on the one hand, on MR imaging characteristics and, on the other, on histopathologic features have developed, precluding comparison of series (4–7,13,18,22–26). Furthermore, very few reports have systematically described the MR characteristics of different histologic subtypes of FCD in consistent series of patients.
We therefore reviewed the MR data of 49 patients operated on for drug-resistant partial epilepsy who had a histologic diagnosis of FCD, further subdivided into architectural dysplasia, cytoarchitectural dysplasia, or Taylor’s FCD (Table 1), based on the easily recognized neuropathologic features presented in our classification (14, 27).
FCDs occurred in about 24% of resected specimens in our total surgical population, a slightly higher proportion than in other surgical epilepsy series (6, 18, 22). Extensive MR examination often enables identification of subtle and highly localized FCDs that may not be revealed with conventional MR procedures and hence provides a more refined diagnosis that may contribute to the diagnostic workup of candidates for epilepsy surgery. Furthermore, electroclinical patterns and postsurgical outcome may differ according to FCD subtype (14, 28), further justifying the use of MR imaging. In addition to general cerebral imaging, our MR studies focused on the region suspected to be the epileptogenic zone from the electroclinical findings. High-resolution, 3D, fast field echo, T1-weighted acquisitions with 1-mm contiguous sections and IR sequences that emphasized signal intensity differences between gray and white matter were always performed to try to reveal subtle dysmorphic features (29). Nevertheless, we were unable to detect any MR signs of FCD in 39% of our cases; other MR series report similar findings. Unfortunately, our center lacked phase-array surface coils and facilities for curvilinear reconstruction and texture-morphologic postprocessing analysis—enhancements that can increase the ability of MR imaging to depict FCD in certain cases (30, 31).
Taylor’s FCD
We used published criteria to recognize Taylor’s FCD on MR images (16–18) (ie, the simultaneous presence of focal cortical thickening, poorly defined transition between gray and white matter, and hyperintensity of the subcortical white matter on T2-weighted images with decreasing signal intensity on T1-weighted images).
In nine of the 15 cases correctly recognized as Taylor’s FCD with MR imaging, all three of these features were present in eight, with only focal cortical thickening absent in the other. Thus, in agreement with the literature, our results indicate that this combination of features is the most reliable for diagnosing Taylor’s FCD with MR imaging. A tapering of the subcortical hyperintensity toward the lateral ventricle was observed in three of these cases; a feature also reported in the literature (17). On occasion, a slight hyperintensity of the cortex was also found on T2-weighted images.
In all our cases of Taylor’s FCD, the gross morphology of the overlying cortex and adjacent subarachnoid space were normal; in particular, we never observed the cortical dimple, proposed by Bronen et al (32) as a marker of subtle focal cortical dysplasias. No mass effect was ever observed either.
In the six histologically diagnosed cases of Taylor’s FCD not correctly diagnosed with MR imaging, five had normal MR findings and one had a hypoplastic anterior temporal lobe with moderate hyperintensity in the underlying white matter on T2-weighted images, prompting us to diagnose non-Taylor’s FCD.
Reexamination of the histologic features (particularly neuronal and balloon cell density) of cases with histologically diagnosed Taylor’s FCD showed no differences related to whether the MR findings were normal or abnormal. Of the two cases without balloon cells, one had the characteristic MR features of Taylor’s FCD and the other an unremarkable MR examination. It is evident that the observed signal intensity alterations cannot be caused solely by balloon cells and that an ensemble of histopathologic features, possibly including demyelination of the white matter below the dysplastic cortex, is necessary to induce perceptible signal intensity alterations. Immunocytochemical studies revealed high concentrations of cells containing exuberant neurofilaments in most Taylor’s FCD specimens, and it is possible that these may contribute to MR signal intensity alterations (33).
We were not concerned in this study with distinguishing Taylor’s FCD from low-grade tumors. In no case, however, did we find any MR characteristics that led to a suspicion of tumor (17). In accordance with previous findings (18, 34), in most (87%) patients with Taylor’s FCD the location was extratemporal, the frontal lobe including the pre- and postcentral gyrus being the most frequently involved.
Architectural Dysplasia
In the literature, architectural dysplasia refers to FCDs characterized histopathologically by a broad spectrum of alterations that have been variously classified by using disparate terminology (2–12); sometimes architectural dysplasia has even been considered a normal variant (12, 35). Both clinically and histologically, architectural dysplasia is less severe than Taylor’s FCD, and its MR features are less clearly established. In the present study, we defined architectural dysplasia by the presence of moderate disorganization of cortical laminae at histologic examination, with increased numbers of cytologically normal heterotopic neurons in the white matter.
Our previous clinical experience was that the most frequent MR findings in histologically diagnosed architectural dysplasia were focal brain hypoplasia, white matter core atrophy, and moderate white matter hyperintensity on T2-weighted images becoming hypointense on T1-weighted images. Occasionally there was also moderate gray-white matter junction blurring, usually distinct from the more marked blurring present in Taylor’s FCD. Such features allowed the diagnosis of non-Taylor’s FCD with MR imaging in 15 (54%) of the 28 histologically diagnosed cases of architectural dysplasia in the present study, whereas in two other cases the dysplasia resembled Taylor’s FCD. MR findings were unrevealing for dysplasia in the other 11 (39%) histologically diagnosed cases of architectural dysplasia. Most cases of architectural dysplasia were in the temporal lobe, facilitating comparison of the affected and unaffected hemispheres.
In 55% of the architectural dysplasia cases with temporal lobe location, ipsilateral hippocampal sclerosis was also present in histologic specimens. Although this frequency is lower than that in other series (36–38), it is noteworthy that hippocampal sclerosis was never present with histologically diagnosed Taylor’s FCD or cytoarchitectural dysplasia. This finding suggests that hippocampal sclerosis is part of a more diffuse abnormality of the temporal lobe (39). The relationship between hippocampal sclerosis and dysplasia remains unclear; however, it seems likely that the initial insult produces similar MR abnormalities in both the anterior temporal lobe and the hippocampus (ie, volume loss, signal intensity alteration, and loss of internal definition, which appears as gray-white matter blurring in the temporal neocortex) (40). The hippocampal microdysplasias reported recently (G. Jackson, personal communication, 2000) share pathologic features with neocortical dysplasias and suggest that a single malformative pathologic process may be occurring that affects the temporal neocortex and the hippocampus, where it eventually develops into hippocampal sclerosis.
Some authors regard volume loss and signal intensity abnormalities in the temporal lobe as additional MR criteria for a diagnosis of hippocampal sclerosis in patients with temporal lobe epilepsy (41–43). In our study, the primary selection criterion was the presence of dysplastic alterations in neuropathologic specimens. However, we found that in about 36% of cases in which these alterations were present in the temporal neocortex, hippocampal sclerosis was not found in the histologic specimens. Therefore, the abnormalities seen in the temporal lobe on MR images seem to be due to the primary dysplastic lesion and not to alterations secondary to hippocampal sclerosis. We therefore suggest that the dysplastic lesion itself may be the cause of the temporal lobe abnormalities recognized on MR images, and that it has intrinsic epileptogenic properties; accordingly, hippocampal sclerosis would be the epiphenomenon of a more diffuse cortical disorder of the temporal lobe.
Recent reports have described anterior temporal lobe MR abnormalities in patients with temporal lobe epilepsy (with or without hippocampal sclerosis) similar to those reported in this series (ie, temporal lobe atrophy with shrinkage of the white matter core, poorly defined gray-white matter boundary, and moderate subcortical white matter hyperintensity on T2-weighted images) (38, 44). In particular, Choi et al (44) found that, in patients with temporal lobe epilepsy who have pathologically proved hippocampal sclerosis, the presence of temporal lobe white matter abnormalities on MR images was an additional sign indicating the side of seizure origin. They also found abnormally abundant heterotopic neurons in such patients that may be sufficient to give rise to epilepsy.
Mitchell et al (38) came to contrasting conclusions. They reported on 50 patients with temporal lobe epilepsy, finding anterior temporal atrophy, loss of gray-white matter demarcation, and white matter signal intensity alterations on MR images in 29 patients (58%), including 23 with associated hippocampal sclerosis, but none in a control group. They found that increased white matter heterotopic neurons, hypercellularity, and gliosis of the molecular layer were more frequent in specimens resected from patients with temporal lobe epilepsy than in autoptic control specimens. However, these histologic features were present with equal frequency and severity in patients with and those without temporal lobe abnormalities on MR images, leading the authors to conclude that these features played no role generating the MR abnormalities.
Cytoarchitectural Dysplasia
In our neuropathologic classification, cytoarchitectural dysplasia was characterized by conspicuous cortical laminar disorganization associated with giant neurons, without balloon cells or dysmorphic neurons; it is thus intermediate between architectural dysplasia and Taylor’s FCD. We were unable to identify any MR features characterizing patients with a histologic diagnosis of cytoarchitectural dysplasia. MR abnormalities resembled those of Taylor’s FCD in two cases and non-Taylor’s FCD in one case and were unremarkable in the other three. Studies on a larger series of cytoarchitectural dysplasia cases may delineate a more informative picture.
In all patients in the present series in which MR lesions were identified, they were contained within the epileptogenic zone; however, the latter always extended well beyond the structural lesion (14). It is noteworthy that in only one case were MR abnormalities found in a different lobe from that of the surgical resection, the location of which was decided from the electroclinical data. The strong correlation between MR findings and electroclinical-pathologic data suggests that even the mildest forms of cortical dysplasia are often involved in epileptogenesis (45).
With more regard to surgical outcome, the best results were obtained in patients with Taylor’s FCD, 73% of whom were seizure free (Engel class Ia) 1 year or more after the operation. Less favorable clinical outcome was achieved by patients with architectural dysplasia (43% in class Ia), with intermediate outcome in the cytoarchitectural dysplasia group. These findings suggest that a favorable outcome is more likely in cases with more severe histopathologic abnormalities, which however may be more circumscribed in extent (3).
Conclusion
Distinct neuropathologic and electroclinical features, as well as different surgical outcomes, characterized the three subtypes of FCD. MR features differentiate between Taylor’s FCD and non-Taylor’s FCD in most cases, although there is some overlap. Detailed MR diagnosis may modify the presurgical workup and surgical planning and may have prognostic value.
Acknowledgments
This work is dedicated to the late Professor Claudio Munari, teacher and friend. Thanks are due to Don Ward for help with the English.
References
- 1.Taylor DC, Falconer MA. Focal dysplasia of the cerebral cortex in epilepsy. J Neurol Neurosurg Psychiatry 1971;34:369–387 [DOI] [PMC free article] [PubMed] [Google Scholar]
- 2.Meencke HJ, Janz D. Neuropathological findings in primary generalized epilepsy: a study of eight cases. Epilepsia 1984;25:8–21 [DOI] [PubMed] [Google Scholar]
- 3.Hardiman O, Burke T, Phillips J, et al. Microdysgenesis in resected temporal neocortex: incidence and clinical significance in focal epilepsy. Neurology 1988;38:1041–1047 [DOI] [PubMed] [Google Scholar]
- 4.Kuzniecky RI, Garcia JH, Faught E, Morawetz R. Cortical dysplasia in TLE: magnetic resonance imaging correlations. Ann Neurol 1991;29:293–298 [DOI] [PubMed] [Google Scholar]
- 5.Palmini A, Andermann F, Olivier A, Tampieri D, Robitaille Y. Focal neuronal migration disorders and intractable partial epilepsy: a study of 30 patients. Ann Neurol 1991;30:741–749 [DOI] [PubMed] [Google Scholar]
- 6.Prayson RA, Estes ML. Cortical dysplasia: a histopathologic study of 52 cases of partial lobectomy in patients with epilepsy. Hum Pathol 1995;26:493–500 [DOI] [PubMed] [Google Scholar]
- 7.Mischel PS, Nguyen LP, Vinters HV. Cerebral cortical dysplasia associated with pediatric epilepsy: review of neuropathologic features and proposal for a grading system. J Neuropathol Exp Neurol 1995;54:137–153 [DOI] [PubMed] [Google Scholar]
- 8.Robain O. Introduction to the pathology of cerebral cortical dysplasia. In: Guerrini R, Andermann F, Canapicchi R, Roger J, Zifkin BC, Pfanner P. eds. Dysplasias of the Cerebral Cortex and Epilepsy. Philadelphia: Lippincott-Raven Publishers;1996. :1–9
- 9.Brannstrom T, Silfvenius H, Olivecrona M. The range of disorders of cortical organization in surgically treated epilepsy patients. In: Guerrini R, Andermann F, Canapicchi R, Roger J, Zifkin BC, Pfanner P, eds. Dysplasias of the Cerebral Cortex and Epilepsy. Philadelphia: Lippincott-Raven Publishers;1996. :57–64
- 10.Armstrong DD, Mizrahi EM. Pathology of epilepsy in childhood. In: Scaravilli F, ed. Neuropathology of epilepsy. Singapore, World Scientific;1998. :169–338
- 11.Cotter DR, Honavar M, Everall I. Focal cortical dysplasia: a neuropathological and developmental perspective. Epilepsy Res 1999;36:155–164 [DOI] [PubMed] [Google Scholar]
- 12.Kasper BS, Stefan H, Buchfelder M, Paulus W. Temporal lobe microdysgenesis in epilepsy versus control brains. J Neuropathol Exp Neurol 1999;58:22–28 [DOI] [PubMed] [Google Scholar]
- 13.Kuznieky RI, Barkovich AJ. Malformations of cortical development and epilepsy. Brain Dev 2000;23:2–11 [DOI] [PubMed] [Google Scholar]
- 14.Tassi L, Colombo N, Garbelli R, et al. Focal cortical dysplasia: neuropathological subtypes, EEG, neuroimaging and surgical outcom. Brain 2002;125(Pt 8):1719–1732 [DOI] [PubMed] [Google Scholar]
- 15.Otsubo H, Hwang PA, Jay V, et al. Focal cortical dysplasia in children with localization-related epilepsy: EEG, MRI and SPECT findings. Pediatr Neurol 1993;9:101–107 [DOI] [PubMed] [Google Scholar]
- 16.Yagishita A, Arai N, Maehara T, Shimizu H, Tokumaru AM, Oda M. Focal cortical dysplasia: appearance on MR images. Radiology 1997;203:553–559 [DOI] [PubMed] [Google Scholar]
- 17.Bronen RA, Vives KP, Kim JH, Fulbright RK, Spencer SS, Spencer DD. Focal cortical dysplasia of Taylor, balloon cell subtype: MR differentiation from low-grade tumors. Am J Neuroradiol 1997;18:1141–1151 [PMC free article] [PubMed] [Google Scholar]
- 18.Kuzniecky RI. MRI of focal cortical dysplasia. In: Guerrini R, Andermann F, Canapicchi R, Roger J, ?? Zifkin balloon cells, Pfanner P, eds. Dysplasias of the Cerebral Cortex and Epilepsy. Philadelphia: Lippincott-Raven Publishers;1996. :145–150
- 19.Arai N, Oda M. Surgical neuropathology of intractable epilepsy. Epilepsia 1997;38(suppl 6):11–16 [Google Scholar]
- 20.Engel J Jr. Outcome with respect to epileptic seizures. In: Engel J Jr, ed. Surgical treatment of the epilepsies. New York: Raven Press;1987. :553–571
- 21.Raymond AA, Cook MJC, Fish DR, Shorvon SD. Cortical dysgenesis in adults with epilepsy. In: Shorvon SD, Fish DR, Andermann F, Bydder GM, Stefan H, eds. Magnetic Resonance Scanning and Epilepsy. New York: Plenum Press;1994. :89–94
- 22.Kuznieky RI. Magnetic resonance imaging in developmental disorders of the cerebral cortex. Epilepsia 1994;35:S44–S56 [DOI] [PubMed] [Google Scholar]
- 23.Kuznieky RI. Neuroimaging in pediatric epilepsy. Epilepsia 1996;37(suppl 1):S10–S21 [DOI] [PubMed] [Google Scholar]
- 24.Palmini A, Gambardella A, Andermann F, et al. Operative strategies for patients with cortical dysplastic lesions and intractable epilepsy. Epilepsia 1994;35(suppl 6):S57–S71 [DOI] [PubMed] [Google Scholar]
- 25.Guerrini R, Dravet C, Bureau M, et al. Diffuse and localized dysplasias of cerebral cortex: clinical presentation, outcome, and proposal for a morphologic MRI classification based on a study of 90 patients. In: Guerrini R, Andermann F, Canapicchi R, Roger J, ?? Zifkin balloon cells, Pfanner P, eds. Dysplasias of the Cerebral Cortex and Epilepsy. Philadelphia: Lippincott-Raven Publishers;1996. :255–269
- 26.Kim SK, Na DG, Byun HS, et al. Focal cortical dysplasia: comparison of MRI and FDG-PET. J Comput Assist Tomogr 2000;24:296–302 [DOI] [PubMed] [Google Scholar]
- 27.Spreafico R. Developmental abnormalities in human epilepsy. Epilepsia 2000;41:4510768300 [Google Scholar]
- 28.Tassi L, Pasquier B, Minotti L, et al. Cortical displasia: electroclinical, imaging, and neuropathologic study of 13 patients. Epilepsia 2001;42:1112–1123 [DOI] [PubMed] [Google Scholar]
- 29.Barkovich AJ, Rowley HA, Andermann F. MR in partial epilepsy: value of high-resolution volumetric techniques. AJNR Am J Neuroradiol 1995;16:339–343 [PMC free article] [PubMed] [Google Scholar]
- 30.Bastos AC, Korah IP, Cendes F, et al. Curvilinear reconstruction of 3D magnetic resonance imaging in patients with partial epilepsy: a pilot study. Magn Reson Imaging 1995;13:1107–1112 [DOI] [PubMed] [Google Scholar]
- 31.Bernasconi A, Antel SB, Collins DL, et al. Texture analysis and morphological processing of magnetic resonance imaging assist detection of focal cortical dysplasia in extra-temporal epilepsy. Ann Neurol 2001;49:770–775 [PubMed] [Google Scholar]
- 32.Bronen RA, Spencer DD, Fulbright RK. Cerebrospinal fluid cleft with cortical dimple: MR imaging marker for focal cortical dysgenesis. Radiology 2000;214:657–663 [DOI] [PubMed] [Google Scholar]
- 33.Spreafico R, Tassi L, Colombo N, et al. Inhibitory circuits in human dysplastic tissue. Epilepsia 2000;41(suppl 6):S168–S173 [DOI] [PubMed] [Google Scholar]
- 34.Palmini A, Andermann F, Olivier A. Neuronal migration disorders: a contribution of modern neuroimaging to the etiologic diagnosis of epilepsy. Can J Neurol Sci 1991;18:580–587 [DOI] [PubMed] [Google Scholar]
- 35.Kaufmann WE, Galaburda AM. Cerebrocortical microdysgenesis in neurologically normal subjects: a histopathologic study. Neurology 1989;39:238–244 [DOI] [PubMed] [Google Scholar]
- 36.Ho SS, Kuzniecky RI, Gilliam F, Faught E, Morawetz R. Temporal lobe developmental malformations and epilepsy: dual pathology and bilateral hippocampal abnormalities. Neurology 1998;50:748–754 [DOI] [PubMed] [Google Scholar]
- 37.Kuznieky RI, Ho SS, Martin R, Faught E, et al. Temporal lobe developmental malformations and hippocampal sclerosis: epilepsy surgical outcome. Neurology 1999;52:479–484 [DOI] [PubMed] [Google Scholar]
- 38.Mitchell LA, Jackson GD, Kalnins RM, et al. Anterior temporal abnormality in TLE: a quantitative MRI and histopathologic study. Neurology 1999;52:327–333 [DOI] [PubMed] [Google Scholar]
- 39.Falconer MA, Serafetinides EA, Corsellis JAN. Etiology and pathogenesis of temporal lobe epilepsy. Arch Neurol 1964;10:233–240 [DOI] [PubMed] [Google Scholar]
- 40.Raymond AA, Fish DR, Stevens JM, Cook MJC, Sisodiya SM, Shorvon SD. Association of hippocampal sclerosis with cortical dysgenesis in patients with epilepsy. Neurology 1994b;44:1841–1845 [DOI] [PubMed] [Google Scholar]
- 41.Kuzniecky R, De la Sayette V, Ethier R, et al. Magnetic resonance imaging in temporal lobe epilepsy: pathological correlation. Ann Neurol 1987;22:341–347 [DOI] [PubMed] [Google Scholar]
- 42.Bronen RA, Cheung G, Charles JT, et al. Imaging findings in hippocampal sclerosis: correlation with pathology. AJNR Am J Neuroradiol 1991;12:933–940 [PMC free article] [PubMed] [Google Scholar]
- 43.Meiners LC, van Gils A, Jansen GH, et al. Temporal lobe epilepsy: the various MR appearances of histologically proven mesial temporal sclerosis. AJNR Am J Neuroradiol 1994;15:1547–1555 [PMC free article] [PubMed] [Google Scholar]
- 44.Choi D, Na DG, Byun HS, et al. White-matter change in mesial temporal sclerosis: correlation of MRI with PET, pathology and clinical features. Epilepsia 1999;40:1634–1641 [DOI] [PubMed] [Google Scholar]
- 45.Palmini A, Gambardella A, Andermann F, et al. The human dysplastic cortex is intrinsecally epileptogenic. In: Guerrini R, Andermann F, Canapicchi R, Roger J, ?? Zifkin balloon cells, Pfanner P, eds. Dysplasias of the Cerebral Cortex and Epilepsy. Philadelphia: Lippincott-Raven Publishers,1996;43–52