

Abstract
BACKGROUND AND PURPOSE: The common entity cerebral venous sinus thrombosis is associated with the poorly characterized imaging finding of parenchymal abnormalities; diffusion-weighted imaging has offered some insight into these manifestations. We assessed the relationship between the diffusion constant from apparent diffusion coefficient (ADC) maps in patients with cerebral venous thrombosis (CVT) with follow-up imaging findings and clinical outcome.
METHODS: We evaluated the medical records and T2-weighted MR images of 13 patients with CVT complicated by intraparenchymal abnormality. Diffusion-weighted (DW) images and ADC maps were evaluated for increased, decreased, or unchanged signal intensity and were compared with signal intensity of contralateral, normal-appearing brain. In addition, ADCs were obtained in nine pixel regions of interest in abnormal regions in eight of the 13 patients.
RESULTS: Eight patients had superficial CVT, and five had superficial and deep CVT. CVT of deep veins was associated with deep gray nucleus and deep white matter abnormalities, whereas superficial CVT was associated with cortical and subcortical abnormalities. Twenty-four nonhemorrhagic lesions were identified in 10 of 13 patients on the basis of follow-up imaging findings. Four patients without seizures had lesions with decreased diffusion that appeared hyperintense on follow-up T2-weighted images, three patients with seizures had lesions with decreased diffusion that resolved, and seven patients had lesions with increased diffusion that resolved. Three of 10 patients had more than one lesion type. No difference was noted in mean ADCs for lesions with decreased diffusion that resolved compared with lesions with decreased diffusion that persisted.
CONCLUSION: DW imaging in these patients disclosed three lesion types: lesions with elevated diffusion that resolved, consistent with vasogenic edema; lesions with low diffusion that persisted, consistent with cytotoxic edema in patients without seizure activity; and lesions with low diffusion that resolved in patients with seizure activity. This information may be important in prospectively determining severity of irreversible injury and in patient treatment.
The conventional MR imaging findings of cerebral venous sinus thrombosis (CVT) have been well characterized (1–7). The predominant findings are mass effect in most patients; hyperintense parenchymal abnormalities on a T2-weighted image that involve gray matter, white matter, or both in approximately 50–60% of patients and intraparenchymal hematoma in approximately 35–40% (8, 9). Although some T2 hyperintense parenchymal abnormalities resolve, others persist and indicate permanent tissue injury. Lesion distribution does not differentiate between these two lesion types.
The pathophysiology of CVT remains unclear (1, 10–19). Both vasogenic and cytotoxic edema are thought to occur in the setting of CVT (20). Increased venous pressure may cause breakdown of the blood-brain barrier and vasogenic edema or may cause reduced cerebral blood flow and cytotoxic edema (20).
Unlike conventional MR images, diffusion-weighted (DW) MR images can differentiate between vasogenic and cytotoxic edema (21). DW images are sensitive chiefly to the molecular diffusion of water molecules (21, 22). Cytotoxic edema is characterized by markedly decreased diffusion (21). Vasogenic edema, with increased interstitial water, demonstrates increased diffusion (21). A few reports have addressed DW imaging findings in CVT in animals (23) and in humans (7, 24–27). Lesions with elevated, unchanged, or decreased apparent diffusion coefficients (ADCs) have been identified in the early period, but information concerning the follow-up of these lesions is limited (20, 26, 27).
We sought to characterize parenchymal changes associated with CVT with DW imaging and to determine whether this technique could differentiate lesions that would resolve from those that would lead to permanent injury. More specifically, the purpose of this investigation was to compare the diffusion constant from ADC maps of lesions detected on T2-weighted and fluid-attenuated inversion-recovery (FLAIR) images in patients with CVT with follow-up imaging findings and clinical outcome.
Methods
Patient Selection
We retrospectively queried the radiology reports of brain CT and MR imaging examinations performed from 1994 through 1999 by using the keywords venous, sinus, thrombosis, infarct, and stroke by use of commercially available radiology information system software (Folio; Camberly Systems, Boston, MA). Inclusion criteria for subsequent analysis were availability of T2-weighted images and DW images with ADC maps, presence of hyperintense parenchymal lesions on T2-weighted images, and a final discharge diagnosis of CVT. Clinical histories, treatment, discharge diagnoses, and neurologic assessment at discharge were obtained from written and electronic records, including discharge summaries.
Imaging
MR imaging was performed with a 1.5-T whole-body system (Signa; GE Medical Systems, Milwaukee, WI) with an echo-planar retrofit (Advanced NMR Systems, Wilmington, MA).
DW images were obtained by using single-shot, spin-echo echo-planar imaging with sampling of the entire diffusion tensor with six nonlinear directions. Six high-b-value images corresponding to the six nonlinear directions were acquired followed by a single low-b-value image. The high b value was 1221 mm2/s, and the low b value was 3 mm2/s. Imaging parameters included 6000/118 (TR/TE), a field of view (FOV) of 40 × 20 cm, image matrix of 256 × 128 pixels, section thickness of 6 mm with 1-mm gap, 20 axial sections, and three signal averages. Isotropic DW images were generated off-line on a network workstation (Sparcstation 20; Sun Microsystems, Milpitas, CA). ADC maps were also generated. This methodology has been previously described in detail (28, 29).
T1-weighted sagittal images were acquired with 650/16, 20-cm FOV, an acquisition matrix of 256 × 192 pixels, section thickness of 5 mm with a 1-mm gap, and one signal average.
FLAIR axial MR images were obtained with 10,002/141/2200 (TR/TE/TI), 24-cm FOV, acquisition matrix of 256 × 192 pixels, section thickness of 5 mm with a 1-mm gap, and one signal average.
Fast spin-echo T2-weighted MR axial images were obtained with 4200/102, 20-cm FOV, acquisition matrix of 256 × 256 pixels, section thickness of 5 mm with a 1-mm gap, and one signal average.
Follow-up Imaging
Cerebral imaging after the initial imaging, including CT combined with CT venography and MR imaging with or without MR venography or contrast material, was considered in the evaluation of lesion evolution. All subsequent cerebral images were evaluated. In the absence of follow-up MR images, lesion persistence or resolution was estimated by using follow-up CT images (one patient). Not all patients underwent follow-up imaging.
Image Analysis
All images were reviewed by two radiologists (P.W.S.) certified by the American Board of Radiology (one of whom has a certificate of added qualification in neuroradiology) and one neuroradiologist.
DW images and ADC maps were inspected visually, and signal intensity was assessed as increased, decreased, or unchanged in comparison to that of the contralateral, normal-appearing brain.
In addition, ADC values were obtained in nine pixel (nine pixels were measured encompassing 4.69 × 4.69 mm in plane) regions of interest in abnormal regions in eight of the 13 patients. Regions of interest were placed by two of us (B.W. and P.W.S.), in the region of greatest differential signal intensity based on a subjective visual evaluation. ADC values were not universally available due to the retrospective nature of the study.
A Student t test was used, and P values <.05 were considered statistically significant.
Results
Thirteen patients met the inclusion criteria and were identified with CVT and gray or white matter lesions. At least one follow-up MR image was available in nine patients. One patient (patient 5) underwent only nonenhanced brain CT combined with CT venography at follow-up, and three patients had no follow-up imaging. Patient demographic and treatment data are presented in Table 1. There were five male and eight female patients with a mean age of 39 years. The most common presenting symptoms were headache (11 patients), extremity weakness (eight patients), altered mental status (five patients), and speech changes (four patients). Four patients had seizure activity immediately before or at the time of presentation for diagnostic imaging; seizure activity in these patients was thought to be related to their presentation, evaluation, and imaging as determined by the neurology staff caring for them. All received intravenous anticoagulation with heparin. Two patients received intravenous thrombolysis with urokinase. The first MR image was obtained at a mean of 4 days after admission. A follow-up MR image was obtained in nine patients, at a mean of 27 days. Discharge diagnostic CVT causes were brain metastases, tuberculous mastoiditis, hypercoagulability (factor V Leiden and systemic lupus erythmatosus), hyperviscosity (due to dehydration or cyanosis), and choriocarcinoma of the appendix. Causes were not identified in four patients.
TABLE 1:
Demographic data in 13 patients with CVT stroke
| Patient No./Age/Sex | Initial Symptoms | Venous Sinuses | Intravenous Therapy | CVT Cause | Status at Discharge | Seizure |
|---|---|---|---|---|---|---|
| 1/71/F | Unresponsive. | Superior sagittal, L transverse. | Heparin | Unknown | Died | No |
| 2/34/F | Headache, confusion, R upper extremity weakness, behavior change, fatigue, somnolence. | Superior sagittal. | Heparin | Lupus, vitamin B12 deficiency | Normal | Yes |
| 3/39/M | L Hemiplegia, headache, nausea. | Superior sagittal, B transverse, R straight, R cortical. | Heparin, urokinase | Unknown | Slight L facial droop, upper extremity weakness, pronator drift. | Yes |
| 4/25/F | Headache, L upper extremity weakness. | Superior sagittal, R transverse. | Heparin | Oral contraceptives | Improved headache, weakness resolved. | No |
| 5/24/F | Headache. | Superior sagittal, B deep. | Heparin | Unknown | Unknown | No |
| 6/30/F | Headache, L hand weakness, memory and speech difficulties. | Superior sagittal straight, R transverse, R internal cerebral. | Urokinase, heparin | Metastatic choriocarcinoma | Resolved | Yes |
| 7/52/F | Headache, L hand and facial weakness, speech difficulties. | Superior sagittal, R sigmoid, R transverse, R jugular vein. | Heparin | Unknown | Resolved | No |
| 8/49/M | Headache, nausea, disorientation, speech difficulties, urinary incontinence. | R transverse, R sigmoid, R straight, R internal cerebral, VOG. | Heparin | Factor V Leiden | Speech difficulties and disorientation improved, remaining symptoms resolved. | No |
| 9/31/M | Seizure, headache, L weakness. | Superior sagittal, R transverse. | Urokinase, Heparin | Dehydration, TB mastoiditis | L weakness improved, headache resolved. | Yes |
| 10/17/F | Headache, fatigue, nausea, confusion, L hemiparesis. | Inferior sagittal, B straight, B deep. | Heparin | Dehydration, oral contraceptives | L weakness improved, other symptoms resolved. | No |
| 11/67/M | Headache, speech and vision difficulties. | Superior sagittal, R transverse. | Heparin, Lovenox (SC) | Dehydration | L field cut persisted, other symptoms resolved. | No |
| 12/43/F | Headache, visual difficulties, decreased mental acuity, vague paresthesias. | Superior sagittal, R straight, R transverse, R jugular vein. | Heparin | Hyperviscosity | Died | No |
| 13/41/M | L arm numbness and weakness. | R cortical veins. | Heparin | Unknown | Weakness improved. | No |
Note.—B indicates bilateral; L, left; R, right; SC, subcutaneous; TB, tuberculosis; VOG, vein of Galen.
Imaging data are presented in Table 2. Most patients had more than one lesion. Eight patients had superficial CVT, and five patients had both superficial and deep CVT. CVT of the deep veins was associated with deep gray nuclei and deep white matter abnormalities, whereas superficial CVT was associated with cortical and subcortical abnormalities. Ten patients had follow-up imaging. Four of these patients had five lesions with decreased diffusion that resulted in T2 hyperintensity within the region on follow-up examination (Fig 1). Two lesions were in a superficial CVT distribution, and three were in a deep CVT distribution. Three patients who had recent seizure activity had 10 lesions with decreased diffusion that had resolved on follow-up images (Fig 2). Six lesions were in a superficial CVT distribution, and four were in a deep CVT distribution. Seven patients had 10 lesions with elevated diffusion that resolved on follow-up images (Fig 3). Five lesions were in a superficial CVT distribution, and five were in a deep CVT distribution. Three patients had multiple lesion types (Fig 4).
TABLE 2:
Imaging data in 13 patients with CVT stroke
| Patient No. | Lesion Locations | Anatomic Involvement | T2WI | DWI | ADC | ADC Mean (×10−3 mm2/s) | Follow-up MR or CT | Hemorrhage | Follow-up Sinus Patency |
|---|---|---|---|---|---|---|---|---|---|
| 1 | 1. B occipital | G/W | Hyperintense | Hyperintense | Hypointense | Not done | Not done | No | Not done |
| 2. Cerebellum | G/W | Hyperintense | Hyperintense | Hypointense | Not done | ||||
| 3. B frontal | G/W | Hyperintense | Hyperintense | Hypointense | Not done | ||||
| 4. B parietal | G/W | Hyperintense | Hyperintense | Hypointense | Not done | ||||
| 2 | 1. L frontal | G/W | Hyperintense | Hyperintense | Hypointense | 0.54306 | Resolution (MR) | No | No change |
| 2. R frontal | G/W | Hyperintense | Hyperintense | Hypointense | 0.55513 | Resolution (MR) | |||
| 3 | 1. R parietal (central) | G/W | Hypointense | Hypointense (susceptibility) | Hypointense (hemorrhage) | Not done | Hemorrhage (MR) | Yes | No change |
| 2. R parietal (peripheral) | G/W | Hyperintense | Isointense | Hyperintense | 1.6038 | Resolution (MR) | |||
| 4 | 1. R frontal (central) | G/W | Hypointense | Hypointense (susceptibility) | Hypointense (hemorrhage) | Not done | Hemorrhage (MR) | Yes | Recanalized |
| 2. R frontal (peripheral) | G/W | Hyperintense | Hyperintense | Hyperintense | 1.0605 | Resolution (MR) | |||
| 3. R parietal | G/W | Hyperintense | Isotense | Hyperintense | 1.5659 | Resolution (MR) | |||
| 5 | 1. R thalamus (central) | DG | Hyperintense | Hyperintense | Hypointense | 0.43744 | Infraction (CT) | No | Recanalized |
| 2. R. thalamus (peripheral) | DG | Hyperintense | Iso/Hyperintense | Hyperintense | 1.075 | Resolution (CT) | |||
| 6 | 1. R thalamus | DG | Hyperintense | Hyperintense Isotense | Hypointense (central) | 0.45055 | Infarction (MR) | No | Recanalized |
| 2. R thalamus | DG | Hyperintense | Hyperintense | 1.204 | Resolution (MR) | ||||
| 3. R putamen | DG | Hyperintense | Hyperintense | Hyperintense (peripheral) | 0.41378 | Resolution (MR) | |||
| 4. L thalamus | DG | Hyperintense | Hyperintense | 0.47527 | Resolution (MR) | ||||
| 5. L frontal | G/W | Hyperintense | Hyperintense | Hypointense | 0.42851 | Resolution (MR) | |||
| 6. L caudate | DG | Hyperintense | Hyperintense | Hypointense | 0.44393 | Resolution (MR) | |||
| 7. L putamen | DG | Hyperintense | Hypointense | 0.39336 | Resolution (MR) | ||||
| 7 | R parietal | G/W | Hyperintense | Hyperintense | Hyperintense | Not done | Resolution (MR) | No | Recanalized |
| 8 | 1. R thalamus (central) | DG | Hypointense (hemorrhage) | Hypointense (susceptibility) | Hypointense | Not done | Hemorrhage (MR) | Yes | Recanalized |
| 2. R thalamus (peripheral) | DG | Hyperintense (edema) | Hyperintense | Hyperintense | 1.0134 | Resolution (MR) | |||
| 3. L thalamus | DG | Hyperintense | Hyperintense | Hyperintense | 0.89987 | Resolution (MR) | |||
| 4. R corona radiata | W | Hyperintense | Hyperintense | Hyperintense | 0.88926 | Resolution (MR) | |||
| 9 | 1. R frontal | G/W | Hyperintense | Hyperintense | Hypointense | 0.2545 | Resolution (MR) | No | Recanalized |
| 2. L frontal | G/W | Hyperintense | Hyperintense | Hypointense | 0.15438 | Resolution (MR) | |||
| 3. L parietal | W | Hyperintense | Hyperintense | Hypointense | 0.25045 | Resolution (MR) | |||
| 10 | 1. R thalamus (central) | DG | Hyperintense | Hyperintense | Hypointense | Not done | Hemorrhage (MR) Resolution (MR) | Yes | No change |
| 2. R thalamus (peripheral) | DG | Hyperintense | Iso/hyperintense | Hyperintense | Not done | Infarction (MR) | |||
| 3. L thalamus | DG | Hyperintense | Hyperintense | Hypointense | Not done | ||||
| 11 | 1. R centrum | W | Hyperintense | Hyperintense | Hypointense | Not done | Not done | No | Not done |
| 2. R temporal | G/W | Hyperintense | Isotense | Hyperintense | Not done | ||||
| 3. R occipital | G/W | Hyperintense | Isotense | Hyperintense | Not done | ||||
| 12 | R centrum | G/W | Hyperintense | Hyperintense | Hypointense | 0.56893 | Infarction (MR) | No | No change |
| L centrum | G/W | Hyperintense | Hyperintense | Hypointense | 0.54106 | Infarction (MR) | |||
| 13 | L frontal | G/W | Hyperintense | Hyperintense | Hypointense | Not done | Not done | No | Not done |
Note.—B indicates bilateral; CT, nonenhanced CT with CT venography; DG, deep gray; DWI, diffusion-weighted imaging; G, gray matter; G/W, gray and white matter; L, left; MR, MR imaging; R, right; T2WI, T2-weighted imaging; W, white matter.
Fig 1.
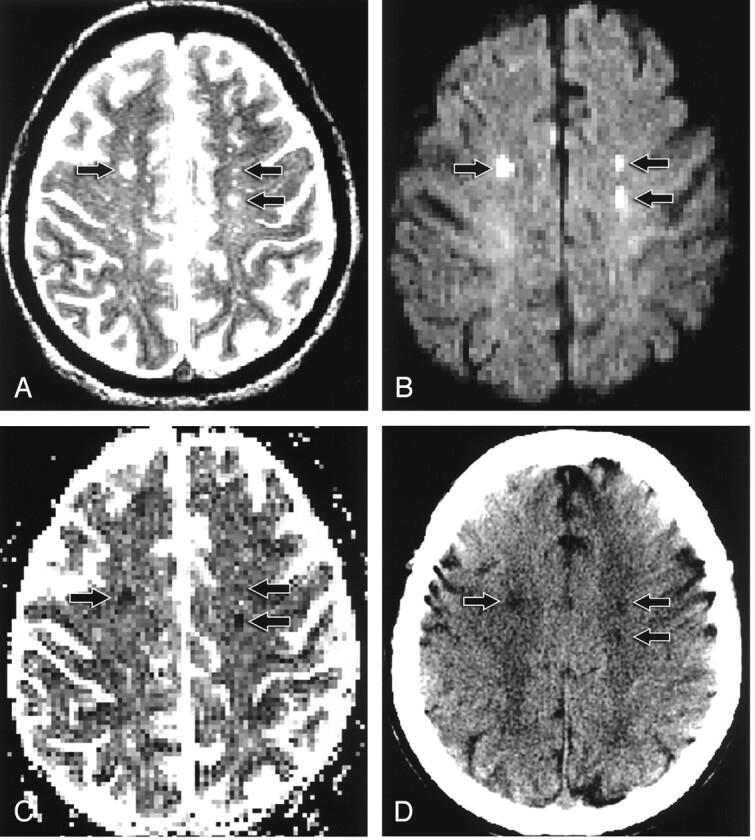
Patient 12. A 43-year-old woman with headache, blurred vision, and mental status change.
A, T2-weighted axial MR image shows bilateral centrum semiovale hyperintense foci (arrows).
B, On axial echo-planar DW image, the lesions (arrows) are hyperintense.
C, On axial ADC map, the lesions (arrows) are hypointense.
D, Follow-up axial CT scan shows low-attenuation foci (arrows), corresponding to the abnormalities on initial MR images, that are consistent with infarct.
Fig 2.
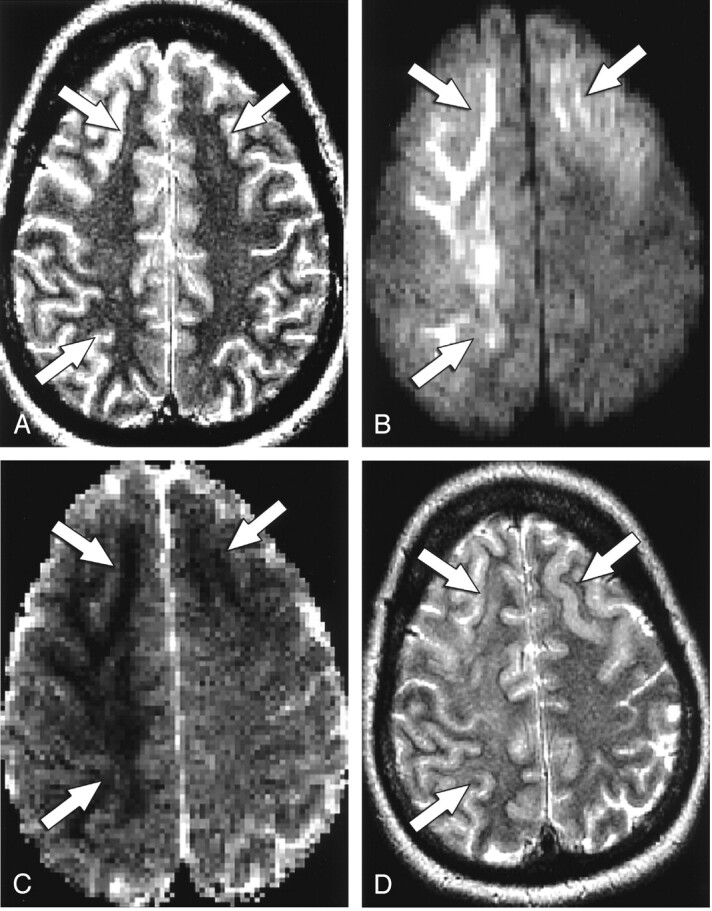
Patient 9. A 31-year-old man with mental status changes and seizure activity.
A, T2-weighted axial MR image shows bilateral frontal and right parietal hyperintense foci (arrows).
B, On axial DW image, the lesions (arrows) are hyperintense.
C, On axial ADC map, the lesions (arrows) are hypointense.
D, Follow-up T2-weighted axial MR image shows no abnormality in the bilateral frontal and right parietal regions (arrows), consistent with interval resolution of the previous abnormalities.
Fig 3.
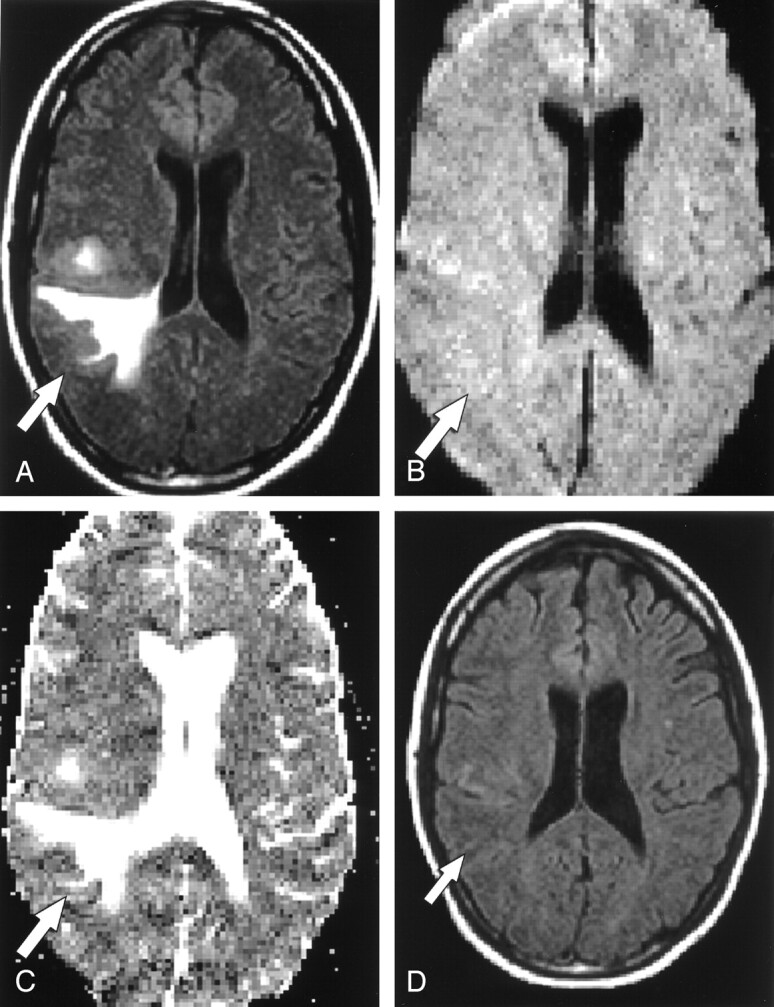
Patient 4. A 25-year-old woman with headache and left-sided weakness.
A, FLAIR axial MR image shows a right parietal T2 hyperintense focus (arrow).
B, On axial echo-planar DW image, the lesion (arrow) is slightly hyperintense.
C, On axial ADC map, the lesion (arrow) is hyperintense.
D, Follow-up FLAIR axial MR image shows no abnormality, consistent with interval resolution of the previous abnormality.
Fig 4.
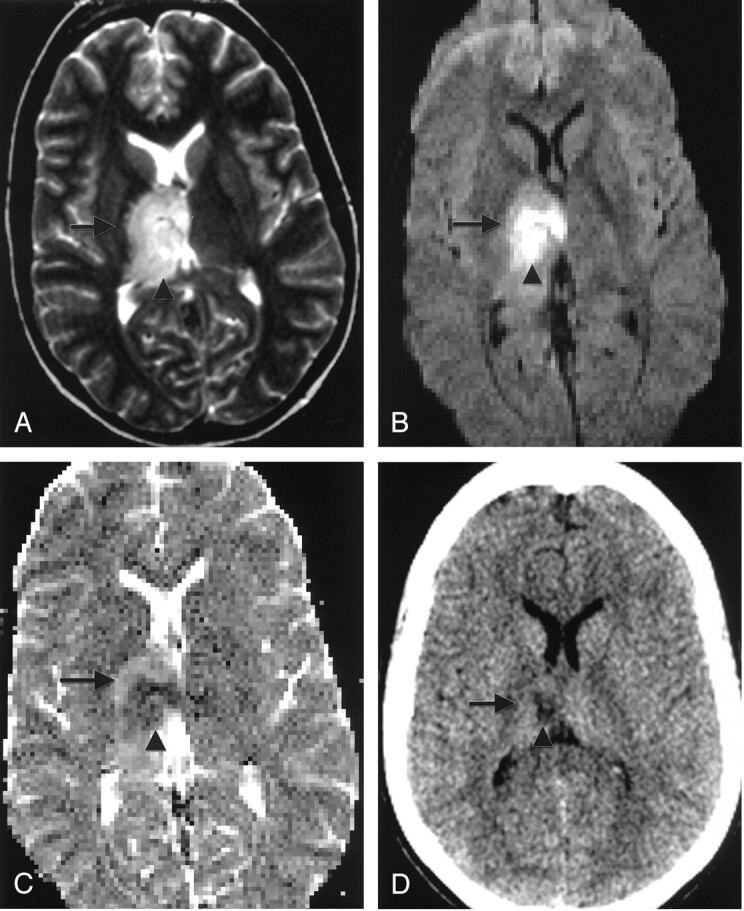
Patient 5. A 24-year-old woman with headache and left-sided sensory loss.
A, T2-weighted axial MR image shows central (arrowhead) and peripheral (arrow) right thalamic T2 hyperintense foci.
B, On axil echo-planar DW image, the central lesion (arrowhead) is hyperintense and the peripheral lesion is isointense (arrow).
C, On axial ADC map, the lesions are hypointense (arrowhead) and hyperintense (arrow), respectively.
D, Follow-up CT scan shows central right thalamic infarct (arrowhead) and no abnormality in the peripheral region (arrow).
Ten patients had follow-up imaging, nine with MR images and one with a CT scan only. Three patients had no follow-up imaging. Three patients had lesions (six total) with decreased diffusion in a superficial distribution. One patient had two lesions with elevated diffusion in a superficial distribution.
Four patients had four hemorrhagic lesions on their initial DW images (Table 2). Two were in a superficial distribution and two were in a deep CVT distribution. The hemorrhage was hypointense on T2-weighted images, consistent with deoxyhemoglobin, and ADC values were not calculated in these regions because of susceptibility effects (30). In all four patients, the hemorrhage was thought to be secondary to venous sinus thrombosis rather than anticoagulation since it was identified on MR images before the administration of heparin.
ADC values for eight of the patients are listed in Table 2. The mean ADC value for lesions with low values that resolved was 0.500 ± 0.065 × 10⁻³ mm2/s, whereas the mean ADC value for lesions with low values that persisted was 0.391 ± 0.13 × 10⁻³ mm2/s. These values were not statistically significantly different (P > .05). The mean ADC value for lesions with high values that resolved was 1.16 ± 0.30 × 10⁻³ mm2/s.
By the time of discharge (Table 1), two of the patients had died, two had complete resolution of symptoms, seven improved without complete resolution of symptoms (most frequently weakness), one was stable without significant improvement in symptoms, and one patient’s final neurologic clinical records were unavailable and no discharge summary was dictated.
Discussion
We found that DW imaging, in combination with the clinical history (i.e., seizure), may be useful in differentiating parenchymal lesions that resolve from those that progress to permanent injury in the setting of acute CVT. In our retrospective cohort, lesions with elevated diffusion resolved, lesions with decreased diffusion resolved when the patient had seizures, and lesions with decreased diffusion in the absence of clinical seizure demonstrated abnormality on follow-up images. All three lesion types were associated with both superficial and deep CVT and involvement of gray and white matter structures. The ADC values were similar between the lesions with low ADC values that resolved and the lesions with low ADC values that persisted.
On conventional CT and MR images, radiologic signs of CVT stroke include hydrocephalus, T2 hyperintense parenchymal abnormalities, and intraparenchymal hematoma (27). The T2 hyperintense parenchymal abnormalities may represent vasogenic edema, cytotoxic edema, or both. Unlike conventional FLAIR and T2-weighted imaging, DW imaging can distinguish between vasogenic and cytotoxic edema (21). As cytotoxic edema due to acute stroke develops, ADC values decrease (21). The current predominant theory to describe this phenomenon involves loss of ionic gradients with net translocation of water from the extracellular to the intracellular space where water movement is more restricted (21). Cytotoxic edema produces hyperintensity on DW images and hypointensity on ADC images. In contrast, vasogenic edema leads to increased water in the extracellular space where water is less restricted and is characterized by ADC values that are increased compared with those of normal brain tissue (21). Because DW images have both T2 and diffusion components, vasogenic edema may appear hypointense, isointense, or slightly hyperintense on DW images, but it always produces hyperintensity on ADC images.
Ten lesions characterized by elevated diffusion that showed essentially no abnormality on follow-up images were identified. These lesions likely represented vasogenic edema that is produced in CVT owing to increased pressure in the postcapillary venules and opening of tight junctions. The development of reversible vasogenic edema with elevated diffusion due to increased intravascular pressure and the development of leaky vessels has also been observed with eclampsia and other posterior leukoencephalopathies (4, 31).
Lesions characterized by decreased diffusion that showed no abnormality on follow-up images were identified in three patients with seizure activity, possibly due to cytotoxic edema. Of note, the patients’ imaging findings were location-appropriate for the venous thrombosis, seizure activity, and symptoms. The ADC values in these lesions were similar to the ADC values in lesions with initially decreased ADC that persisted. The decreased ADC values in these patients may have resulted from the seizure activity. Animal and human studies have demonstrated decreased ADC values in cortical and white matter lesions in subjects with status epilepticus (32). The reported ADC values were not significantly different from those reported with acute stroke (21). The pathophysiology for decreased ADCs in epilepsy is not completely clear. Wang et al (33) reported an increase in sodium concentration in rat pyriform cortex during status epilepticus. They suggested that this might result from energy failure of the Na+/K+-ATPase pump, and consequent Na+ and water influx. Markedly increased release of excitatory amino acids (34, 35) and increased membrane ion permeability (36) are other mechanisms that may cause cytotoxic edema during status epilepticus. Whatever the mechanisms, reversible decreased diffusion in patients with seizures has been reported (37).
Alternatively, reversibility of ADC values in these three patients could have been unrelated to the seizures. Based on an animal model of CVT in rats, Rother et al (23) noted that an initially decreased ADC was followed by an increased ADC in some parenchymal lesions. Furthermore, there was an initial increase in lesion volume up to 5 hours followed by a decrease in lesion volume up to 48 hours. They hypothesize that the major pathophysiologic event in the first 1–2 hours is cytotoxic edema. Cytotoxic edema is produced in CVT when increased venous pressure leads to increased intracranial pressure, decreased capillary perfusion pressure, and severely decreased cerebral blood flow. The resultant blood-brain barrier disruption leads to increased extracellular water, rising ADC values, and increasing lesion volumes. Subsequently, recanalization of thrombosed veins or improvement of collateral drainage and recovering metabolism lead to a decrease in lesion volume (23). Thus, while cytotoxic edema associated with acute arterial stroke is usually irreversible, cytotoxic edema associated with CVT (38) may be reversible if the blood drains through collateral pathways (26). Furthermore, in the setting of cytotoxic edema associated with acute stroke, reversibility of DW imaging abnormalities has been demonstrated in the setting of early reperfusion (39).
Five lesions characterized by decreased diffusion that showed abnormality on follow-up images were identified. These lesions likely represented persistent cytotoxic edema followed by tissue infarction. In these cases, there was likely severely decreased blood flow without enough collateral blood drainage to maintain adequate perfusion. While Manzione et al (25) suggested that there may be quantitative differences in ADC values between tissue that progresses to infarction and tissue that remains viable in CVT, we were not able to demonstrate differences between tissue with an initially decreased ADC that appeared abnormal on follow-up images compared with tissue with an initially decreased ADC that appeared normal on follow-up images. Although there are differences between the pathophysiologies, and perhaps the DW imaging results of arterial and venous infarct, it seems prudent to discuss the potentially relevant arterial infarct literature. In arterial stroke, whereas some studies suggest a threshold ADC ratio of approximately 0.8 (unitless; ipsilateral abnormal-appearing brain ADC divided by contralateral normal-appearing brain ADC), other studies demonstrate tissue characterized by ADC ratios of much lower than 0.8 that appears normal on follow-up (40). Authors of these arterial studies suggest that ADC normalization associated with tissue viability depends on the duration and severity of ischemia rather than the absolute value. It has been shown that degree of ADC decrease in arterial infarct correlates with degree of cerebral blood flow decrease (41), and that the cerebral blood flow threshold for tissue viability increases with increasing occlusion time (42).
Because initial DW images in combination with the history of seizure can suggest lesion outcome on follow-up images, we speculate that they may be important in determining patient outcome. Although we did not compare diffusion MR imaging findings with outcome scales, we did observe the following. Two patients without seizures (patients 1 and 12) who had multiple lesions characterized by decreased diffusion, died. Three patients without seizures (patients 8, 10, and 11) with lesions characterized by elevated diffusion and decreased diffusion, had persistent deficits. Four patients (patients 3, 4, 7, and 13) with elevated diffusion with or without hemorrhage in cortex or subcortical white matter, had complete or near complete resolution of symptoms on follow-up. Two patients (patients 2 and 9) with decreased diffusion in subcortical white matter and seizures had complete or near complete resolution of symptoms. One patient with seizures (patient 6) who had lesions with both elevated and decreased diffusion had resolution of symptoms.
Our study has limitations. Patients without T2 or ADC abnormalities at initial imaging were not included in the retrospective cohort, and the potential exclusion of patients with initial normal examinations and subsequent adverse outcome could theoretically introduce selection bias. However, we are not aware of any patients who developed subsequent abnormalities as described in the retrospective cohort despite an initial normal examination. The small size of the patient retrospective cohort may introduce bias. Furthermore, routine clinical management including decisions on timing of imaging studies, was not altered for the purposes of this investigation. Thus, time of initial and follow-up imaging was variable, and follow-up imaging included CT or MR imaging. Infarcts are known to undergo evolution of signal intensity that may become normal appearing with some sequences (fogging), and imaging during these periods could have theoretically introduced bias; however, not all sequences are typically normal during fogging, and we evaluated all follow-up images available to reduce these potential biases. Follow-up images were not available for three patients, and in one patient only CT follow-up was available; potential bias could be introduced in this manner by selection and/or by comparing MR to CT results. We have attempted to minimize this potential bias. Images were not coregistered. In complex cases, where regions of decreased and increased diffusion were adjacent to each other, it is possible that our assessment of lesion outcome was not completely accurate. For example, portions of lesions with elevated diffusion may have progressed to infarction, while portions of lesions with decreased diffusion in patients without seizures may have resolved. Due to the retrospective nature of the study, we were unable to assess clinical outcome scales. T2* (susceptibility) sequences were not universally performed at the time of the patients’ imaging. Petechial hemorrhage and subsequent resultant susceptibility effect could adversely affect ADC calculations; however, we believe that this is not a large weakness as we did not measure ADC values in regions of hemorrhage identified through all conventional sequences, DW imaging, ADC, and low-b-value maps, when available. Furthermore, the ADC values would potentially be decreased and possibly noncalculable, which are findings that were not observed.
Conclusion
DW MR imaging in combination with clinical history of seizure identified three parenchymal lesion types in patients with CVT: lesions with elevated diffusion, most consistent with vasogenic edema, that resolved; lesions with low diffusion, most consistent with cytotoxic edema in patients without seizure activity, that persisted; and lesions with low diffusion in patients with seizure activity, that resolved. This information may be important in prospectively determining the severity of irreversible injury, in the evaluation of new therapeutic agents, in the determination of prognosis, and in patient management.
References
- 1.Ameri A, Bousser MG. Cerebral venous thrombosis. Neurol Clin 1992;10:87–111 [PubMed] [Google Scholar]
- 2.Tsai FY, Wang AM, Matovich VB, et al. MR staging of acute dural sinus thrombosis: correlation with venous pressure measurements and implications for treatment and prognosis. AJNR Am J Neuroradiol 1995;16:1021–1029 [PMC free article] [PubMed] [Google Scholar]
- 3.Jacobs K, Moulin T, Bogousslavsky J, et al. The stroke syndrome of cortical vein thrombosis. Neurology 1996;47:376–382 [DOI] [PubMed] [Google Scholar]
- 4.Schaefer PW, Buonanno FS, Gonzalez RG, Schwamm LH. Diffusion-weighted imaging discriminates between cytotoxic and vasogenic edema in a patient with eclampsia. Stroke 1997;28:1082–1085 [DOI] [PubMed] [Google Scholar]
- 5.Bianchi D, Maeder P, Bogousslavsky J, Schnyder P, Meuli RA. Diagnosis of cerebral venous thrombosis with routine magnetic resonance: an update. Eur Neurol 1998;40:179–190 [DOI] [PubMed] [Google Scholar]
- 6.Hsu LC, Lirng JF, Fuh JL, Wang SJ, Shyu HY, Liu HC. Proton magnetic resonance spectroscopy in deep cerebral venous thrombosis. Clin Neurol Neurosurg 1998;100:27–30 [DOI] [PubMed] [Google Scholar]
- 7.Keller E, Flacke S, Urbach H, Schild HH. Diffusion- and perfusion-weighted magnetic resonance imaging in deep cerebral venous thrombosis. Stroke 1999;30:1144–1146 [DOI] [PubMed] [Google Scholar]
- 8.Yuh WT, Simonson TM, Wang AM, et al. Venous sinus occlusive disease: MR findings. AJNR Am J Neuroradiol 1994;15:309–316 [PMC free article] [PubMed] [Google Scholar]
- 9.Dormont D, Anxionnat R, Evrard S, Louaille C, Chiras J, Marsault C. MRI in cerebral venous thrombosis. J Neuroradiol 1994;21:81–99 [PubMed] [Google Scholar]
- 10.Hickey WF, Garnick MB, Henderson IC, Dawson DM. Primary cerebral venous thrombosis in patients with cancer: a rarely diagnosed paraneoplastic syndrome. Report of three cases and review of the literature. Am J Med 1982;73:740–750 [DOI] [PubMed] [Google Scholar]
- 11.Daif A, Awada A, al-Rajeh S, et al. Cerebral venous thrombosis in adults: a study of 40 cases from Saudi Arabia. Stroke 1995;26:1193–1195 [DOI] [PubMed] [Google Scholar]
- 12.Crawford SC, Digre KB, Palmer CA, Bell DA, Osborn AG. Thrombosis of the deep venous drainage of the brain in adults: analysis of seven cases with review of the literature. Arch Neurol 1995;52:1101–1108 [DOI] [PubMed] [Google Scholar]
- 13.Villringer A, Einhaupl KM. Dural sinus and cerebral venous thrombosis. New Horiz 1997;5:332–341 [PubMed] [Google Scholar]
- 14.Ito K, Tsugane R, Ikeda A, Suzuki Y, Sato K. Cerebral hemodynamics and histological changes following acute cerebral venous occlusion in cats. Tokai J Exp Clin Med 1997;22:83–93 [PubMed] [Google Scholar]
- 15.Lefebvre P, Lierneux B, Lenaerts L, et al. Cerebral venous thrombosis and procoagulant factors: a case study. Angiology 1998;49:563–571 [DOI] [PubMed] [Google Scholar]
- 16.Vielhaber H, Ehrenforth S, Koch HG, Scharrer I, van der Werf N, Nowak-Gottl U. Cerebral venous sinus thrombosis in infancy and childhood: role of genetic and acquired risk factors of thrombophilia. Eur J Pediatr 1998;157:555–560 [DOI] [PubMed] [Google Scholar]
- 17.Nagai S, Horie Y, Akai T, Takeda S, Takaku A. Superior sagittal sinus thrombosis associated with primary antiphospholipid syndrome: case report. Neurol Med Chir (Tokyo) 1998;38:34–39 [DOI] [PubMed] [Google Scholar]
- 18.van den Berg JS, Boerman RH, vd Stolpe A, Kremer HP. Cerebral venous thrombosis: recurrence with fatal course [letter]. J Neurol 1999;246:144–146 [DOI] [PubMed] [Google Scholar]
- 19.Allroggen H, Abbott RJ. Cerebral venous sinus thrombosis. Postgrad Med J 2000;76:12–15 [DOI] [PMC free article] [PubMed] [Google Scholar]
- 20.Forbes KP, Pipe JG, Heiserman JE. Evidence for cytotoxic edema in the pathogenesis of cerebral venous infarction. AJNR Am J Neuroradiol 2001;22:450–455 [PMC free article] [PubMed] [Google Scholar]
- 21.Schaefer PW, Grant PE, Gonzalez RG. Diffusion-weighted MR imaging of the brain. Radiology 2000;217:331–345 [DOI] [PubMed] [Google Scholar]
- 22.Albers GW. Diffusion-weighted MRI for evaluation of acute stroke. Neurology 1998;51:S47–49 [DOI] [PubMed] [Google Scholar]
- 23.Rother J, Waggie K, van Bruggen N, de Crespigny AJ, Moseley ME. Experimental cerebral venous thrombosis: evaluation using magnetic resonance imaging. J Cereb Blood Flow Metab 1996;16:1353–1361 [DOI] [PubMed] [Google Scholar]
- 24.Corvol JC, Oppenheim C, Manai R, et al. Diffusion-weighted magnetic resonance imaging in a case of cerebral venous thrombosis. Stroke 1998;29:2649–2652 [DOI] [PubMed] [Google Scholar]
- 25.Manzione J, Newman GC, Shapiro A, Santo-Ocampo R. Diffusion- and perfusion-weighted MR imaging of dural sinus thrombosis. AJNR Am J Neuroradiol 2000;21:68–73 [PMC free article] [PubMed] [Google Scholar]
- 26.Ducreux D, Oppenheim C, Vandamme X, et al. Diffusion-weighted imaging patterns of brain damage associated with cerebral venous thrombosis. AJNR Am J Neuroradiol 2001;22:261–268 [PMC free article] [PubMed] [Google Scholar]
- 27.Chu K, Kang DW, Yoon BW, Roh JK. Diffusion-weighted magnetic resonance in cerebral venous thrombosis. Arch Neurol 2001;58:1569–1576 [DOI] [PubMed] [Google Scholar]
- 28.Sorensen AG, Buonanno FS, Gonzalez RG, et al. Hyperacute stroke: evaluation with combined multisection diffusion- weighted and hemodynamically weighted echo-planar MR imaging. Radiology 1996;199:391–401 [DOI] [PubMed] [Google Scholar]
- 29.Sorensen AG, Copen WA, Ostergaard L, et al. Hyperacute stroke: simultaneous measurement of relative cerebral blood volume, relative cerebral blood flow, and mean tissue transit time. Radiology 1999;210:519–527 [DOI] [PubMed] [Google Scholar]
- 30.Maldjian JA, Listerud J, Moonis G, Siddiqi F. Computing diffusion rates in T2-dark hematomas and areas of low T2 signal. AJNR Am J Neuroradiol 2001;22:112–118 [PMC free article] [PubMed] [Google Scholar]
- 31.Ay H, Buonanno FS, Schaefer PW, et al. Posterior leukoencephalopathy without severe hypertension: utility of diffusion-weighted MRI. Neurology 1998;51:1369–1376 [DOI] [PubMed] [Google Scholar]
- 32.Lansberg MG, O’Brien MW, Norbash AM, Moseley ME, Morrell M, Albers GW. MRI abnormalities associated with partial status epilepticus. Neurology 1999;52:1021–1027 [DOI] [PubMed] [Google Scholar]
- 33.Wang Y, Majors A, Najm I, et al. Postictal alteration of sodium content and apparent diffusion coefficient in epileptic rat brain induced by kainic acid. Epilepsia 1996;37:1000–1006 [DOI] [PubMed] [Google Scholar]
- 34.Sloviter RS, Dempster DW. “Epileptic” brain damage is replicated qualitatively in the rat hippocampus by central injection of glutamate or aspartate but not by GABA or acetylcholine. Brain Res Bull 1985;15:39–60 [DOI] [PubMed] [Google Scholar]
- 35.Olney JW. Excitatory transmitters and epilepsy-related brain damage. Int Rev Neurobiol 1985;27:337–362 [DOI] [PubMed] [Google Scholar]
- 36.McNamara JO. Cellular and molecular basis of epilepsy. J Neurosci 1994;14:3413–3425 [DOI] [PMC free article] [PubMed] [Google Scholar]
- 37.Kassem-Moussa H, Provenzale JM, Petrella JR, Lewis DV. Early diffusion-weighted MR imaging abnormalities in sustained seizure activity. AJR Am J Roentgenol 2000;174:1304–1306 [DOI] [PubMed] [Google Scholar]
- 38.Chu K, Kang DW, Kim JY, Chang KH, Lee SK. Diffusion-weighted magnetic resonance imaging in nonconvulsive status epilepticus. Arch Neurol 2001;58:993–998 [DOI] [PubMed] [Google Scholar]
- 39.Kidwell CS, Alger JR, Di Salle F, et al. Diffusion MRI in patients with transient ischemic attacks. Stroke 1999;30:1174–1180 [DOI] [PubMed] [Google Scholar]
- 40.Fiehler J, Foth M, Kucinski T, et al. Severe ADC decreases do not predict irreversible tissue damage in humans. Stroke 2002;33:79–86 [DOI] [PubMed] [Google Scholar]
- 41.Lin W, Lee JM, Lee YZ, Vo KD, Pilgram T, Hsu CY. Temporal relationship between apparent diffusion coefficient and absolute measurements of cerebral blood flow in acute stroke patients. Stroke 2003;34:64–70 [DOI] [PubMed] [Google Scholar]
- 42.Jones TH, Morawetz RB, Crowell RM, et al. Thresholds of focal cerebral ischemia in awake monkeys. J Neurosurg 1981;54:773–782 [DOI] [PubMed] [Google Scholar]