

Abstract
BACKGROUND AND PURPOSE: For adequate interpretation of diffusion tensor imaging (DTI) parameters empirical distribution characteristics, precision, and reproducibility should be known. The present study investigated distribution and reliability parameters of hippocampal fractional anisotropy (FA) and mean diffusivity (MD).
METHODS: FA and MD values were averaged in hippocampal regions of interest in 20 subjects (10 women and 10 men; age range, 25–69 years). Regions of interest were manually placed bilaterally by one investigator at 2 occasions, and by a second independent investigator. Sample distributions of FA and MD values were compared with normal distributions. Intraclass coefficients (ICCs), standard errors of measurement (SEMs), and coefficients of variation (CVs) with confidence intervals (CI95s) were computed.
RESULTS: The results did not show any deviation of averaged FA (0.237 ± 0.017) and MD (775 ± 28 μm2/s) values from normal distribution. Intraobserver reliability (ICC ≥ 0.90) and precision (CV ≤ 3.5%) were high for all measures. Interobserver reliability reached values of ICC ≥ 0.84 and CV ≤ 4.1%. FA yielded lower precision (CV 2.2–4.1%) than MD (CV 1.3–2.5%), CI95s were around ±0.015–0.020 and ±25–30 μm2/s for FA and MD, respectively. FA differences of 0.020–0.030 and MD differences of 40–50 μm2/s can be assumed to reflect reliably distinct values in hippocampal regions.
CONCLUSION: The results are in line with previous reports on reliability of DTI measures by using different designs and methodology. Notwithstanding the difficulties associated with region of interest–derived DTI measurements in hippocampal regions, the present approach provides estimates of distribution characteristics and precision applicable to routine assessments of DTI parameters in clinical and research context.
Diffusion tensor imaging (DTI) is becoming increasingly important for investigating ultrastructural properties of brain tissues. DTI can provide objective quantified information complementary to and partially independent of that of conventional MR imaging.1 The validity of DTI as a more sensitive measure of subtle ultrastructural changes in normal-appearing white matter has been repeatedly demonstrated.2–4 An established method for investigation of specific brain regions is to place areas of voxels manually in anatomically defined regions of interest and to analyze averaged parameter estimates corresponding to these regions of interest subsequently. DTI provides statistical estimates of second-order diffusion tensors of water in each voxel within an imaging volume.5 The most widely used DTI parameters are mean diffusivity (MD; equal to one third of the trace D of the diffusion tensor), as a measure of the average motion of water molecules independent of tissue directionality, and fractional anisotropy (FA), which reflects the degree of alignment of cellular structures within fiber tracts, as well as their structural integrity.6 MD is supposed to be mainly affected by cellular size, integrity, and myelination,7, 8 whereas FA is indicative of fiber integrity and alignment.
With regard to reliability of DTI measures, the stability of equipment parameters and experimental conditions is of great importance, and multiple other factors are known to impair DTI data quality on different levels.9 The precision of measurement comprises constructs like the coefficient of variation (CV) and standard errors of measurement (SEMs), which can be used to tell the researcher or clinician whether DTI value differences of a particular size are assumed to occur by chance or whether a difference is assumed to reflect a “true” distinction. By using nonparametric bootstrap methodology, several influencing factors (eg, artificial noising, motion, and sex) on the data quality of DTI measures were detected.10 In 15 healthy subjects, these authors showed that FA (CV 0.15 ± 0.01) was clearly less reliable than MD (CV 0.09 ± 0.04) in white matter regions. Another study in 10 healthy subjects investigated the within-scanner and between-scanner reliability of FA and trace values (D = MD × 3) on 3 levels (voxel-by-voxel, section-by-section, and single-region)11 and obtained high within-scanner reproducibility (CV: FA 1.9%, D 2.6%), but substantially higher CVs (FA 4.5%, D 7.5%) across scanners for single-region analysis (corpus callosum). In a reproducibility study of fiber tractography by using DTI parameters, intraobserver, interobserver, and retest reliability estimates (CV) for FA and volume measures were reported.12 Intraobserver CV based on the replication of region of interest placement by the same investigator (no rescan) in different brain areas in 6 MR images after 3 weeks yielded CV values for averaged FA measures (white matter pathways) ranging from 1.2% (optic radiation) to 2.9% (callosal fibers), whereas interobserver and retest CV values were slightly higher (2.6%–7.1%).12 In all cited studies, coefficients of variation (ie, SDs related to the mean) were in the range of 1%–10% for MD and FA values.
Pragmatic approaches to estimate the magnitude and clinical importance of measurement errors of DTI assessments are nonetheless widely lacking. When group means of MD and FA are compared (eg, between patients and healthy controls), the sample distribution characteristics and precision of averaged DTI measures under routine conditions should be known. Not only to apply parametric tests, but also for an appropriate interpretation of arithmetic means, standard deviations, and conventional confidence interval (CI95) estimates,13, 14 data should not significantly deviate from Gaussian distribution. Whereas whole-brain FA and MD histograms of single individuals and groups of healthy controls seem to follow normal distributions in gray and white matter,10, 15 the sample distribution characteristics of region of interest–based DTI measures have not been investigated yet. Despite the assumption that means of any distributions will be normally distributed according to the central limit theorem for n → ∞, in commonly used sample sizes of 10–20 subjects this issue has to be tested empirically.13 To estimate parameters of precision (SEM, CV), a design with repeated assessments in the same subjects should preferably be used,16 and to provide a valid estimate of precision for cross-sectional analyses, most of the experimental conditions should be kept as stable as possible. Therefore, the following pragmatic issues have been addressed in the present study: (1) analysis of the sample distribution of region of interest–derived DTI parameters (FA, MD) with regard to normal distribution assumptions (it is hypothesized that sample distributions of DTI parameters are not substantially violating normality assumptions); (2) intra- and interobserver reproducibility of DTI parameters under standard conditions (replication of region of interest placement by the same investigator and by an independent second investigator); and (3) precision of DTI measures (ie, calculation of appropriate SEMs and CI95s of DTI parameters [FA, MD]).
Regions of interest in hippocampal regions have been chosen for the present analyses, because the hippocampus represents a critical region with regard to both functional implications in a broad area of neuropsychiatric diseases and methodologic aspects.
Methods
Subjects and Design
For the present methodologic analyses, data of 10 healthy subjects and 10 patients who participated in a project on Fabry disease (FD) were analyzed. FD is a rare hereditary lysosomal storage disorder (α-galactosidase A deficiency) potentially leading to multiple organ manifestations, including the central nervous system. In an ongoing study, young FD patients were investigated with a comprehensive neuropsychiatric test battery, and with conventional MR imaging and DTI scans. Results from the FD project will be published in detail elsewhere. Before inclusion, all subjects gave written informed consent, and the study was approved by the local ethics committee. All subjects underwent extensive clinical examination before the study; patients with substantial medical illness or significant white matter lesions in conventional MR images were excluded from the present analyses.
To estimate the intraobserver stability of region of interest-based MR imaging–derived DTI parameters (FA and MD) in hippocampal regions, DTI analyses (see below) were replicated by the same investigator blinded to the individual subjects’ data. For that purpose, by using the same images (no rescan), individual region of interest placement was carried out by one investigator 4–7 days after the first assessment, and average DTI parameters were calculated for each region of interest. The 2 region of interest placements were conducted independently from each other (ie, information concerning the first placement was not accessible at the second time, and the investigator was blinded regarding all other clinical data). To calculate interobserver variability, region of interest placement and DTI parameter computation was accomplished by a second independent investigator.
MR Imaging Data Acquisition
All data were obtained on a 1.5T system with gradients of 40 mT/m (Magnetom Sonata; Siemens, Munich, Germany). Apart from the acquisition of routine T1- (TR/TE, 600 milliseconds/25 milliseconds; matrix, 256 × 256) and PD/T2-weighted (TR/TE1/TE2, 4500 milliseconds/15 milliseconds,100 milliseconds; matrix, 256 × 256) images and 3D-magnetization-preparation rapid gradient echo (TR/TE, 1900 milliseconds/16 milliseconds; matrix, 512 × 512) datasets, we used a transversal diffusion-weighted single-shot spin-echo echo-planar based sequence with gradients along 6 noncollinear directions (TR/TE, 8000 milliseconds/105 milliseconds; b = 0 and 1000 seconds/mm2; matrix, 128 × 128; section thickness, 3 mm, without separation factor; voxel size, 1.8 × 1.8 × 3.0 mm; and 6 averages). All transversal sections were arranged parallel to the AC-PC line (anteroposterior commissure).
DTI Data Postprocessing
The MR-DTI datasets were transferred to a Linux x86 workstation for postprocessing. The diffusion tensors were computed by using an in-house-developed software, according to the method of Basser et al.7 For the decomposition of the diffusion tensor (D) in an eigensystem, our software used the symmetric bidiagonalization followed by QR-reduction routine implemented in the GNU/Linux Scientific Library (GSL).17 Mean diffusivity (MD) is the mean of the diffusion tensor eigenvalues,
 |
1) |
and is given in micrometers squared per second. FA is the SD of eigenvalues from the MD normalized by square norm of eigenvalues7:
 |
2) |
Both indices were plotted voxel by voxel as MD and FA index maps. In the FA maps, the voxel values are equal to FA × 103. To place the rectangular regions of interest and to determine regional index values, we used the software Image-J version 1.30v (Wayne Rasband, National Institutes of Health, Bethesda, Md). Regions of interest were placed individually for all patients and control subjects by one experienced investigator in the hippocampal region bilaterally (Fig 1).
Fig 1.
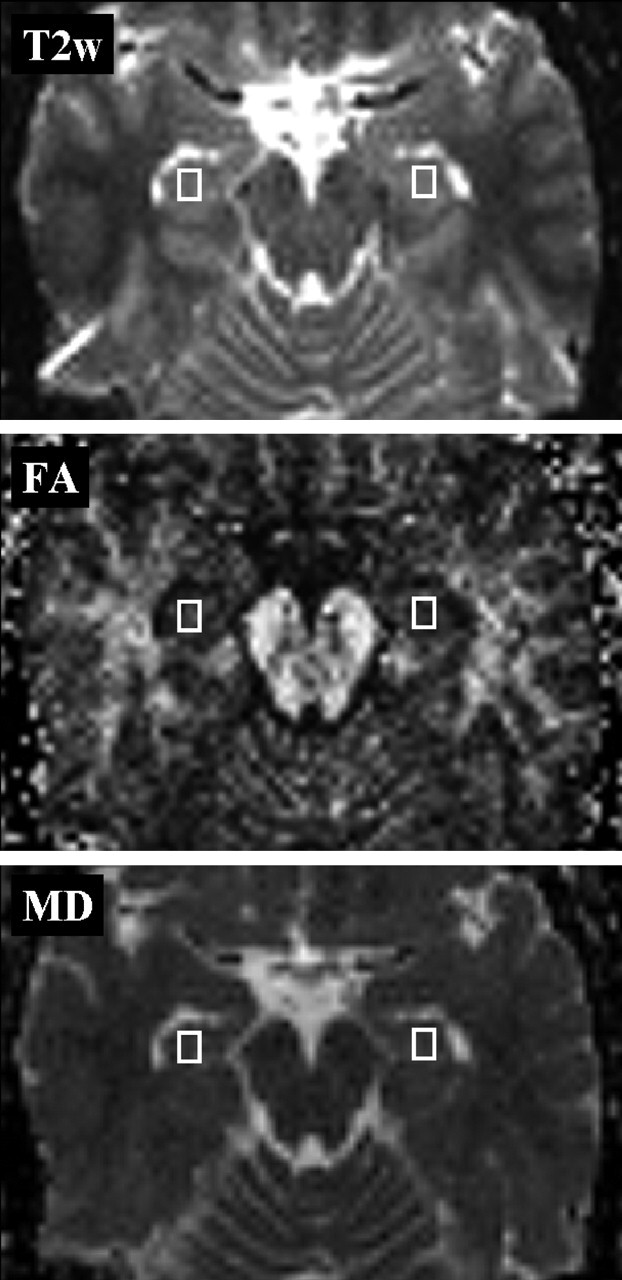
Placement of regions of interest. Regions of interest (5.4 × 7.2 × 3.0 mm) for the measurement of hippocampal FA (middle) and MD (bottom) values. The T2-weighted image (top, b = 0 s/mm2) was used as an anatomic reference.
To obtain standardized conditions for analysis and to avoid contamination especially by susceptibility artifacts, the largest region of interest size (3 × 4 pixels) was applied that did not extend in any case into adjacent structures (eg, CSF or white matter lesions).
Statistical Analysis
As described above, mean MD and FA values were computed for left and right hippocampal regions separately, and for averaged regions. Means, SDs, skewness (asymmetry of the distribution), and kurtosis (shape of the distribution), as well as median values and ranges, were calculated. To compare empirical distributions with Gaussian distributions, the D’Agostino-Pearson omnibus test was applied.18, 19 This test makes use of the skewness and kurtosis of the data and then calculates how far each of these values differs from the value expected with a Gaussian distribution and computes a single P value from the sum of the squares of these discrepancies. Unlike the Shapiro-Wilk test, this test is not affected if the data contain identical values, and it is appropriate in contrast to Kolmogorov-Smirnov-Lilliefors tests if the empirical distribution is unknown.19
The following statistics were used to compare first and second assessments of the first investigator (intraobserver variability) and to compare the first assessments of 2 independent investigators (interobserver variability): paired t tests to analyze the stability of individual parameter levels, Pearson’s and Spearman’s correlation coefficients to assess the shared variance (r2), and the rank stability (rs) of repeated assessments. Because Pearson and Spearman correlation coefficients are rather inadequate for reliability estimates in repeated measurement-designs,20 intraclass-correlation coefficients (ICCs) were computed to account for intra- and interindividual agreement.21, 22 According to the classification of Shrout and Fleiss,21 intraobserver agreement represents “case3” (ICC[3,2])—ie, each target (subject) was evaluated by a single investigator on 2 occasions, which were the only judgments of interest. Assessment of interobserver agreement corresponds to “case2” (ICC[2,1])—ie, all subjects were assessed once by 2 investigators, who are assumed to be a random subset of all possible investigators.21
Estimation of the SEM was based on the individual within subject variance (WSV) from repeated assessments (intra- and interobserver variability): SEMWSV = √(mean WSV).16 This approach calculates the individual variance of repeated measurements for each subject and is preferred if within-subject changes are not correlated with the mean.16, 20, 23 On the basis of SEM, coefficients of variation (CVs) were calculated: CVWSV = √(mean WSV/sample mean squared). Finally, 95% confidence intervals (CI95) for true values of single assessments (CI95 = mean ± 1.96 × SEMWSV) and values of repeatability (R95 = √two × 1.96 × SEMWSV) were computed.14 The difference between 2 measurements for the same subject is expected to be less than the repeatability value (R95) for 95% of pairs of observations.16
Results
Data from 10 healthy subjects (5 men and 5 women; mean age, 32.7 ± 7.0 years) and 10 patients with FD (5 men and 5 women; mean age, 40.7 ± 13.3 years) were analyzed. MD and FA values were determined for left and right hippocampal regions separately, and for averaged regions. Age ranged from 25 to 69 years and was not significantly different between men and women. No significant correlation emerged between age and FA or MD values (Pearson and Spearman correlation coefficients; all P values >.10).
Distribution Characteristics
Table 1 depicts descriptive statistics and distribution characteristics of the first and second bilateral assessments of hippocampal FA and MD values derived from one investigator.
Table 1:
DTI Parameters and distribution characteristics (n = 20)
| Mean ± SD (CI 95%) |
Median (Range) |
Skewness (P Value) Kurtosis (P Value) |
D’AP Test for Non-normality |
|||||
|---|---|---|---|---|---|---|---|---|
| 1st | 2nd | 1st | 2nd | 1st | 2nd | 1st | 2nd | |
| FA left | 247 ± 26(235–259) | 245 ± 27(232–257) | 249(195–298) | 251(176–287) | −0.16 (.74)−0.44 (.50) | −0.75 (.14)0.78 (.34) | P = .76 | P = .21 |
| FA right | 228 ± 20(219–238) | 229 ± 20(219–238) | 225(189–262) | 227(201–262) | 0.12 (.81)−0.81 (.33) | 0.12 (.81)−1.36 (.17) | P = .60 | P = .39 |
| FA mean | 238 ± 16(230–245) | 237 ± 19(228–246) | 239(201–266) | 237(195–268) | −0.28 (.57) 0.15 (.69) | −0.29 (.55)0.07 (.76) | P = .79 | P = .80 |
| MD left | 782 ± 46(760–803) | 781 ± 35(765–798) | 793(717–857) | 790(729–835) | 0.02 (.97)−1.34 (.18) | −0.08 (.86)−1.24 (.20) | P = .41 | P = .43 |
| MD right | 769 ± 27(756–782) | 769 ± 24(758–780) | 779(709–805) | 770(732–817) | −0.50 (.31)−0.74 (.36) | 0.48 (.33)−0.08 (.75) | P = .39 | P = .59 |
| MD mean | 775 ± 30(761–790) | 775 ± 25(763–787) | 774(727–819) | 780(731–825) | −0.17 (.72)−1.21 (.21) | −0.04 (.93)−0.78 (.34) | P = .42 | P = .63 |
Note.— FA indicates fractional anisotropy (×103); MD, mean diffusivity (μm2/s); CI 95%, 95% confidence interval of mean; D’AP test, D’Agostino-Pearson test for deviation of an empirical frequency distribution from normal distribution (P < .05 indicating significant deviation).
The consistent agreement of mean and median values (Table 1) is indicative of symmetric distributions. Moreover, none of the skewness and kurtosis estimates and D’Agostino-Pearson tests was statistically significant (all P values > .10); thus, no substantial deviation from normal distribution was found for FA and MD values in normal-appearing hippocampal tissue. In Fig 3, the cumulative frequency distributions of pooled FA and MD values were compared with normal distributions based on empirical means and standard deviations. For that purpose 80 data points were used for each distribution by merging values of left and right hippocampus, and first and second assessments of one observer, respectively. No substantial deviation of empirically derived FA and MD distributions from normal distributions was yielded (D’Agostino-Pearson tests P > .30).
Fig 3.

Cumulative frequency distributions of pooled FA and MD values and comparison with Gaussian distributions. Figures represent the distribution of average DTI parameter values (MD, left; FA, right) for all the data (ie, data of left and right hippocampus) and of first and second assessment pooled for each subject (80 data points, n = 20). D’AP-test, D’Agostino-Pearson test for deviation from normality.
When the analyses were restricted to controls (n = 10, 40 data points), identical results were obtained. The distribution characteristics for FA values (mean = 229.6; SD = 24.0; median = 229.0; D’Agostino-Pearson test P = .66) and for MD values (mean = 787.1; SD = 25.6; median = 789.5; D’Agostino-Pearson test P = .44) did not reveal a substantial deviation from normal distribution and no significant differences between patients with FD and controls. In addition, no difference between male and female subjects was found (P > .10).
Intraobserver Variability
In Table 2, parameters of intraobserver reliability and precision for FA and MD values are shown. Figure 2 illustrates the highly concordant results of both assessments of a single investigator.
Table 2:
Intraobserver reliability and precision of hippocampal FA and MD values (n = 20)
| Mean ± SD | Diff ± SD | t value | r | rs | ICC | SEM | CI 95% | CV | R95 (%) | |
|---|---|---|---|---|---|---|---|---|---|---|
| FA left | 246 ± 26 | 2 ± 12 | 0.94 | .90 | .88 | .95 | 8.4 | ±16 | 3.5% | 23 (9.4%) |
| FA right | 229 ± 20 | −1 ± 9 | −0.38 | .91 | .89 | .95 | 6.0 | ±12 | 2.7% | 17 (7.3%) |
| FA mean | 237 ± 17 | 1 ± 8 | 0.51 | .91 | .88 | .95 | 5.3 | ±10 | 2.2% | 15 (6.2%) |
| MD left | 782 ± 40 | −1 ± 20 | 0.08 | .91 | .94 | .94 | 13.8 | ±27 | 1.8% | 38 (4.9%) |
| MD right | 769 ± 25 | 0 ± 16 | 0.08 | .82 | .81 | .90 | 10.9 | ±21 | 1.4% | 30 (3.9%) |
| MD mean | 775 ± 28 | 0 ± 14 | 0.10 | .88 | .85 | .93 | 9.9 | ±19 | 1.3% | 27 (3.5%) |
Note.— FA indicates fractional anisotropy (×103); MD, mean diffusivity (μm2/s); Mean, pooled mean (1st and 2nd assessment of one observer) ± pooled SD; Diff, difference of 1st–2nd assessment ± SD of difference; t value, corresponding to paired t test, all P values >0.20; r, Pearson correlation coefficient; rs, Spearman rank correlation coefficient; ICC, intraclass correlation coefficient; SEM, standard error of measurement based on within-subject variance; CI 95%, 95% confidence interval (±1.96 × SEM); CV = √(mean of within subject variance/mean squared); R95, repeatability according to Bland and Altman20; R95 = √2 × 1.96 × SEM; %, percentage of mean = R95/mean × 100.
Fig 2.

Correlation of first and second assessments of hippocampal FA and MD values. Data points are average DTI parameter values of the selected region of interest (n = 20). FA, fractional anisotropy [×103]; MD, mean diffusivity [μm2/s].
As shown in Table 1 and 2, first and second assessments of a single investigator were not significantly different (P > .20; difference between assessments <1%). Both assessments were highly correlated when conventional correlation coefficients were used (Fig 2 and Table 2, values for r and rs > 0.80). Intraclass correlation coefficients were even higher (all ICCs ≥ 0.90), which indicates high within-subject agreement. No significant correlation emerged between the difference scores (first–second assessment) and the magnitude of FA or MD mean values (all P values > .25). Thus, within-subject variances of individual assessments (WSV) were used to calculate SEMs and CVs,16, 20, 23 and estimates of CVWSV in the range of 1.3%–3.5% were yielded with corresponding 95% confidence intervals for FA and MD values (Table 2). The repeatability16 (ie, the estimated maximal difference for 95% of pairs of measurements for the same subject) reached values of 27–38 μm2/s for MD and 0.015–0.023 for FA. The values representing an intraobserver repeatability of 95% were <5% of mean MD values, and <10% of mean FA values.
When the analyses were confined only to control subjects (n = 10), very similar results were obtained (ICC 0.75–0.95; CV 1.3−4% to 1%; repeatability for FA 0.018–0.025; for MD 30–40 μm2/s).
Interobserver Variability
Interobserver reliability and precision parameters are shown in Table 3. Both investigators showed high agreement (r ≥ 0.75, rs ≥ 0.79) with ICC ≥ 0.88 for FA, and ICC ≥ 0.84 for MD values. Hippocampal FA and MD values derived from different investigators did not differ substantially (t tests, P > .10), and differences were not correlated with the magnitude of parameters (all P values > .20).
Table 3:
Interobserver reliability and precision of hippocampal FA and MD values (n = 20)
| 1st Investigator Mean ± SD (Range) | 2nd Investigator Mean ± SD (Range) | Diff ± SD | t value | r | rs | ICC | SEM | CI 95% | CV | R95 (%) | |
|---|---|---|---|---|---|---|---|---|---|---|---|
| FA left | 247 ± 26 | 243 ± 28 | 5 ± 13 | 1.58 | .89 | .87 | .93 | 9.5 | ±19 | 3.9% | 26 (10.8%) |
| (235–259) | (179–283) | ||||||||||
| FA right | 228 ± 20 | 230 ± 23 | −2 ± 14 | −0.63 | .78 | .86 | .88 | 10.1 | ±20 | 4.1% | 28 (12.2%) |
| (219–238) | (198–286) | ||||||||||
| FA mean | 238 ± 16 | 236 ± 20 | 1 ± 11 | 0.52 | .85 | .87 | .90 | 7.6 | ±15 | 3.1% | 21 (8.9%) |
| (230–245) | (195–279) | ||||||||||
| MD left | 782 ± 46 | 776 ± 28 | 5 ± 28 | .85 | .81 | .82 | .84 | 19.8 | ±39 | 2.5% | 55 (7.0%) |
| (760–803) | (728–821) | ||||||||||
| MD right | 769 ± 27 | 766 ± 23 | 3 ± 18 (25) | 0.68 | .75 | .79 | .85 | 12.9 | ±25 | 1.7% | 36 (4.6%) |
| (756–782) | (721–816) | ||||||||||
| MD mean | 775 ± 30) | 771 ± 23) | 4 ± 18 (27) | 1.02 | .81 | .90 | .87 | 12.7 | ±25 | 1.6% | 35 (.5%) |
| (761–790 | (733–817 |
Note.— FA indicates fractional anisotropy (×103); MD, mean diffusivity (μm2/s); Diff, difference of 1st assessment of first investigator (cf. Table 1, 1st column) and assessment of 2nd investigator ± SD of difference; t value, corresponding to paired t test, all P values >.10; r, Pearson correlation coefficient; rs, Spearman rank correlation coefficient; ICC, intraclass correlation coefficient; SEM, standard error of measurement based on within-subject variance; CI 95%, 95% confidence interval (±1.96 × SEM); CV = √(mean of within subject variance/mean squared); R95, repeatability according to Bland and Altman20: R95WSV = √2 × 1.96 × SEM; %, percentage of mean = R95/mean × 100.
CV estimates of interobserver variability were in the range of 1.6%–2.5% for MD and 3.1%–4.1% for FA values (Table 3). Repeatability16 yielded values of 35–55 μm2/s for MD and 0.021–0.028 for FA, respectively. The values indicating an interobserver repeatability of 95% were ≤7% of mean MD values and <12.5% of mean FA values (Table 3, last column).
Discussion
To the best of our knowledge, this is the first study investigating sample distribution properties, and aspects of intra- and interobserver reliability and precision of DTI measures from an applied and clinically pragmatic perspective. The aim of the present analysis was to compare the cumulative frequency distribution of FA and MD values of a selected brain region with normal distributions and to calculate appropriate estimates of SEMs.
According to our results from 20 subjects with double assessment of DTI values from the same scan, hippocampal FA and MD data evidently represented Gaussian distributions. On the assumption that repeated measures in the same subject are also subjected to random variation, we have pooled data from 20 subjects derived from 4 occasions (2 assessments by one investigator, left and right hippocampus), but separate analyses also did not reveal any deviation from normal distribution. We applied the D’Agostino-Pearson test for comparing empirical and theoretical distributions18 because this test is clearly superior to the conventionally used Kolmogorov-Smirnov test with or without Lilliefors correction, if population distribution characteristics are unknown, and to the Shapiro-Wilks test, if data with the same value (ties) are occurring.19 Although the distribution characteristics of DTI parameters in the population cannot be tested directly, our results provide no evidence that there are considerable deviations of empirically found hippocampal FA and MD values from normal distribution in rather small samples. Furthermore, absolute FA and MD values in hippocampal areas were within the range of other studies (FA, 0.170–0.300; MD, 700–850 μm2/s) derived from healthy subjects.6, 8, 15, 24
We assume that these findings can also be extrapolated to DTI data derived from other brain regions and allow for the use of parametric tests and other statistics based on normal distribution when analyzing DTI measures.13 The knowledge of distribution characteristics is essential for statistical modeling and calculation of parametric test statistics and confidence intervals.14
Whereas product-moment and rank correlation coefficients are not sufficiently appropriate for reliability estimates based on repeated measurement23 ICCs should be preferably used as reliability coefficients among evaluations that are assumed to be in the same category or class. ICCs are ratios of the variance due to different assessments, observers, or methods to total variance.21 Nevertheless, SEM estimates based on the pooled standard deviation (SEMICC) and corrected for a lack of reliability (√[1 − ICC])25, 26 should be replaced by SEM estimates on the basis of the within-subject variance (SEMWSV) whenever possible.16 Thus, we calculated ICC as indices of agreement, but preferred SEMWSV to calculate confidence intervals in the present analysis.
This conservative approach showed satisfactory intra- and interobserver precision of FA and MD measures (CV < 5%) corroborating results from other studies with different designs and methodology (CV range 1%–10%).10, 12, 15, 24 Regarding both intra- and interobserver agreement a nearly twofold higher unreliability for FA values (CV 3%–4%) than MD (CV 1%–2%) with respective confidence intervals was revealed. Nonetheless, intra- and interobserver repeatability of hippocampal MD and FA measures were highly satisfactory: a 95% probability of repeated assessments to fall within a range of 4%–7% (MD) and 6%–12% (FA) of mean values, which demonstrates the practical reliability of the technique and can assist the interpretation of other quantitative hippocampal DTI studies. In line with previous studies, interobserver precision was approximately one third lower than the precision of repeated assessments derived from a single observer.12 The superior reliability and robustness of MD measures found in the present analysis is also consistent with earlier findings10 and may correspond to general properties of MD. MD values represent the average of the 3 eigenvalues of the diffusion tensor and show a uniform distribution in healthy brain tissues, whereas FA values are displayed by distinct distributions in gray and white matter.24 When different parameters are compared between groups in the same experiment, it is recommended to base power and sample size calculations on the least reliable parameter.27 According to the present data, a difference (Δ) between 10 patients and 10 controls of approximately ΔFA = 0.030 (estimated SD = 0.020) and ΔMD = 40 μm2/s (estimated SD = 0.030 μm2/s), respectively, is required for statistical significance (α = 0.05; 1 − β = 0.80). Differences of such magnitude Δ correspond to 10%–15% of the FA mean, but only 5% of the MD mean of control subjects, respectively.
When interpreting the results of the present study, however, one has to be aware that placement of hippocampal region of interest was the only operator-dependent step and was therefore susceptible to unreliable variation, particularly due to varying partial volume artifacts. All other computations were carried out fully automated. Nevertheless, we chose hippocampal regions for reliability analyses because this region seems to be one of the most difficile and at the same time most critical when studying white matter changes in clinical samples.4, 28–31 We assume that our findings are thus balanced estimates of precision and reliability.
Conclusions
In summary, the results of the present analyses show that empirically derived DTI measures (FA and MD) can be supposed to be normally distributed and that coefficients of intra- and interobserver variation (CV) for FA and MD values are in the range of 1%–3% and 3%–5%, respectively. According to our data, differences in MD of at least 40–50 μm2/s, and in FA of at least 0.020–0.030 should be expected if variations are claimed to be nonrandom. The results underline the importance of reliability assessments12 and the high precision of established DTI measures.
References
- 1.Ramnani N, Behrens TE, Penny W, et al. New approaches for exploring anatomical and functional connectivity in the human brain. Biol Psychiatry 2004;56:613–19 [DOI] [PubMed] [Google Scholar]
- 2.Loevner LA, Grossman RI, Cohen JA, et al. Microscopic disease in normal-appearing white matter on conventional MR images in patients with multiple sclerosis: assessment with magnetization-transfer measurements. Radiology 1995;96:511–15 [DOI] [PubMed] [Google Scholar]
- 3.Tortorella C, Viti B, Bozzali M. A magnetization transfer histogram study of normal-appearing brain tissue in MS. Neurology 2000;54:186–93 [DOI] [PubMed] [Google Scholar]
- 4.Fellgiebel A, Wille P, Müller MJ, et al. Ultrastructural hippocampal and white matter alterations in mild cognitive impairment: a diffusion tensor imaging study. Dement Geriatr Cogn Disord 2004;18:101–08 [DOI] [PubMed] [Google Scholar]
- 5.Basser PJ, Pajevic S. A normal distribution for tensor-valued random variables: applications to diffusion tensor MRI. IEEE Trans Med Imaging 2003;22:785–94 [DOI] [PubMed] [Google Scholar]
- 6.Basser PJ, Pierpaoli C. Microstructural features measured using diffusion tensor imaging. J Magn Reson B 1996;111:209–19 [DOI] [PubMed] [Google Scholar]
- 7.Basser PJ, Mattiello J, Le Bihan D. Estimation of the effective self-diffusion tensor from the NMR spin-echo. J Magn Reson B 1994;103:247–54 [DOI] [PubMed] [Google Scholar]
- 8.Pierpaoli C, Jezzard P, Basser PJ, et al. Diffusion tensor MR imaging of the human brain. Radiology 1996;201:637–48 [DOI] [PubMed] [Google Scholar]
- 9.Basser PJ, Pajevic S. Statistical artifacts in diffusion tensor MRI (DT-MRI) caused by background noise. Magn Res Med 2000;44:41–50 [DOI] [PubMed] [Google Scholar]
- 10.Heim S, Hahn K, Sämann PG, et al. Assessing DTI data quality using bootstrap analysis. Magn Res Med 2004;52:582–89 [DOI] [PubMed] [Google Scholar]
- 11.Pfefferbaum A, Adalsteinsson E, Sullivan EV. Replicability of diffusion tensor imaging measurements of fractional anisotropy and trace in brain. J Magn Reson Imaging 2003;18:427–33 [DOI] [PubMed] [Google Scholar]
- 12.Ciccarelli O, Parker GJ, Toosy AT, et al. From diffusion tractography to quantitative white matter tract measures: a reproducibility study. Neuroimage 2003;18:348–59 [DOI] [PubMed] [Google Scholar]
- 13.Altman DG, Bland JM. Statistics notes: the normal distribution. BMJ 1995;310:298. [DOI] [PMC free article] [PubMed] [Google Scholar]
- 14.Altman DG, Bland JM. Confidence intervals illuminate absence of evidence. BMJ 2004;328:1016–17 [DOI] [PMC free article] [PubMed] [Google Scholar]
- 15.Cercignani M, Inglese M, Pagani E, et al. Mean diffusivity and fractional anisotropy histograms of patients with multiple sclerosis. AJNR Am J Neuroradiol 2001;22:952–58 [PMC free article] [PubMed] [Google Scholar]
- 16.Bland JM, Altman DG. Statistics notes: measurement error. BMJ 1996;313:744. [DOI] [PMC free article] [PubMed] [Google Scholar]
- 17.Galassi M, Davies J, Theiler J, et al. (eds.). GNU scientific library reference manual. 2nd ed. Bristol, UK: Network Theory;2003
- 18.D’Agostino RB, Pearson ES. Tests for departure from normality. Biometrika 1973;60:613–22 [Google Scholar]
- 19.D’Agostino RB, Stephens MA, eds. Goodness-of-fit techniques. New York: Dekker;1986
- 20.Bland JM, Altman DG. Statistics notes: measurement error proportional to the mean. BMJ 1996;313:106. [DOI] [PMC free article] [PubMed] [Google Scholar]
- 21.Shrout PE, Fleiss JL. Intraclass correlations: uses in assessing rater reliability. Psychol Bull 1979;86:420–28 [DOI] [PubMed] [Google Scholar]
- 22.Shrout PE. Measurement reliability and agreement in psychiatry. Stat Meth Med Res 1998;7:301–17 [DOI] [PubMed] [Google Scholar]
- 23.Bland JM, Altman DG. Statistics notes: measurement error and correlation coefficients. BMJ 1996;313:41–42 [DOI] [PMC free article] [PubMed] [Google Scholar]
- 24.Papadakis NG, Xing D, Houston GC, et al. A study of rotationally invariant and symmetric indices of diffusion anisotropy. Magn Reson Imaging 1999;17:881–92 [DOI] [PubMed] [Google Scholar]
- 25.Allen MJ, Yen WM. Introduction to measurement theory. Belmont, CA: Wadsworth;1979
- 26.Traub RE. Reliability for the social sciences: theory and applications. London: Sage;1994
- 27.Müller MJ, Szegedi A. Effects of interrater reliability of psychopathologic assessment on power and sample size calculations in clinical trials. J Clin Psychopharmacol 2002;22:318–25 [DOI] [PubMed] [Google Scholar]
- 28.Sandson TA, Felician O, Edelman RR, et al. Diffusion-weighted magnetic resonance imaging in Alzheimer’s disease. Dement Geriatr Cogn Disord 1999;10:166–71 [DOI] [PubMed] [Google Scholar]
- 29.Assaf BA, Mohamed FB, Abou-Khaled KJ, et al. Diffusion tensor imaging of the hippocampal formation in temporal lobe epilepsy. AJNR Am J Neuroradiol 2003;24:1857–62 [PMC free article] [PubMed] [Google Scholar]
- 30.Kalus P, Buri C, Slotboom J, et al. Volumetry and diffusion tensor imaging of hippocampal subregions in schizophrenia. Neuroreport 2004;15:867–71 [DOI] [PubMed] [Google Scholar]
- 31.Powell HW, Guye M, Parker GJ, et al. Noninvasive in vivo demonstration of the connections of the human parahippocampal gyrus. Neuroimage 2004;22:740–47 [DOI] [PubMed] [Google Scholar]