

Abstract
BACKGROUND AND PURPOSE: Proton (hydrogen-1 [1H]) MR spectroscopy is a useful diagnostic tool in many metabolic diseases, but only scattered and inconclusive data are available on mitochondrial diseases. We performed MR imaging and 1H MR spectroscopy of the brain in patients with different types of primary mitochondrial diseases to investigate the role of 1H MR spectroscopy in the clinical evaluation of these disorders.
METHODS: In 15 patients (11 adults, four children) with mitochondrial diseases, localized MR spectra were obtained at short TEs in cerebellar white matter, paratrigonal white matter, and parieto-occipital cortex that appeared normal on MR images. Additional spectra of basal ganglia and cortical gray matter structural lesions were obtained in three patients.
RESULTS: A significant choline reduction and N-acetylaspartate reduction were found in areas that appeared normal on MR images. Lactate was never found in areas that appeared normal on MR images, except in two children in whom MR studies were performed during episodes of symptom exacerbation and revealed elevated lactate both in areas that appeared damaged on MR images and in normal-appearing areas. An additional abnormal signal at 0.9 ppm was found in a consistent number of studies.
CONCLUSION: 1H MR spectroscopy proved to be a useful investigational tool for mitochondrial diseases, as it enabled detection of metabolic abnormalities even in areas of brain that appeared normal on MR images, especially when it was performed during episodes of clinical relapses or clinical exacerbation.
Mitochondrial diseases with respiratory chain dysfunction are a wide group of clinical disorders that result from mutations in mitochondrial or nucleus-encoded OXPHOS subunit genes. Skeletal muscles and brain are the most commonly affected tissues mainly because their energy production strongly relies on mitochondrial oxidative phosphorylation. However, other organs and tissues such as heart, liver, kidney, and endocrine glands may also be involved. Different syndromes have been described on the basis of the type of primary or nucleus-driven mitochondrial DNA (mtDNA) mutation, but in most cases the consequent biochemical defect is not related to a single clinical manifestation. Diagnosis is often a challenge, based on a multidisciplinary approach that uses clinical, biochemical, neuroradiologic, and genetic data (1–3).
In this context, proton (hydrogen-1 [1H]) MR spectroscopy, which allows in vivo investigation of brain metabolism, has enhanced interest in the clinical evaluation of mitochondrial diseases. The development of new software has made this kind of investigation simple to carry out. Also, it is reproducible and not time-consuming. Hence, MR spectroscopy is being used more frequently in clinics to complete conventional MR studies (4, 5).
1H MR spectroscopy has already proved a useful diagnostic tool in some hereditary and acquired brain metabolic disorders such as Canavan disease (6), brain creatine deficiency syndromes (7, 8), adrenoleukodystrophy (9), and hepatic encephalopathy (10). Many sets of patients with different types of mitochondrial diseases have been studied by using 1H MR spectroscopy. The most common metabolic brain abnormalities determined from these studies include a variable decrease in N-acetylaspartate (NAA) and accumulation of lactate (11–18). However, to our knowledge, the role of MR spectroscopy in the clinical assessment of mitochondrial diseases has not yet been fully defined.
We report the results of conventional brain MR imaging and single-voxel 1H MR spectroscopic studies performed in a sample of patients with different types of primary mitochondrial diseases. MR spectroscopy was purposely performed in areas that appeared normal on MR images. The objective of this study was to evaluate whether MR spectroscopy could provide additional information to support diagnostic suspicion of the disease, thereby justifying further biochemical and genetic examination aimed at obtaining a definite diagnosis.
Methods
Patient Selection and Clinical Laboratory Characterization
MR imaging and 1H MR spectroscopy were performed in 15 patients with mitochondrial diseases diagnosed on the basis of muscle biopsy and/or mtDNA analysis (time period, June 1997 to December 2000). The ethics committee of our institution approved the study, and all the patients or the parents, who had been informed in advance of the procedures to be carried out, signed an informed consent form.
The patient sample comprised 11 adults (four men, seven women; age range, 22–71 years) and four children (three boys, one girl; age range, 18 months to 11 years). Of the 11 adults, five showed a phenotype-genotype profile of sporadic or autosomal dominant progressive external ophthalmoplegia (PEO) (patients 1–5) and four (patients 6–9) had a clinically nonsyndromic encephalomyopathic disorder with multiple deletions of mtDNA. In the remaining two adults, two well-recognized syndromes were identified on the basis of the mtDNA mutation and the clinical picture: mitochondrial myopathy, encephalomyopathy, lactic acidosis, and strokelike episodes (MELAS) syndrome in patient 10 and Kearns-Sayre syndrome in patient 11. The mean interval between onset of symptoms and MR evaluation was 11.7 years (range, 3–21 years). Patients were in different degrees of clinical severity, but at the time of MR examination, their clinical impairment was stable. All except one of the adults underwent skeletal muscle biopsy from deltoid muscle, and molecular analysis of mtDNA was performed by Southern blot and, when necessary, by long polymerase chain reaction (19). In patient 3, a woman with ophthalmoplegia and a major psychiatric disorder, diagnosis was made on the basis of her family data, which showed the recurrence of autosomal dominantly inherited PEO with multiple mtDNA deletions.
Of the four children, patient 12 was affected by ophthalmoparesis and was a carrier of a matrilinear transmitted 5814 mtDNA point mutation detected on her lymphocytes. Her mother died at age 35 years due to a severe mitochondrial encephalopathy associated with the same mtDNA mutation detected in the muscle (20). Patients 13 and 15 had the genotype-phenotype diagnoses of neuropathy, ataxia, and retinitis pigmentosa (NARP) and MELAS, respectively. Patient 14 had Leigh syndrome with a biochemically detected reduction of complex II-III enzymatic activity in skeletal muscle. All the children except patient 12 were studied shortly after the sudden onset of neurologic disturbances principally consisting of ataxia (patient 13), marked hypotonia with failure to thrive (patient 14), and recurrent drug-resistant seizures (patient 15).
Details about clinical, muscle biopsy, and molecular genetic data are reported in Table 1.
TABLE 1:
Clinical features and laboratory characterization of patients with mitochondrial diseases
| Patient No. | Sex/Age (y) | Clinical Features | Muscle Biopsy | mtDNA | Diagnosis | Disease Duration (y) |
|---|---|---|---|---|---|---|
| 1 | M/26 | EO, Pt, T, D | No RRF, COX- | sd (7700bp) | PEO+ | 12 |
| 2 | F/56 | EO, Pt | RRF, COX- | md* | AD-PEO | 4 |
| 3 | F/37 | EO, Pt, Ps | n.p. | n.p. | AD-PEO | 7 |
| 4 | F/47 | W, EO, Pt | RRF, COX- | No mutation detected | PEO | 12 |
| 5 | F/71 | W, EO, Hy | RRF, COX- | sd (3500 bp) | PEO+ | 21 |
| 6 | F/58 | EO, A, Hy | RRF, COX- | md | EM | 3 |
| 7 | M/57 | A, S, Lip | RRF, COX- | md | EM | 14 |
| 8 | M/43 | W, Pt, D, P | RRF, COX- | md | EM | 13 |
| 9 | F/49 | EO, Pt, A | RRF, COX- | md | EM | 10 |
| 10 | F/22 | Pt, Se | RRF, COX- | pm 3243 | MELAS | 18 |
| 11 | M/29 | EO, Pt, W, A, Hy | RRF, COX- | sd (5500 bp) | KSS | 15 |
| 12 | F/11 | EO | n.p. | pm 5814 (lymphocytes) | PEO+ | 6 |
| 13 | M/2 | A, MR | n.p. | pm 8993 | NARP | 2 |
| 14 | M/18 mo | Hp, W | Co II-IIId† | n.p. | Leigh | 1 |
| 15 | M/6 | Se | n.p. | pm 3243 (lymphocytes) | MELAS | 10 mo |
Note.—A indicates ataxia; AD-PEO, autosomal dominant progressive external ophthalmoplegia; Co II-IIId, complex II-III deficiency; Cox-, citochrome oxidase negative fibers; D, diabetes; Dy, diplopia; EM, encephalomyopathy; EO, external ophthalmoplegia; Hp, hypotonia; Hy, hypoacusia; KSS, Kearns-Sayre syndrome; Lip, lipomatosis; md, multiple deletion; MELAS, mitochondrial myopathy, encephalopathy, lactic acidosis, and strokelike episodes; MR, mental retardation; n.p., not performed; NARP, neuropathy, ataxia, retinitis pigmentosa; P, parkinsonism; pd, point deletion; PEO, progressive external ophthalmoplegia; Ps, psychosis; Pt, eyelid ptosis; RRF, ragged red fibers; S, spasticity; sd, single deletion; Se, seizures; T, tremor; W, muscle weakness.
Detected in family members.
Assessed biochemically.
MR Studies
MR imaging and MR spectroscopy examinations were performed in a single session with a 1.5-T MR unit (Signa Horizon 1.5; GE Medical Systems, Milwaukee, WI).
Multisection sagittal spin-echo T1-weighted images (500/25/2 [TR/TE/NEX]; section thickness, 5 mm) were obtained to define the anatomic landmarks for positioning of dual fast spin-echo (3500/15, 100/2; echo train length, 8; section thickness, 4 mm) and fluid-attenuated inversion recovery (FLAIR) (12,000/120/2700 ms [TR/TE/TI]) sections in axial orientation. The field of view was 240 × 240 mm, and the matrix size was 256 × 256.
After MR imaging, a volume of interest (VOI) for MR spectroscopy, measuring 15 × 15 × 15 mm (3.4 cm3), was positioned on the axial images, within the deep cerebellar hemisphere (encompassing the dentate nucleus), the paratrigonal white matter, and the parieto-occipital cortex of either left or right side. The VOI was always placed in areas that appeared normal on MR images, and care was taken to avoid CSF spaces within the VOI. Additional spectra of basal ganglia were obtained in patients 13 and 14, in whom abnormally high signal intensity on T2-weighted images was found, and in patient 15, who had multiple cortical strokelike hyperintensities on T2-weighted images. 1H MR spectra were acquired by using the PROBE/SV system (GE Medical Systems), which provides automated global and local shimming and chemical shift selective water suppression (21). A short TE, stimulated echo acquisition mode (STEAM) technique (2010/30; mixing time, 13.7 ms; 128 signal averages) was used. Spectra were acquired with 2500-Hz bandwidth, corresponding to 2048 points. The acquisition of a single voxel spectrum took 4.56 minutes. Row data were analyzed offline by using the software Spectral Analysis General Electric Interactive Data Language (or SAGE/IDL), as described in detail elsewhere (22, 23). After spectral and phase offset referencing to the H2O, data processing involved low-frequency filtering of free induction decay, apodization of time domain signal by multiplying a Gaussian line broadening of 3 Hz, one time right-directed zero filling (to 4096 data points). Spectra were evaluated by comparing amplitudes of the resonance signals; peak amplitude was determined by assuming Lorentzian line shape and evaluating the baseline noise standard deviation. Amplitudes of myo-inositol (at 3.56 ppm), choline (at 3.25 ppm), NAA (at 2.01 ppm), lactate (at 1.33 ppm), and of any other abnormal signal were expressed as ratios to the creatine/phosphocreatine resonance intensity ([Cr] at 3.05 ppm).
Statistical Analysis
The patients’ measurements were compared with the normal metabolite peak ratio values of the right cerebellar hemisphere, of the paratrigonal white matter, and of the parieto-occipital cortex acquired with the same system and protocol in 20 healthy subjects aged 15–51 years (mean age, 38 years). Signal ratios were considered abnormal if they were more than ± 1 SD from the mean of those of the health control subjects.
Associations were subjected to the Spearman rank correlation test and a regression analysis. A cluster analysis procedure was applied to identify possible different spectroscopic patterns among patients, and a χ2 test was used to identify a possible association between clinical-phenotypic characteristic and spectroscopic pattern.
Results
MR Imaging Findings
Patients with a predominant myopathic clinical phenotype (ie, those with PEO) showed either normal imaging findings (patients 1 and 3), or slight and minor brain signal intensity abnormalities such as mildly prominent cerebral or cerebellar sulci and limited, unspecific foci of high signal intensity on T2-weighted FLAIR images in the paraventricular white matter, particularly in the region dorsal to the trigones (patients 2, 4, and 5). However, patients with syndromes that also involved the central nervous system (CNS) demonstrated a wide spectrum of brain abnormalities. In fact, patients 10 and 15, both with MELAS, had bilateral and multiple areas of abnormal signal intensity primarily involving the cerebral cortex and the subcortical white matter. The affected areas crossed vascular boundaries in patient 10 but not in patient 15. Patient 11, with Kearns-Sayre syndrome, had prominent cortical sulci suggestive of cerebral atrophy and diffuse high signal intensity in the cerebral and brain stem white matter, and in globi pallidi. Patient 13, with NARP, and patient 14, with Leigh syndrome, showed symmetric and bilateral lesions of the globi pallidi and corpora striata, respectively.
Patients 6–9, with the phenotype of nonsyndromic encephalomyopathy, showed prominent sulci and ventricles suggestive of cortical and white matter loss variably associated with high signal intensity of the cerebral white matter on T2-weighted images. The young girl with ophthalmoparesis (patient 12) showed normal MR imaging findings.
A summary of the findings at MR imaging is given in Table 2.
TABLE 2:
Brain MR imaging findings in the patients with mitochondrial diseases
| Patient No. | MR Findings |
|---|---|
| 1 | Normal |
| 2 | Mild cerebral atrophy |
| 3 | Normal |
| 4 | Mild cerebral atrophy |
| 5 | Mild cerebral atrophy, PVWM T2 hyperintensity |
| 6 | PVWM T2 hyperintensity |
| 7 | Cerebral and cerebellar atrophy |
| 8 | Mild cerebral atrophy |
| 9 | Mild cerebral atrophy |
| 10 | Left parieto-occipital and right occipital cortical strokelike lesions |
| 11 | Cerebral and cerebellar atrophy, diffuse T2 hyperintensity of cerebral white matter, globi pallidi, and midbrain dorsal aspect |
| 12 | Normal |
| 13 | Symmetrical T2 hyperintensity in putamina |
| 14 | T2 hyperintensity in corpora striata and lamina quadrigemina |
| 15 | Multiple and small cerebral cortical strokelike T2 hyperintensities |
Note.—PVWM indicates paraventricular white matter.
MR Spectroscopic Findings
Evaluation of spectra disclosed a reduction of choline amplitude in 12 studies of normal-appearing cerebellar white matter (80%), in 10 normal paratrigonal white matter (67%), and in nine normal cortical gray matter (60%). The NAA/Cr ratio was reduced in 14 cerebellar studies (93%) and in 13 cortical studies (87%). Myo-inositol/Cr ratios were within normal ranges in each anatomic location.
Lactate was always found in brain areas that appeared damaged on MR images (ie, in the basal ganglia of patients 13 and 14 [Fig 1] and in the cortex of patient 15). On the contrary, lactate was never found in brain that appeared normal on MR images with the exception of patients 14 (Fig 1) and 15 (Fig. 2), in whom an abnormal accumulation was evident throughout the brain.
Fig 1.
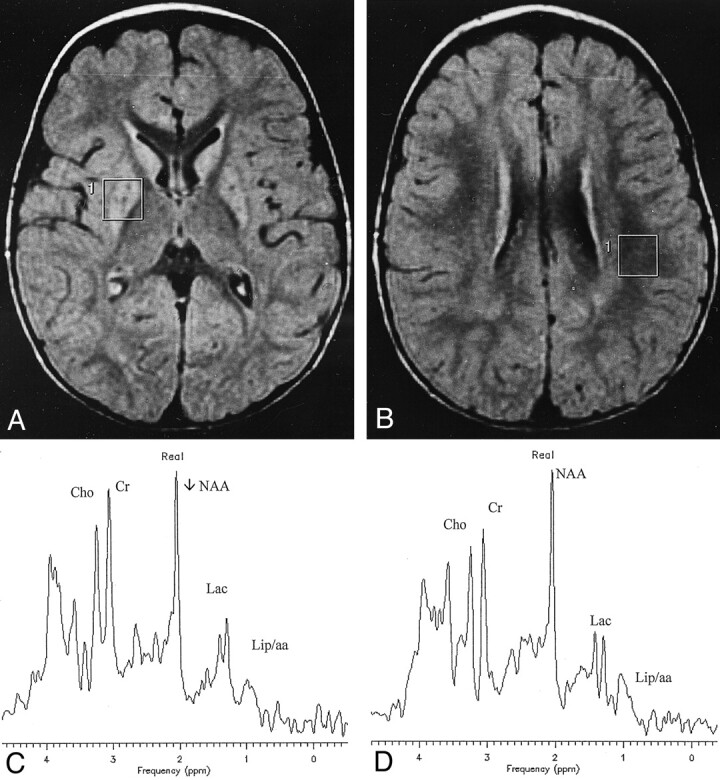
Patient 14 with Leigh syndrome.
A and B, Axial FLAIR images show bilateral and symmetrical hyperintensity of corpora striata. The VOIs used for spectroscopy are also shown.
C, Spectrum from the VOI containing the right affected putamen demonstrates resonances at 1.33 and 0.9 ppm coming respectively from lactate (Lac) and lipids or branched amino-acids (Lip/aa).
D, Abnormally high brain lactate (Lac) is also revealed in the spectrum from the VOI located in paraventricular white matter that appeared normal on the MR image.
Cho indicates choline; Cr, creatine.
Fig 2.
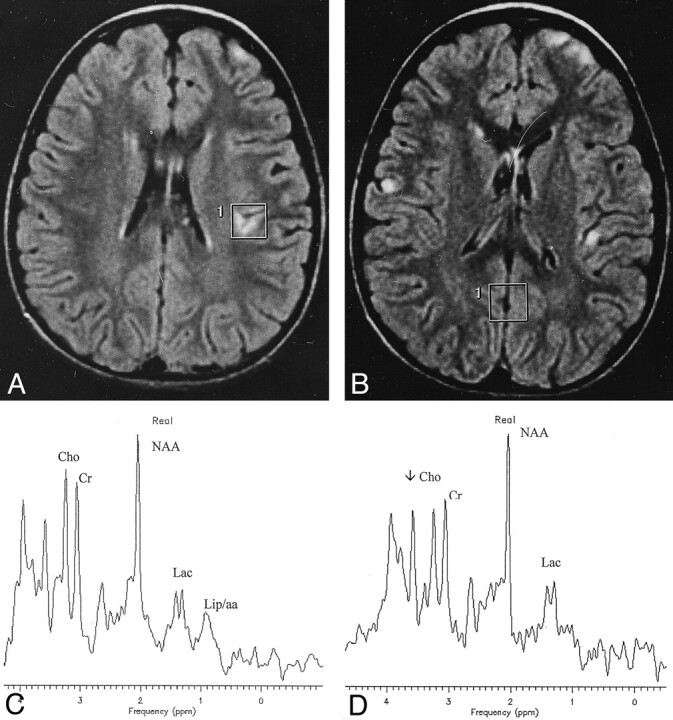
Patient 15 with MELAS.
A and B, Axial FLAIR images demonstrate multiple cortical strokelike lesions, the largest of which was located along the parieto-occipital cortex (not shown). Tiny frontal and parietal cortical hyperintensities and the VOIs used for spectroscopy are visible.
C and D, Spectra reveal high lactate (Lac) and the 0.9 ppm signal (Lip/aa) not only into the damaged cortex (C) but also into the normal-appearing parietal cortex (D). A significant decrease of NAA may also be appreciated in the spectrum in C. Cho indicates choline; Cr, creatine.
Spectra revealed an additional abnormality: the presence of a signal of low amplitude at 0.9 ppm, which was found in the two basal ganglia studies (Fig 1), but also in many areas that appeared normal on MR images, including those showing a lactate peak (patients 14 and 15). In particular, this peak was revealed in 10 cases of cerebellar studies, in six white matter studies, and in eight studies of the cortex (Fig 3). MR spectroscopic findings of normal-appearing areas of the patients and those of the healthy control subjects are reported in Table 3. Figure 4 displays the graphics of the metabolic ratios of each anatomic location for a more direct evaluation of the results.
Fig 3.

A–C, Single-voxel proton spectra from a normal-appearing cerebellar volume (A, patient 12), a normal-appearing parieto-occipital white matter volume (B, patient 3), and a normal-appearing parieto-occipital cortex (C, patient 1). Spectra reveal a significant decrease of choline (Cho) and the presence of a low amplitude signal at 0.9 ppm (Lip/aa) in each anatomic location. NAA is decreased in cerebellar (A) and parieto-occipital cortex (C) locations. Cr indicates creatine.
TABLE 3:
Brain single-voxel 1H MR spectroscopy of the patients presented in Table 1 (STEAM sequence at echo-time of 30 ms)
| Patient No. | Cerebellum |
White Matter |
Parieto-occipital Cortex |
||||||||||||
|---|---|---|---|---|---|---|---|---|---|---|---|---|---|---|---|
| ml | Cho | NAA | Lac | 0.9 ppm | mI | Cho | NAA | Lac | 0.9 ppm | mI | Cho | NAA | Lac | 0.9 ppm | |
| 1 | 0.5 | 0.87 | 1.09 | – | 0.23 | 0.63 | 0.80 | 1.33 | – | – | 0.52 | 0.55 | 1.19 | – | 0.25 |
| 2 | 0.62 | 0.98 | 1.06 | – | 0.27 | 0.71 | 1.17 | 1.34 | – | – | 0.62 | 0.76 | 1.32 | – | – |
| 3 | 0.75 | 0.73 | 1.01 | – | 0.25 | 0.62 | 0.82 | 1.33 | – | 0.32 | 0.53 | 0.72 | 1.34 | – | – |
| 4 | 0.78 | 0.61 | 0.92 | – | – | 0.80 | 1.15 | 1.32 | – | – | 0.53 | 0.55 | 1.16 | – | – |
| 5 | 0.87 | 0.94 | 1.15 | – | 0.32 | 0.72 | 1.01 | 1.36 | – | – | 0.69 | 0.61 | 1.18 | – | 0.33 |
| 6 | 0.58 | 0.90 | 1.02 | – | 0.45 | 0.69 | 1.19 | 1.21 | – | 0.48 | 0.67 | 0.52 | 1.37 | – | – |
| 7 | 0.59 | 0.89 | 0.95 | – | – | 0.71 | 0.96 | 1.37 | – | – | 0.56 | 0.52 | 1.14 | – | – |
| 8 | 0.57 | 0.90 | 1.09 | – | 0.29 | 0.64 | 1.03 | 1.29 | – | – | 0.64 | 0.77 | 1.32 | – | 0.25 |
| 9 | 0.69 | 0.82 | 0.84 | – | 0.30 | 0.75 | 1.13 | 1.37 | – | – | 0.71 | 0.59 | 1.18 | – | 0.37 |
| 10 | 0.55 | 0.87 | 1.05 | – | – | 0.64 | 0.93 | 1.47 | – | 0.42 | 0.55 | 0.63 | 1.41 | – | – |
| 11 | 0.61 | 0.86 | 1.09 | – | – | 0.7 | 1.1 | 1.3 | – | 0.35 | 0.51 | 0.65 | 1.16 | – | 0.51 |
| 12 | 0.67 | 0.66 | 0.97 | – | 0.21 | 0.67 | 0.83 | 1.38 | – | – | 0.52 | 0.72 | 1.29 | – | – |
| 13 | 0.64 | 0.94 | 0.83 | – | – | 0.75 | 1.14 | 1.53 | – | – | 0.64 | 0.74 | 1.19 | – | 0.22 |
| 14 | 0.67 | 0.82 | 0.99 | 0.24 | 0.26 | 0.74 | 1.29 | 1.31 | 0.45 | 0.29 | 0.76 | 0.64 | 1.22 | 0.39 | 0.25 |
| 15 | 0.60 | 0.75 | 0.66 | 0.31 | 0.21 | 0.63 | 0.94 | 1.31 | 0.29 | 0.21 | 0.77 | 0.77 | 1.22 | 0.42 | 0.22 |
| Normals | |||||||||||||||
| Mean ± SD | 0.65 ± 0.09 | 0.96 ± 0.06 | 1.19 ± 0.05 | 0.67 ± 0.07 | 1.19 ± 0.06 | 1.36 ± 0.04 | 0.64 ± 0.04 | 0.76 ± 0.06 | 1.41 ± 0.06 | ||||||
Note.—Metabolites’ resonance intensities are expressed as ratios to the Creatine/Phosphocreatine (Cr, at 3.05 ppm) signal intensities.
mI = myoinositol, at 3.56 ppm; Cho = choline, at 3.05 ppm; NAA = N-acetyl aspartate, at 2.01 ppm; Lac = lactate, at 1.33 ppm. The signal at 0.9 ppm could be either related to lipids or to branched chain amino acids.
Fig 4.

A–C, Plots of the metabolite ratios reported in Table 3 for cerebellum (A), white matter (B), and parieto-occipital cortex (C). Vertical bars are the range of each ratio in 15 control subjects. mI indicates myo-inositol; Cho, choline; Lac, lactate
Cluster analysis of the above-mentioned MR spectroscopic signal abnormalities identified two main patterns of brain metabolic profiles. In 40% of the MR spectroscopic studies, choline signal reduction was associated with NAA reduction (type I pattern), whereas in 53% of studies choline reduction and NAA reduction were associated with either the presence of lactate or of the 0.9 ppm signal or of both signals (type II pattern). The remaining 7% of the MR spectroscopic studies were normal. MR spectroscopic patterns correlated with the clinical phenotypes, indicating that normal or type I pattern was more frequent in patients without clinical involvement of CNS, whereas type II was mainly found in patients with clinical involvement of CNS (P = .05) and in three of four pediatric cases. No correlation was found between these two patterns and MR imaging results.
Discussion
Using brain MR examinations, we investigated 15 patients with different types of mitochondrial diseases, including primary or putative nucleus-driven defects of the mt genome, and found a wide range of structural and metabolic abnormalities in the brain.
The CNS is frequently involved in mitochondrial diseases because of its strong dependence on oxidative metabolism. The clinical consequences of this involvement are extremely heterogeneous, and in only a few cases does the coincidence of particular symptoms and signs depict nosographically distinct mitochondrial syndromes. Also, brain pathology reports include a wide range of gray and white matter modifications in mitochondrial diseases. Postmortem studies have variously shown a spongiform vacuolation of white matter and gray matter (status spongiosus), neuronal loss with astrocytosis of gray matter, or focal microcystic cavities containing capillary proliferation, without a relationship between pathologic alterations and the clinical picture (24).
In our investigation, five of 15 patients clinically presented without CNS involvement, and their brain images were either normal or showed small and nonspecific paraventricular white matter abnormalities. On the contrary, patients presenting a phenotype with predominant brain involvement were affected by different degrees of atrophy, by damages to the cortex, and by basal ganglia and white matter abnormalities. Our results are in agreement with those of previous imaging studies on this subject (13, 25–27), supporting the hypothesis that these heterogeneous diseases share a basic pathologic feature. In fact, although white matter involvement may be seen in the form of spongy degeneration (as in Kearns-Sayre syndrome or in complex II deficit leukodystrophy), they primarily affect gray matter, since their most common abnormalities consist in cortical atrophy or cortical-subcortical gray matter lesions.
1H MR spectroscopy is a very promising technique that provides in vivo biochemical information on a variety of brain compounds (28). Therefore, it could help to give insight into the physiopathology of brain lesions in mitochondrial diseases. So far, the most common metabolic abnormalities assessed with 1H MR spectroscopy include a variable degree of NAA signal decrease and accumulation of lactate in brain (11–18), leading to the conclusion that lactate detection with 1H MR spectroscopy is a sensitive metabolic marker of mitochondrial encephalopathy. However, in most published cases, spectroscopy was performed only in brain areas that appeared damaged on MR images, therefore making questionable the diagnostic specificity of lactate, since different brain insults may elevate lactate by interfering with mitochondrial function or as a result of macrophage lactate production (29, 30).
In our series, lactate was never found in areas of the brain that appeared normal on MR images except for patients 14 (Fig 1) and 15 (Fig 2), two children in whom the diagnosis was further confirmed by molecular mtDNA analysis. Interestingly, in these two patients, 1H MR spectroscopy was performed coincidentally with a clinical relapse of symptomatology, whereas adults were studied during a period of disease quiescence. These findings could be explained by a severe energy failure of the brain during stages of disease relapses, resulting in an upregulation of nonoxidative glucose consumption, which yields an accumulation of lactate throughout the brain.
Considering that the chances to disclose lactate by means of 1H MR spectroscopy are related to concentration threshold of lactate-methyl-protons (> 0.5 mmol) (31), and that brain lactate concentration may rise during stages of metabolic imbalance, the ideal timing to perform MR spectroscopy should be during stages of clinical exacerbations.
The other 1H MR spectroscopy abnormalities observed in our patients consisted of choline reduction, NAA reduction, and presence of a small signal at 0.9 ppm.
In all patients, NAA decreased in the cerebellum and cortex, but not in the white matter. NAA decrease is currently interpreted as the most sensitive sign of neuronal rarefaction or dysfunction in many metabolic and neurodegenerative brain diseases (32, 33). We also found a significant choline signal decrease in the spectra. This signal comes from the choline-water-soluble pool, which is one of the precursors of myelin phospholipids synthesis, and from the hydrophilic heads of the membrane phospholipid layers (34). Therefore, choline reduction in mitochondrial diseases could be the metabolic spectroscopic correlate of a possible impairment of the normal processes of membrane maintenance due to the reduced energy production. Its biologic significance has been highlighted by De Stefano and co-workers (35), who described a reversible choline reduction after dichloroacetate short-term treatment in patients with MELAS. As in the case of NAA, this abnormality was not related to any particular clinical phenotype.
Detection of the 0.9-ppm resonance in our patients was a dubious and unexpected finding, since this signal is generally related to brain lesions containing cellular necrosis or membrane disruption processes (ie, long chain fatty acids from myelin breakdown products or membrane macromolecules) (36–38). This peak can only be detected with short-TE sequences, and it cannot be ruled out to be an artifact, expecially in cerebellar spectra, due to a contamination of out-volume signals. Nevertheless, we have never detected it into the paratrigonal white matter and the parieto-occipital cortex, either in normal or in other known metabolic disease 1H MR spectroscopic studies. For this reason, we hypothesize that a possible biochemical explanation could be related to the accumulation of branched amino acids (leucine, isoleucine, and valin), which resonate at this frequency (39). This hypothesis deserves further evaluation by means of additional 1H MR spectroscopic data in mitochondrial enecephalopathies since there is experimental evidence indicating that a primary deficiency in mitochondrial activity can affect the normal degradation of these substrates, through an inhibition of the rate of the alpha-keto-acids dehydrogenase mitochondrial complex (40–43).
Cluster analysis of 1H MR spectroscopic signal abnormalities revealed two patterns of brain metabolic profiles. Type II pattern, containing the most meaningful metabolic abnormalities, was frequently depicted in the pediatric subgroup of our sample, who had the most severe clinical pictures, and in adults with predominant CNS clinical involvement. Based on that, the type II profile can be considered the most conspicuous expression of brain metabolic imbalance detectable by means of 1H MR spectroscopy.
Conclusion
1H MR spectroscopy is a useful investigational tool in the study of mitochondrial diseases, as it supplies additional information to that of conventional imaging. Even if not specific, it was demonstrated to be more sensitive than MR imaging, because it documents metabolic anomalies even in areas of the brain that appeared to be normal.
An additional diagnostic value of this technique results from the finding of lactate accumulation in brain areas that appeared normal on MR images, probably time-related to an exacerbation of patient symptoms. As clinical relapses are quite frequent events in mitochondrial diseases, 1H MR spectroscopic study ideally should be carried out during such relapse episodes.
Supplementary studies are necessary to elucidate the biochemical significance of the frequently occurring 0.9-ppm signal and, therefore, to validate its possible diagnostic value in mitochondrial diseases.
No significant correlation emerged among the type of metabolic anomaly, the brain area in which it was detected, and the clinical phenotype of mitochondrial disease. The lack of any correlation probably reflects the wide clinical variability in mitochondrial diseases. Many factors may account for this, such as the degree of mtDNA heteroplasmy, different neuronal threshold effect, and brain vulnerability to local toxic factors.
However, when spectroscopic abnormalities appear together with a clinical and laboratory framework properly suggestive of mitochondrial dysfunction, they could provide useful additional information regarding such a complex diagnostic puzzle. As a result, they could contribute to reinforcing a diagnostic suspicion and justify further biochemical or genetic investigation. Finally, aside from their diagnostic value, spectroscopic abnormalities are in any case important markers to monitor the natural course of these diseases and the response to new and promising experiments in therapy trials (44, 45).
Acknowledgments
The authors thank Prof. L. Leuzzi for his comments on the preliminary version of the manuscript.
Footnotes
Presented in part at the 36th annual meeting of the American Society of Neuroradiology, Philadelphia, PA, May 17–21, 1998.
Supported by grants from Telethon-Italy (project nos. 955c and 1179c) and from the Italian Ministry of Health (RC/2000).
References
- 1.Jackson MJ, Schaefer JA, Johnson MA, Morris AAM, Turnbull DM, Bindoff LA. Presentation and clinical investigation of mitochondrial respiratory chain disease: a study of 51 patients. Brain 1995;118:339–357 [DOI] [PubMed] [Google Scholar]
- 2.Chimmery PF, Turnbull DM. Clinical features, investigation, and management of patients with defects of mitochondrial DNA. J Neurol Neurosurg Psychiatry 1997;63:559–563 [DOI] [PMC free article] [PubMed] [Google Scholar]
- 3.Di Mauro S, Bonilla E, De Vivo DC. Does the patient have a mitochondrial encephalomyopathy? J Child Neurol 1999;14:23–35 [DOI] [PubMed] [Google Scholar]
- 4.Moats RA, Watson L, Shonkt T, et al. Added value of automated clinical proton MR spectroscopy of the brain. J Comput Assist Tomogr 1995;19:480–491 [DOI] [PubMed] [Google Scholar]
- 5.Wang ZJ, Zimmermann RA. Proton MR spectroscopy of pediatric brain metabolic disorders. Neuroimaging Clin North Am 1998;8:781–807 [PubMed] [Google Scholar]
- 6.Grodd W, Krageloh-Mann I, Petersen D, Trefz FK, Harzer K. In vivo assessment of N-acetylaspartate in brain spongy degeneration (Canavan’s disease) by proton spectroscopy. Lancet 1990;336:437–438 [DOI] [PubMed] [Google Scholar]
- 7.Stöckler S, Hanefeld F, Frahm J. Creatine replacement therapy in guanidinoacetate methyltransferase deficiency, a novel inborn error of metabolism. Lancet 1996;348:789–790 [DOI] [PubMed] [Google Scholar]
- 8.Bianchi MC, Tosetti M, Fornai F, et al. Reversible brain creatine deficiency in two sisters with normal blood creatine level. Ann Neurol 2000;47:511–513 [PubMed] [Google Scholar]
- 9.Kruse B, Barker PB, Van Zijl PC, Duyn JH, Moonen CT, Moser HW. Multislice proton magnetic resonanace spectroscopic imaging in X-linked adrenoleukodystrophy. Ann Neurol 1994;36:595–608 [DOI] [PubMed] [Google Scholar]
- 10.Ross BD, Jacobson S, Villamil F, et al. Subclinical hepatic encephalopathy: proton MR spectroscopic abnormalities. Radiology 1994;193:457–463 [DOI] [PubMed] [Google Scholar]
- 11.Detre JA, Wang Z, Bogdan AR, et al. Regional variation in brain lactate in Leigh syndrome by localized 1H magnetic resonance spectroscopy. Ann Neurol 1991;29:218–221 [DOI] [PubMed] [Google Scholar]
- 12.Matthews PM, Andermann F, Silver K, Carpati G, Arnold DL. Proton MR spectroscopic characterization of differences in regional brain metabolic abnormalities in mitochondrial encephalomyopathies. Neurology 1993;43:2484–2490 [DOI] [PubMed] [Google Scholar]
- 13.Barkovich AJ, Good WV, Koch TK, Berg BO. Mitochondrial disorders: analysis of their clinical and imaging characteristics. AJNR Am J Neuroradiol 1993;14:1119–1137 [PMC free article] [PubMed] [Google Scholar]
- 14.Kuwabara T, Watanabe H, Tanaka K, et al. Mitochondrial encephalomyopathy: elevated visual cortex lactate unresponsive to photic stimulation—a localized 1H-MRS study. Neurology 1994;44:557–559 [DOI] [PubMed] [Google Scholar]
- 15.Castillo M, Kwock L, Green C. MELAS syndrome: imaging and proton MR spectroscopic findings. AJNR Am J Neuroradiol 1995;16:233–239 [PMC free article] [PubMed] [Google Scholar]
- 16.Clark JM, Marks MP, Adalsteinsson E, et al. MELAS: clinical and pathologic correlations with MRI, xenon/CT and MR spectroscopy. Neurology 1996;46:223–227 [DOI] [PubMed] [Google Scholar]
- 17.Kapellar P, Fazekas F, Offenbacher H, et al. Magnetic resonance imaging and spectroscopy of progressive cerebral involvement in Kearns-Sayre syndrome. J Neurol Sci 1996;135:126–130 [DOI] [PubMed] [Google Scholar]
- 18.Pavlakis SG, Kingsley PB, Kaplan GP, Stacpoole PW, Oshea M, Lustbader D. Magnetic resonance spectroscopy: use in monitoring MELAS treatment. Arch Neurol 1998;55:849–852 [DOI] [PubMed] [Google Scholar]
- 19.Mancuso M, Bianchi MC, Santorelli FM, et al. Encephalomyopathy with multiple mitochondrial DNA deletions and multiple symmetric lipomatosis: further evidence of a possible association. J Neurol 1999;246:1197–1198 [DOI] [PubMed] [Google Scholar]
- 20.Santorelli FM, Siciliano G, Casali C, et al. Mitochondrial tRNA (Cys) gene mutation (A5814G): a second family with mitochondrial encephalopathy. Neuromusc Disord 1997;7:156–159 [DOI] [PubMed] [Google Scholar]
- 21.Webb PG, Sailasuta N, Kohler SJ, et al. Automated single-voxel proton MRS: technical development and multisite verification. Magn Reson Med 1994;31:365–373 [DOI] [PubMed] [Google Scholar]
- 22.Mascalchi M, Tosetti M, Plasmati R, et al. Proton magnetic resonance spectroscopy in an Italian family with spinocerebellar ataxia type 1. Ann Neurol 1998;43:244–252 [DOI] [PubMed] [Google Scholar]
- 23.Bianchi MC, Tosetti M, Moretti P, et al. Evaluation of herpes encephalitis and diffuse astrocytoma by means of magnetic resonance imaging and proton magnetic resonance spectroscopy. Int J Neuroradiol 1999;5:16–21 [Google Scholar]
- 24.Sparaco M, Bonilla E, Di Mauro S, Powers JM. Neuropathology of mitochondrial encephalomyopathies due to mitochondrial DNA defects. J Neuropathol Exp Neurol 1993;52:1–10 [DOI] [PubMed] [Google Scholar]
- 25.Matthews PM, Tampieri D, Berkovic SF, et al. Magnetic resonance imaging shows specific abnormalities in the MELAS syndrome. Neurology 1991;41:1043–1046 [DOI] [PubMed] [Google Scholar]
- 26.Valanne L, Ketonen L, Majander A, Suomalainen A, Pihko H. Neuroradiologic findings in children with mitochondrial disorders. AJNR Am J Neuroradiol 1998;19:369–377 [PMC free article] [PubMed] [Google Scholar]
- 27.Wray SH, Provenzale JM, Johns DR, Thulborn KR. MR of the brain in mitochondrial myopathy. AJNR Am J Neuroradiol 1995;16:1167–1173 [PMC free article] [PubMed] [Google Scholar]
- 28.Ross BD, Blum S. Neurospectroscopy. In: Greenberg JO, ed. Neuroimaging. McGraw-Hill Companies Inc.;1999. :727–774
- 29.Lopez-Villegas D, Lenkinski RE, Wehrli SL, Ho WZ, Douglas SD. Lactate production by human monocytes/macrophages determined by proton MR spectroscopy. Magn Reson Med 1995;34:32–38 [DOI] [PubMed] [Google Scholar]
- 30.Bitsch A, Bruhn H, Vougioukas V, et al. Inflammatory CNS demyelination: histopathologic correlation with in vivo quantitative proton MR spectroscopy. AJNR Am J Neuroradiol 1999;20:1619–1627 [PMC free article] [PubMed] [Google Scholar]
- 31.Ross BD. A biochemistry primer for neuroradiologist. In: Advanced Imaging Symposium: Preparing the Neuroradiologist for the New Millenium. Oak Brook, IL: American Society of Neuroradiology,2000. :13–27
- 32.Urenjak J, Wiliams SR, Gadian DG, Noble M. Proton nuclear magnetic resonance spectroscopy unambigously identifies differentneuronal cell types. J Neurosci 1993;13:981–989 [DOI] [PMC free article] [PubMed] [Google Scholar]
- 33.Vion-Dury J, Nicoli P, Salvan AM, et al. Reversal of brain metabolic alterations with zidovudine detected by proton localized magnetic resonance spectroscopy. Lancet 1995;345:60–61 [DOI] [PubMed] [Google Scholar]
- 34.Agris PF, Campbell ID. Proton nuclear magnetic resonance of intact friend leukemia cells: phosphorylcholine increase during differentiation. Science 1982;216:1325–1327 [DOI] [PubMed] [Google Scholar]
- 35.De Stefano N, Matthews PM, Ford B, Genge A, Karpati G, Arnold DL. Short-term dichloroacetate treatment improves indices of cerebral mitochondrial disorders. Neurology 1995;45:1193–1198 [DOI] [PubMed] [Google Scholar]
- 36.Bruhn H, Kruse B, Korenke GC, et al. Proton NMR Spectroscopy of cerebral metabolic alterations in infantile peroxisomal disorders. J Comput Assist Tomogr 1992;16:335–344 [DOI] [PubMed] [Google Scholar]
- 37.Kuesel AC, Donnelly SM, Halliday W. Mobile lipids and metabolic heterogeneity of brain tumors as detectable by ex vivo 1H-MR spectroscopy. NMR Biomed 1994;7:172–180 [DOI] [PubMed] [Google Scholar]
- 38.Kuesel AC, Sutherland GR, Halliday W. 1H-MR spectroscopy of high grade astrocytomas: mobile lipid accumulation in necrotic tissue. NMR Biomed 1994;7:49–55 [DOI] [PubMed] [Google Scholar]
- 39.Felber SR, Sperl W, Chemelli A, Murr C, Wendel U. Maple syrup urine disease: metabolic decompensation monitored by proton magnetic resonance imaging and spectroscopy. Ann Neurol 1993;33:396–401 [DOI] [PubMed] [Google Scholar]
- 40.Patel TB, Debuysere MS, Barron LL, et al. Studies on the regulation of the branched chain alpha-keto acid dehydrogenase in the perfused rat liver. J Biol Chem 1981;256:9009–9015 [PubMed] [Google Scholar]
- 41.Waymack WW, DebuysereMS, Olson MS. Studies on the activation and inactivation of the branched chain alpha-keto acid dehydrogenase in the perfused rat heart. J Biol Chem 1980;255:9773–9781 [PubMed] [Google Scholar]
- 42.Matuda S, Kitano A, Sakaguchi Y, et al. Pyruvate dehydrogenase subcomplex with lipoamide dehydrogenase deficiency in a patient with lactic acidosis and branched chain ketoaciduria. Clin Chim Acta 1984;140:59–64 [DOI] [PubMed] [Google Scholar]
- 43.Taylor J, Robinson BH, Sherwood WG. A defect in branched-chain aminoacid metabolism in a patient with congenital lactic acidosis due to dihydrolipoyl dehydrogenase deficiency. Pediatr Res 1978;12:60–62 [DOI] [PubMed] [Google Scholar]
- 44.Craigen WJ. Leigh disease with deficiency of lipoamide dehydrogenase: treatment with dichloroacetate. Pediatr Neurol 1996;4:69–71 [DOI] [PubMed] [Google Scholar]
- 45.Larsson NG, Luft R. Revolution in mitochondrial medicine. FEBS Lett 1999;455:199–202 [DOI] [PubMed] [Google Scholar]