Abstract
BACKGROUND AND PURPOSE: The time course of cortical activations of different anatomic areas has been demonstrated to reflect, to some degree, the temporal dynamics of the brain network. The purpose of this study was to determine the temporal sequence of the hemodynamic response in the visual, supplemental motor (SMA), and primary motor cortical areas by using a visuomotor reaction time task.
METHODS: The reaction times (RTs) of 26 right-handed subjects were recorded in response to a visual cue during an event-related functional MR imaging (fMRI) experiment. Statistical parametric mapping (SPM99) was used, and activation maps were produced for each subject. This was followed by a random-effects group analysis. Using a weighted least-squares approach, we recorded the time at onset of the hemodynamic response of the fMRI activation in four regions of interest: the right occipital (RO) and left occipital (LO) visual cortices, the SMA, and the left sensorimotor area (LM1). Linear regression analysis was done between the RTs and the mean latencies for the four areas.
RESULTS: Using the group analysis, the results showed that the first regions to activate were the visual occipital cortices (RO and LO) with mean latency ± standard error of mean (SEM) of 1.74 ± 0.05 s and 1.85 ± 0.08 s, respectively. The visual occipital areas were followed by the SMA of 2.07 ± 0.16 s and finally the LM1 with a mean latency of 2.1 ± 0.15 s. There were significant differences in the mean onset of latencies between RO and LO, RO and SMA, and RO and LM1 (P < .05). On performing regression analysis between the RTs and the mean latencies by using the group analysis, there was no significant correlation with any of the four areas. By using an individual subject analysis, the results again showed that the first regions to activate were the visual occipital cortices (RO and LO) with mean latency ± SEM of 1.75 ± 0.06 s and 1.84 ± 0.12 s, respectively, followed by the SMA with a mean latency of 2.19 ± 0.25 s and finally the LM1 of 2.26 ± 0.38 s. There was no significant difference between the mean onset latencies.
CONCLUSION: The onset of the hemodynamic response started first in the visual cortex (input) followed by the SMA and primary motor cortical area (output). The onset of activation showed no direct correlation with the overall RTs of the subjects, leading one to suggest that the peripheral motor unit may have a greater impact on RT than the central contribution.
Timing is crucial to many aspects of human performance (1). The prolongation of the human’s reaction time (RT) can account for the propensity of motor vehicle accidents, slips, and falls among the elderly and infirmed, because their RTs to emergency situations tend to be longer (2). Imaging studies are being used more frequently to assess individual performance. Functional MR imaging (fMRI) has become an increasingly popular technique for studying brain activation in response to sensory, motor, or cognitive events. Although the time course of the fMRI signal intensity is typically used to assist detection of valid fMRI responses, the temporal delay of the response may itself be an important focus of interest (3).
The delays that occur in visuomotor RTs may be due to delays in detecting the stimulus (eg, visual perception), transporting the information about the stimulus to the brain for central processing (eg, transport of data from retina to occipital lobes), processing the data within the brain (eg, visual cortex, association areas, SMAs, motor cortices, etc), sending a message to the peripheral “reactors” (eg, transport from the brain to the spine and the neuromuscular unit), or performing the peripheral function (eg, muscular function, electromyographic stimulation, motor times) (4).
Several brain regions are involved in the precise timing of the response to a visuomotor stimulus. The main regions of interest along the visuomotor pathway are the right occipital (RO) and left occipital (LO) visual cortices, which are responsible for the perception of the visual stimulus, as well as the SMAs and the sensorimotor cortex, which are responsible for the motor movement function. Other areas controlling movement timing in a visuomotor paced finger-tapping task include the cerebellum and the inferior parietal lobule (5).
Examination of the amplitude of the activation response had revealed that the regions do not activate simultaneously. Instead, the individual activation time courses reveal differential responses that correspond to the theoretical processing role in the problem-solving task (6).
The present study was conducted by using event-related fMRI, which allows differential assessment of timing and latencies from different cortical regions. We hypothesized that the sequence of latencies for the neural activity would start in the visual cortex and then proceed to the SMA and, finally, the motor region. We sought to determine the relationship of the hemodynamic latencies with RTs.
Methods
Twenty-six healthy, right-handed subjects (11 male and 15 female; age range, 25–85 years; mean age, 51 years) participated in this study. Written informed consent approved by the Johns Hopkins Institutional Review Board was obtained from all subjects. These subjects had no metallic implants and no known neurologic or visual deficits.
MR imaging was performed on a 1.5-T system (Gyroscan ACS-NT; Powertrak 6000, Philips Medical Systems, Best, the Netherlands) equipped with 2.3 G/cm gradients and echo-planar imaging. A standard head coil with foam padding to limit head motion was used. All patients underwent a screening T2-weighted study (TR 4000, TE 102) to assess for masses as well as the presence and degree of white matter lesions. Only subjects with no mass lesions or significant white matter changes (less than a grade of 4 on the Cardiovascular Health Study rating system) were included in the analysis. The fMRI protocol employed a gradient echo blood oxygenation level–dependent (BOLD) technique with a TR of 1000 ms, TE of 39 ms, 90° flip angle, 24-cm field of view, 360 images or time points in a single 6-minute study. Twelve image sections angled parallel to the intercommissural line including both primary visual, as well as sensorimotor cortices, were acquired with a 5-mm thickness and an intersection spacing of 1 mm by using an effective matrix of 128 × 128. At the TE of 39 ms, there is not enough time to sample the 128 × 128 k-space data matrix fully, so 128 × 128 matrix size requires partial acquisition of the k-space data (60%), and hence the actual spatial resolution exceeds the 1.875 × 1.875-mm pixel size within the section.
The event-related paradigm; written in the E-prime (Psychology Software Tools, Pittsburgh, PA) programming environment, consisted of a round, circular, multicolored visual cue appearing on the screen for 0.5 s at either 20-s or 30-s intervals randomly throughout the study; otherwise, a white fixation crosshair was constantly present in the center of a black background throughout the scan. The subjects were asked to tap a finger press button with the second finger of their right hand as soon as they saw the visual cue. RTs during the experiment were measured in milliseconds from the button box and registered at the computer connected to the system.
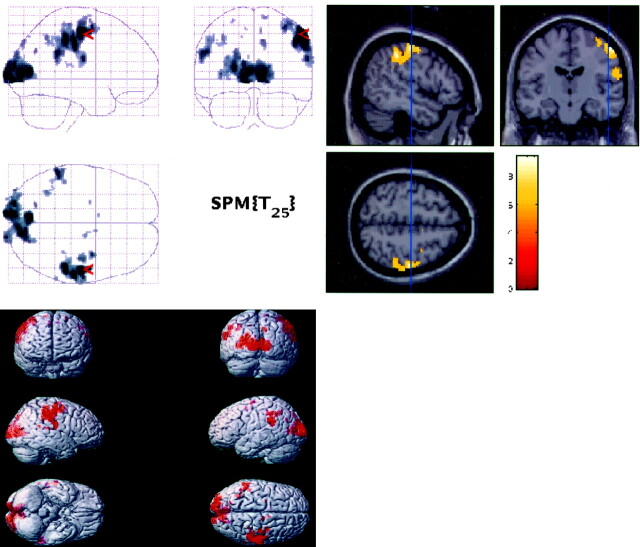
The functional data processing for each subject was performed on SUN Ultra workstations by using SPM99 (Wellcome Department of Cognitive Neurology, London, UK) implemented in Matlab (Mathworks, Sherbon, MA) (7). Realignment for motion correction, normalization, and deformation was performed by using the standard brain template from the Montreal Neurologic Institute (MNI) and then converted to the standard stereotaxic atlas of Talairach space (8) by using an algorithm developed by Matthew Brett (http://www.mrc-cbu.cam.ac.uk/Imaging/); smoothing at 5-mm thickness and data analysis by using thresholds of P < .001 (uncorrected) were performed by using the SPM99 software (http://www.fil.ion.ucl.ac.uk/spm) for individual subjects. The response times were used to create an idealized regressor, which was then convolved with the SPM99 canonical hemodynamic response. This model was fit to the data, and the amplitude was divided by the mean signal intensity to calculate the percent signal intensity change (contained in the SPM beta image). The individual amplitude estimates were individually calculated and then averaged. Then a random-effects group analysis was performed using the amplitude estimates (% signal intensity change) of the 26 subjects with a threshold of P < .05 (corrected for multiple comparisons). The images from the fMRI data sets were displayed on standardized templates derived from MNI and converted to Talairach and Tournoux, after warping to the atlas was performed. These templates were used to uniformly display the individual fMRI maps as well as the group map for activation localization (Fig 1).
Fig 1.
Statistical activation maps (top left), T1W sections (top right), and render images (bottom left) for the random-effects group analysis (n = 26) showing the visual and motor activations P < .05 (corrected).
By using a digital Talairach and Tournoux atlas template labeled with Brodmann areas and gyrus names, the masks for the four regions of interest were defined (9). The areas of activation within Brodmann areas 17, 18, and 19 (for visual cortex activation), Brodmann areas 1, 2, 3, and 4 (for sensorimotor activation, the left sensorimotor area [LM1]), and Brodmann area 6 (for SMA activation) identified on the group maps were designated when performing the latency analyses.
After determining the region of interest masks for the LO and RO visual cortices, right and left combined SMA and LM1, the following latency calculation was performed. The voxels within the region of interest, surviving the random-effects “group map” were used together with each subject’s amplitude estimate to calculate a latency value for each region of interest by using a weighted least squares (WLS) approach (10). This approach provides a way to estimate the latency without having the perfect model, because the rising edge is the most important. Thus, the model was created by using a standard linear approach, in which the events are convolved with the hemodynamic function.
In this method, we preferentially weighted the rising edge of the hemodynamic response to calculate the latency interval to reflect the onset of the fMRI signal intensity change. This technique was chosen because the variability of the rising edge of the hemodynamic response function is less than that of the portions following the upslope. A latency calculation was performed for each voxel within the designated regions of interest. We then calculated the average of the lowest quartile of latencies for the RO, LO, SMA, and LM1 regions. The mean of these “fastest” 25% of voxels were recorded because we sought to determine the earliest onset of hemodynamic responses to the stimulus within a region of interest. All 360 time points in the scan are used in this approach. The height threshold for latency calculation for this group analysis was fixed for all subjects at t = 5.9. Thus, this analysis (group analysis) examined the set of group-activated voxels for each subject and each region. Results for the mean latencies ± SEM in seconds were calculated for the four regions of interest. Then paired single-tailed t tests between the four mean latencies were performed (Table). We used a single-tailed t test because we hypothesized that occipital activation would occur before SMA, which would occur before LM1 activation. Also the average RTs of the participants were tabulated and a regression analysis between the latencies of each area and the mean subject’s RTs was performed.
TABLE 1:
Showing the p Value of the Single-Tailed Paired t Test Between the Mean Lower Quartile Latencies of the Four Regions of Interest Using the Group Map
| t | P | |
|---|---|---|
| RO and SMA | −2.2 | 0.02* |
| LO and SMA | −1.64 | 0.055 |
| SMA and LM1 | 0.25 | 0.4 |
| RO and LM1 | −2.3 | 0.01* |
| LO and LM1 | −1.7 | 0.05 |
| RO and LO | −2.2 | 0.02* |
Note—Right occipital visual area (RO), left occipital visual area (LO), supplemental motor areas (SMA), left sensorimotor area (LM1).
P < .05.
For further analysis of the relationship between the RT and the latencies, a second analysis for latencies was performed by using the individually processed maps (rather than the group map). The voxels within the region of interest surviving the “individual map” for each data set were used together with each subject’s amplitude estimate to calculate a latency value for each region of interest by using the WLS approach. The height threshold for the individual analysis was initially set at t = 3.2; however, 12 areas in 10 subjects (from the 104 areas in 26 subjects) required lower thresholds to pick the first highest surviving areas. Thus, for these 10 subjects we used an “adaptive” threshold that ranged from a threshold of t = 1.0–3.2 within a given region of interest that selected the voxels that were maximally activated.
Results
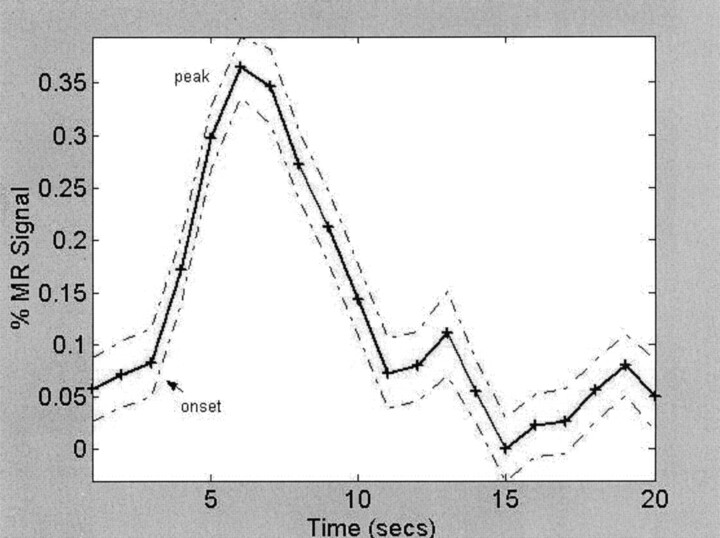
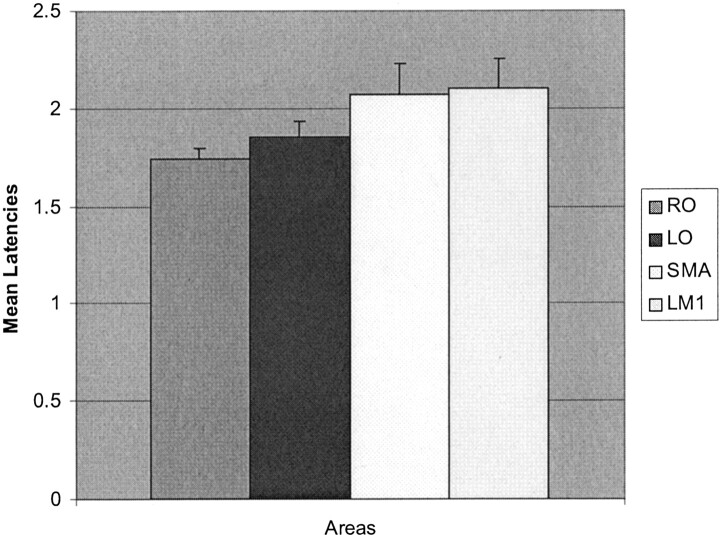
The mean RT ± SEM of the 26 participants was 423.0 ± 17.9 ms, with a median of 445 ms. With the random-effects group map at a corrected threshold of P < .05 (t = 5.9), the absolute number of suprathreshold activated voxels were 1969 voxels for RO, 1422 for LO, 14 for SMA, and 807 voxels for LM1. These were the voxels that were subsequently used to perform the latency analyses. Using the random-effects group map and the amplitude estimates for each subject at the same corrected threshold, the hemodynamic onset latencies and time course plots for each region of interest were obtained (Fig 2). The grouped mapped data showed that the RO and LO activated first (mean latency ± SEM of 1.74 ± 0.05 s and 1.85 ± 0.08 s, respectively), followed by the SMA with a mean latency of 2.07 ± 0.16 s followed by the LM1 of 2.1 ± 0.15 s (Fig 3). For this analysis, one subject’s SMA value was > 3 SD from the mean (a true outlier) and was discarded.
Fig 2.
A single subject’s averaged time course of the fMRI % signal intensity change in the visual cortex (RO) by using his amplitude estimate and the group map.
Fig 3.
Mean lower quartile latencies (in seconds ± SEM) by using the group map for 26 subjects.
When single-tailed paired t tests were performed comparing the data sets, there was a significant difference in the mean onset latencies between RO and LO, RO and SMA and RO and LM1, and LO and LM1 (P < .05; Table). The P value for LO and SMA was .055.
When we sought to correlate the RT with the absolute latencies of each of the four regions of interest by using the group map, there was no significant correlation identified. Also there was no correlation between the “latency differences” (differences between each region of interest and another region of interest) of the four areas and the RTs.
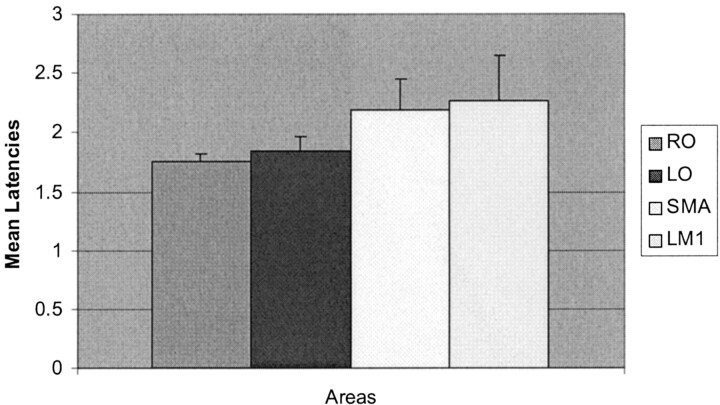
After calculating the mean onset latencies by using the individual processed maps, the results showed that the first regions to activate were the RO and LO visual occipital cortices with mean latency ± SEM of 1.75 ± 0.06 s and 1.84 ± 0.12 s, respectively, followed by the SMA with a mean latency of 2.19 ± 0.25 s and, finally, in the LM1 of 2.26 ± 0.38 s (Fig 4).
Fig 4.
Mean lower quartile latencies (in seconds ± SEM) by using the individual maps for the 26 subjects.
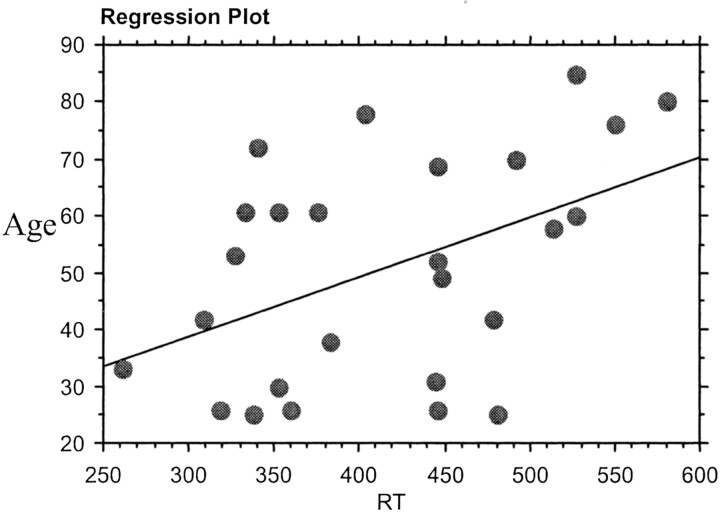
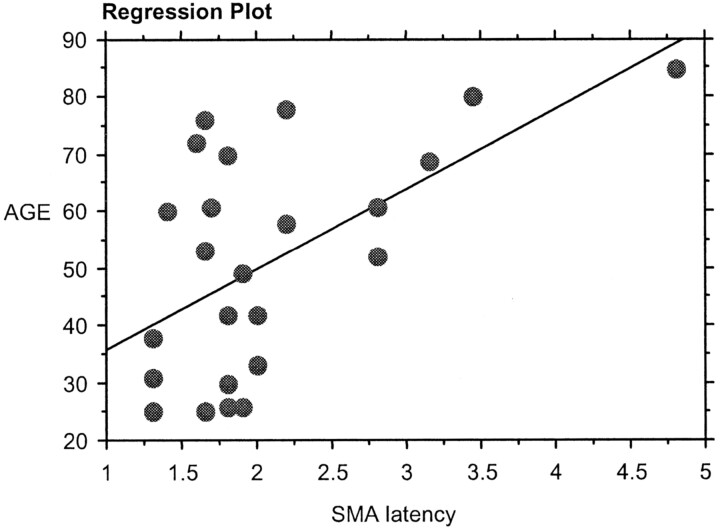
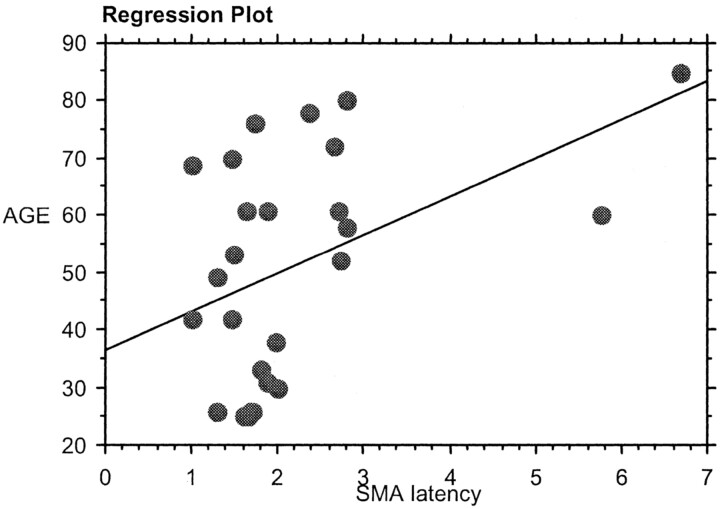
On performing regression analysis between the age and the RT, there was significant positive correlation between the age and the RT (r = 0.46, P < .01; Fig 5). There was also a significant positive correlation (P < .05) between the age and the SMA latency in both the group (Fig 6) and the individual analysis (Fig 7).
Fig 5.
Regression analysis between RT and age.
Fig 6.
Regression analysis between age and the group analysis SMA latency.
Fig 7.
Regression analysis between age and the individual analysis SMA latency.
To verify whether the SPM analysis was biased toward voxels that had delays closer to the default hemodynamic response function, we also performed an analysis incorporating the temporal derivatives (to desensitize the analysis to differences in delays). Visual inspection of the SPM maps from this analysis compared with the analysis performed without this step showed no significant differences in sites or degrees of activation.
Discussion
Timing is essential to the execution of skilled movements, yet our knowledge of the neural systems underlying the timekeeping operations is limited (11). Although psychophysical measurements yield considerable information, they still do not directly reveal the neural substrates or pathways involved in the processing of stimuli (12). fMRI offers the opportunity to graphically and explicitly interrogate the cortical physiology under various stimulation paradigms.
Why Use a Visuomotor Task and an Event-Related Design?
Numerous electrophysiologic, autoradiographic, and blood-flow studies have shown that the brain has specialized spatially segmented areas for functional roles. fMRI is used to segregate and differentiate these functional areas (13). Consequently, by using a simple visuomotor task, we choose our regions of interest to include the RO and LO visual cortices, the SMA and the LM1 to test the time course and latencies of this task. We chose the visuomotor RT task in our experiment because of its simplicity and well-described place in the literature to date. Also this task is well understood, and the fMRI findings can be compared with behavioral studies performed previously (14–18).
We used a single-event design with short-duration stimuli for more consistent responses and fewer vascular artifacts. The longer duration stimuli in a block design paradigm may yield an undesirable macrovascular response from contributions from draining veins, whereas the single-event design physically separates these undesirable responses from the better localizing microvascular response. The event-related design also more readily provides temporally dynamic information as compared with the block design (12). It is also known that this design reduces the effect of anticipation or accommodation that might produce an increase or decrease in neural activity within the motor cortex and SMA before the onset of stimulus (19, 20).
Latency Estimation
The main aim of our study was to differentiate between the latencies of the rising portion of the BOLD hemodynamic response and to test the chronometry and sequence of the neural activity in the areas along the visuomotor pathway. When we performed two-tailed t tests in the group analysis, the differences in the latencies were significant between RO and LO, RO, and SMA as well as RO and LM1 (P < .05). In both the group and the individual analysis for the 26 subjects, our results showed that the timing of cortical activation began in the RO and LO visual occipital cortices, followed by the SMA and, finally, in the motor area. This makes sense empirically and teleologically.
There are currently differing opinions as to how best to evaluate the timing of cortical activation. An early study using a mental rotation fMRI task suggested that the peak or the width of the hemodynamic response should be used to correlate with the RT and not the onset (21). Another study showed that the variability of the onset latencies was small and thus the rising edge would be the most precise indicator of the hemodynamic response (22). Those authors concluded that the width of the response is more a measure of stimulus processing time and that the falling edge of the response seemed particularly variable from trial to trial (22). In agreement, a recent study by using a simple visuomotor task showed that there is marked variability in the hemodynamic response occurring following the peak of the curve, making it a less reliable measure (10). Therefore the prevailing opinion is that measuring the onset of the hemodynamic response is the most reliable for estimating the latency. We used a method of estimating the onset time that uses the entire time course but preferentially weights the rising edge (onset) of the hemodynamic response (10). We then used the lower quartile latency values within a region of interest to provide an estimate of the earliest regional onset of the hemodynamic response.
Researchers have shown that the fMRI signal intensity does not start to change until more than 2 s after the onset of a visual stimulus (23). Others have shown that the typical motor response occurs 4.5 s after the trial onset and that it took 5 s for the hemodynamic response to peak (1).
In our study, having the regions of interest in different vascular territories (middle cerebral artery for the sensorimotor area, anterior cerebral artery for SMA, and posterior cerebral artery for the occipital areas) is one factor that may explain the vasoregulatory capabilities and the hemodynamic latency differences between these areas.
Correlating Latencies and RTs
The RT has often been used as a measure of cognitive processing. Menon et al showed that the delay between the visual area (V1) and SMA activation scaled proportionally with RT across subjects, while the delay between SMA and LM1 did not (12). Thus, they concluded that the delay in response appears to be between V1 and SMA. Our results failed to reproduce this finding, as there were no correlations between latency differences between any of our regions of interest and the RTs of the subjects. We did not find any significant correlation between RT with any of the absolute latencies by using the group map at a threshold t = 5.9. Thus, to further analyze this unexpected finding, we reevaluated this relationship by using the latencies from the individual maps rather than the group map. In the individual analysis, not all the subjects had sufficiently robust activity in some areas to allow calculating their latency individually with the same fixed threshold. Thus our threshold was set at t = 3.2 (a lower threshold than that used in the group analysis) or even lower, to run our program to determine activation latencies. We included the individual analysis in our study to further test whether there is any possible correlation between RT and the latencies of region of interest, but we still did not find any significant correlation. Thus, we must conclude that factors other than cortical hemodynamic latencies account for differences in individual subjects’ RTs.
Factors Affecting RT
This unexpected finding is likely due to many factors, the first of which may be age differences. In our study, our subjects’ ages ranged from 25 to 85 years, with a mean of 51 years. The impact of age on the onset of activation has not been directly studied to date, although there are publications showing how age may affect RT. D’Esposito et al have shown that the number of suprathreshold voxels activated during RT paradigms in older subjects was four times less than that in young subjects (24). These researchers also reported that the mean RT of the elderly subjects who showed no suprathreshold activation had a trend toward being slower than that of the elderly subjects who showed suprathreshold activation.
Other studies have shown that advanced age may be associated with decreased amplitude of activation and have concluded that the amplitude is related to the number of neurons involved in visuomotor task-related processing (25). In our study, there was significant positive correlation between the age and the RT (P < .01). RT increases with age. We found, however, no correlation between RT and the region of interest latencies. Other factors that may influence the RT are the type, intensity, and background of the stimulus, sex, educational level/socioeconomic status, affective state, attentional/arousal state, caffeine usage, exercise level, blood glucose level, cardiovascular status, cardiovascular risk factors, blood alcohol level, and general health of the subjects (2, 26–31). These studies have not directly analyzed the impact of these factors on the onset of the fMRI hemodynamic response, and we could not control for these factors in the small sample reported herein.
Role of SMA
Numerous functions have been suggested for the SMA, including regulation of movement complexity, movement sequencing, self-versus external triggered movements, as well as movement imagination (32). The internal self-generated movement rhythm may be controlled by the SMA as suggested by findings emphasizing the SMA as a key structure for controlling self-triggered movements (5). SMA is activated during both the motor preparation and execution periods. An RT delay could originate in the planning of the movement or in the execution of the movement; thus, the processing duration is expected to vary among subjects (12). The unpredictability of the cueing stimulus during the triggered task may prevent the preparation of the movement at a specific time resulting in a significantly longer mean RT (33). Other researchers have suggested that the SMA is involved in the internal rather than the external guidance of movements (34). The SMA appears to be just one component of a system that appears essential for the timing of internally generated movements (11). Others have found that patients with SMA lesions had an increase in the RT on a sequential digit time task (35).
In our study, the SMA latency was variable in onset in comparison to the LM1 latency in the individual analysis. This may be due to several factors, including 1) this paradigm used an unpredictable cueing stimulus that may have reduced the role of the SMA; 2) the thresholding used in the individual latency analysis was variable for each area studied; 3) in 20 of the 26 subjects no SMA activation was present on the individual SPM activation maps, thereby increasing the “noise” in the system; and 4) the volume of activated voxels in SMA was only 14 voxels in the group map. Nonetheless, we found a significant correlation between the SMA latency and the age of the patient. This may suggest that, if there is an impact of cortical activation timing on RTs in the elderly, it may be based in the SMA rather than in occipital or sensorimotor regions. This may warrant further investigation in larger groups of older subjects with a wider range of RTs.
Disadvantages of fMRI in Temporal Resolution
The disadvantage of fMRI, as well as positron emission tomography, is that the maps produced are not created in real time. They are static representations of the dynamic activity of the brain averaged over a long time period relative to the mental processing scale (12).
There are many technical impediments to the spatial and temporal resolution studies in fMRI, because the cortical signal intensity changes are small (<3%) even at very high magnetic field strengths (12). Even when the patient’s head is restrained to minimize motion, there are still signal intensity fluctuations that may be attributed to cardiac and respiratory events (36).
The repetition rate of the stimulus is another factor affecting the fMRI time response curve as it affects the duration of the recovery and the return of the response back to the baseline and thus may be a factor in differences in results among different studies. In our study, the visual cue appeared on the screen for 0.5 s, at either 20- or 30-s random intervals; otherwise a white fixation crosshair was constantly present in the center of a black background throughout the 6-minute scan. Because inhibition and excitation are both energy-consuming processes, it is not clear that they can be differentiated by using the fMRI response in any single region.
In our study, we calculated an average time course latency for each area for each subject. An averaging approach as used in several studies is valid and more reliable because alignment of the fMRI response can be made to the presentation of the visual cue. Some studies, however, revealed that averaging loses the unique information associated with each individual execution of the task and thus blurs the real timing (12). Other researchers have studied the temporal sequence of neural activity between different regions from the averaged time courses (37). They found that a latency difference is likely related to that of intrinsic hemodynamic responses of different vascular beds and not necessarily due to the order of activation of the different neural substrates in this cognitive task (37). Our study tested regions of interest in three different arterial distributions, which further obfuscates the findings. Also, the draining vasculature (venous side) distorts the measurement of timing because the veins respond several seconds later than the parenchyma as the bolus of oxygenation-altered blood flows from capillaries to the venous system (12).
Saad et al implemented a new method for measuring the temporal delay of fMRI responses and estimated the statistical distribution of the response delays evoked by visual stimuli within and across voxels in the human visual cortex (3). They suggested that across voxels, 47% of the delay variance was the result of fMRI noise, with the remaining variance reflecting fixed differences in response delay among brain sites. This relatively wide range of response delays has been attributed to the delayed flow of oxygenated blood through large veins draining the sites of neuronal activation. The within-voxel delay variance reflects moment-to-moment variations in the response to the stimulus plus fMRI noise. It also reflects fixed differences in response from one brain location to another. These authors found that response delay at a specific voxel may also vary over time. They compared the relative timing between the visual stimulus, the fMRI response, and a reference time series, which represents an ideal fMRI response with no response delay. They found that the fMRI response across activated voxels is delayed by 6.6 s relative to the reference waveform. Also, overall 81% of all responsible voxels showed activation in phase with the stimulus, whereas the remaining voxels showed antiphase, suppressive responses. This phenomenon may contribute to the absence of correlation between RTs and region of interest latencies found in our study.
It is likely that the prime determinants of RT are not central in location (transport of the signal intensity through the brain) but are related to muscle mass, arthritis, and peripheral conduction. Other researchers who have studied different reaction tasks and their relation with electromyography, have shown that increased excitability of the corticospinal output is not required to speed up RTs and that the time taken to discharge cortical output elements is relatively unimportant compared with the time needed to process the sensory (eg, visual) input and link it to the motor output (38). In our study, electromyography was not performed; however, it should be considered in future studies to exclude the peripheral motor output function as a factor that might affect the RT or speed of performance. We suggest that, in an RT task, the central hemodynamic response within the brain is only one part (and possibly a less influential part) of a much more complex input-output loop, which also includes important peripheral components (visual perception, motor output from brain to spinal cord to peripheral nerves to the neuromuscular junction and then the muscle itself) that have greater impact on an individual’s RT.
Conclusion
In conclusion, we were able to determine the sequence of the hemodynamic response in a visuomotor response time task. With both group and individual analyses, we found activation beginning in the visual cortices followed by the SMA and, finally, the primary sensorimotor regions. We found, however, no correlation between the RTs and the specific onset times of the regions of interest or the latency differences between regions of interest. This is most likely due to the lack of sensitivity of fMRI, which is a relatively coarse method, lacking statistical power and measuring hemodynamic delays in seconds and requiring correlation with subjects’ RTs measured in milliseconds. We believe that the data, by showing an absence of correlation between RT and latencies, demonstrate that the impact of peripheral factors (visual perception, visual acuity, muscle mass, muscle strength, joint flexibility, neuromuscular unit integrity, and peripheral transmission of the neuronal signal intensity) may play a larger role than cortical latencies in determining RT.
References
- 1.Rao SM, Mayer AR, Harrington DL. The evolution of brain activation during temporal processing. Nat Neurosci 2001;4:317–323 [DOI] [PubMed] [Google Scholar]
- 2.Jovanovic J, Batanjac J, Jovanovic M. The influence of cardiovascular diseases of the drivers on the occurrence of traffic accidents. Vojnosanit Pregl 1999;56:3–8 [PubMed] [Google Scholar]
- 3.Saad ZS, Kristina MR, Cox RW, DeYoe EA. Analysis and use of fMRI response delay. Hum Brain Mapping 2001;13:74–93 [DOI] [PMC free article] [PubMed] [Google Scholar]
- 4.Coyne AC, Burger MC, Berry JM, Botwinick. Adult age, information processing, and partial report performance. J Genet Psychol 1987;148:219–224 [DOI] [PubMed] [Google Scholar]
- 5.Jancke L, Loose R, Lutz K, Specht K, Shah NJ. Cortical activations during paced finger-tapping applying visual and auditory pacing stimuli. Cog Brain Res 2000;10:51–66 [DOI] [PubMed] [Google Scholar]
- 6.Newman SD, Just MA, Carpenter PA. The synchronization of the human cortical working memory network. Neuroimage 2002;15:810–822 [DOI] [PubMed] [Google Scholar]
- 7.Friston KJ, Holmes A, Worsley K, et al. Statistical parametric maps in functional imaging: a general linear approach. Hum Brain Mapping 1995;2:189–210 [Google Scholar]
- 8.Talaraich J, Tournoux P. Co-planar stereotaxic atlas of the human brain. New York: Thieme Medical Publishers;1988
- 9.Lancaster JL, Woldorff MG, Parsons LM, et al. Automated Talairach atlas labels for functional brain mapping. Human Brain Mapping 2000;10:120–131 [DOI] [PMC free article] [PubMed] [Google Scholar]
- 10.Calhoun V, Adali T, Kraut M, Pearlson G. A weighted least-squares algorithm for estimation and visualization of relative latencies in event-related functional MRI. Magn Resonance Med 2000;44:947–954 [DOI] [PubMed] [Google Scholar]
- 11.Rao SM, Harrington DL, Haaland KY, et al. Distributed neural systems underlying the timing of movements. J Neurosci 1997;17:5528–5535 [DOI] [PMC free article] [PubMed] [Google Scholar]
- 12.Menon RS, Kim S. Spatial and temporal limits in cognitive neuroimaging with fMRI. Trends Cogn Sci 1999;3:207–216 [DOI] [PubMed] [Google Scholar]
- 13.Churchland PS, Sejnowski TJ. Perspectives on cognitive neuroscience. Science 1988;24:741–745 [DOI] [PubMed] [Google Scholar]
- 14.Botwinick J, Brinley JF. Aspects of RT set during brief intervals in relation to age and sex. J Gerontology 1963;17:295–301 [DOI] [PubMed] [Google Scholar]
- 15.Fozard JL, Vercryssen M, Reynolds SL, et al. Age differences and changes in reaction time: the Baltimore Longitudinal Study of Aging. J Gerontol 1994;49:179–189 [DOI] [PubMed] [Google Scholar]
- 16.Gottsdanker R. Age and simple reaction time. J Gerontol 1982;37:342. [DOI] [PubMed] [Google Scholar]
- 17.Welford AT. Reaction time, speed of performance, and age. Ann N Y Acad Sci 1988;515:1–17 [DOI] [PubMed] [Google Scholar]
- 18.Hugin F, Norris AH, Shock NW. Skin reflex and voluntary reaction times in young and old males. J Gerontology 1960;15:388–391 [DOI] [PubMed] [Google Scholar]
- 19.Karni A, Meyer G, Jezzard P, et al. Functional MRI evidence for adult motor cortex plasticity during motor skill learning. Nature 1995;377:155–158 [DOI] [PubMed] [Google Scholar]
- 20.Aguirre GK, Zarahn E, D’Esposito M. The variability of human BOLD hemodynamic responses. Neuroimage 1998;8:360–369 [DOI] [PubMed] [Google Scholar]
- 21.Shepard RN, Metzler J. Mental rotation of three dimensional objects. Science 1971;171:701–703 [DOI] [PubMed] [Google Scholar]
- 22.Savoy RL, et al. Exploring the temporal boundaries of fMRI: measuring responses to very brief visual stimuli. Soc Neurosci 1994;abstract 20:1264 [Google Scholar]
- 23.Savoy RL, et al. Pushing the temporal resolution of fMRI: studies of very brief visual stimuli, onset variability and asynchrony, and stimulus-correlated changes in noise. Soc Magn Reson 1995;abstract 1:450 [Google Scholar]
- 24.D’Esposito M, Zarahn E, Aguirre GK, Rypma B. The effect of normal aging on the coupling of neural activity to the bold hemodynamic response. Neuroimage 1999;10:6–14 [DOI] [PubMed] [Google Scholar]
- 25.McEvoy LK, Pellouchoud E, Smith ME, Gevins A. Neurophysiological signals of working memory in normal aging. Brain Res Cogn Brain Res 2001;11:363–376 [DOI] [PubMed] [Google Scholar]
- 26.Landauer AA, Howat PA. Alcohol and the cognitive aspects of choice reaction time. Psychopharmacology (Berl) 1982;78:296–297 [DOI] [PubMed] [Google Scholar]
- 27.Botwinick J, Storandt M. Cardiovascular status, depressive affect, and other factors in reaction time. J Gerontol 1974;29:543–548 [DOI] [PubMed] [Google Scholar]
- 28.Abrahams JP, Birren JE. Reaction time as a function of age and behavioral predisposition to coronary heart disease. J Gerontol 1973;28:471–478 [DOI] [PubMed] [Google Scholar]
- 29.Botwinick J, Storandt M. Age differences in reaction time as a function of experience, stimulus intensity, and preparatory interval. J Genet Psychol 1973;123:209–217 [DOI] [PubMed] [Google Scholar]
- 30.Mulderink TA, Gitelman DR, Mesulam MM, Parrish TB. On the use of caffeine as a contrast booster for BOLD fMRI studies. Neuroimage 2002;15:37–44 [DOI] [PubMed] [Google Scholar]
- 31.Gruether R, Ugurbil K, Seaquist ER. Effect of acute hyperglycemia on visual cortical activation as measured by functional MRI. J Neurosci Res 2000;62:279–285 [DOI] [PubMed] [Google Scholar]
- 32.Roland PE, Zilles K. The developing European computerized human brain database for all imaging modalities. Neuroimage 1996;1:S39–S47 [DOI] [PubMed] [Google Scholar]
- 33.Jenkins H, Jahanshahi M, Jueptner M, et al. Self-initiated versus externally triggered movements. Brain 2000;123:1216–1228 [DOI] [PubMed] [Google Scholar]
- 34.Tanji J. The supplemental motor area in the cerebral cortex. Neurosci Res 1994;19:251–268 [DOI] [PubMed] [Google Scholar]
- 35.Halsband U, Ito N, Tanji J, Freund HJ. The role of premotor cortex and the supplemental motor area in the temporal control of movement in man. Brain J Neurol 1993;116:243–266 [DOI] [PubMed] [Google Scholar]
- 36.Hu X, Le TH, Parrish T, Erhard P. Retrospective estimation and correction of physiological fluctuation in functional MRI. Magn Reson Med 1995;34:210–221 [DOI] [PubMed] [Google Scholar]
- 37.Buckner RL, Bandettini PA, O’Craven KM, et al. Detection of cortical activation during averaged single trials of a cognitive task using functional magnetic resonance imaging. Proc Natl Acad Sci U S A 1996;93:14878–14883 [DOI] [PMC free article] [PubMed] [Google Scholar]
- 38.Touge T, Taylor JL, Rothwell JC. Reduced excitability of the cortico-spinal system during the warning period of a reaction time task. Electroencephalogr Clin Neurophysiol 1998;109:489–495 [DOI] [PubMed] [Google Scholar]


