

Abstract
BACKGROUND AND PURPOSE: Magnetization transfer ratio (MTR) histogram analysis and volumetric MR imaging are sensitive tools with which to quantify the tissue destructive effects in patients with white matter or neurodegenerative disease. Our purpose was to determine whether whole brain MTR and fractional brain parenchyma volume measurements are altered in HIV-1-infected patients who are neurologically symptomatic and in those who are asymptomatic.
METHODS: We performed MR imaging and MTR studies of 15 neurologically symptomatic (seven patients) and asymptomatic (eight patients) HIV-1-seropositive patients and compared their findings with those of 10 seronegative normal control participants. MTR was computed on the basis of whole brain parenchyma segmented by using thin section dual echo MR images.
RESULTS: The loss of brain tissue, indicated by fractional brain parenchyma volume, was more pronounced in neurologically symptomatic patients (P = .003) but not in asymptomatic patients (P = .23) when compared with control participants. As for whole brain MTR histogram analysis, both patient groups showed significant decrease in mean (P = .02) and median (P ≤ .009) values, compared with normal control participants. There was a trend toward positive correlation (r ≥ 0.56) between MTR histogram statistics and fractional brain parenchyma volume.
CONCLUSION: Our results suggest that MTR histogram analysis is sensitive in detecting early involvement in neurologically asymptomatic patients with HIV and may, therefore, be used as a combined tool with volumetric measurement, which showed significant tissue loss only in symptomatic patients, to assess various stages of brain damage induced by HIV.
HIV-related dementia is associated with the release of neurotoxic metabolites and cytokines by HIV-activated macrophages and microglia within the CNS (1–4), which results in cell loss and, ultimately, brain atrophy (5–7). HIV-1 replication within CNS begins shortly after infection, but neurologic symptoms associated with progressive cognitive, motor, and behavioral dysfunction typically occur during the late stages of disease in HIV-infected patients (8). White matter lesions and significant brain atrophy are two features most commonly observed in patients with HIV-1-associated dementia in neuroimaging studies, and although HIV-induced neurodegeneration is a diffuse process, regional variations may occur (9–11). The aim of our study was to determine the whole brain tissue loss and subtle pathologic changes by using volumetric MR imaging and magnetization transfer ratio (MTR) measurements, respectively, in patients with mild neurologic symptoms and those without neurologic symptoms. The identification of such changes in whole brain would eliminate the regional sampling bias and have implications for the presence and severity of total tissue destructive changes during the early stage of disease with HIV-1 infection before and after functional impairment. Our assumptions were that subtle changes (ie, inflammation, demyelination) might occur and be detected by MTR histogram analysis during the early phase of the disease and that atrophy might occur later and be associated with cognitive symptoms.
Methods
Participants
We examined 15 HIV-1-seropositive patients (12 men and three women), eight of whom were neurologically asymptomatic and seven of whom were neurologically symptomatic. Ten age-matched volunteers (six men and four women) with no history of neurologic illness served as control participants, with a mean age of 40.3 years (age range, 23–56 years). The mean age of the HIV-symptomatic patients was 40.1 years (age range, 22–56 years); the mean age of the HIV-asymptomatic patients was 34.1 years (age range, 28–40 years). The patients had been classified as neurologically symptomatic and asymptomatic according to the following criteria: patients with neurologically symptomatic HIV were scored as having AIDS dementia complex stage ≥0.5 by neurologic examination and neuropsychological testing (NPZ-8 battery) (12), which represents the average of the individual Z scores for the eight tests. By the same criteria, patients with neurologically asymptomatic HIV received an AIDS dementia complex score of zero. The NPZ-8 scores of the patients ranged from 0 to 15. Eight seropositive patients had an AIDS dementia complex score of 0, five had a score of 0.5, and two had a score of 1. All patients were medically stable, ambulatory, and functioning independently. No patients with active drug or alcohol abuse were included in the study. Six of seven symptomatic patients were receiving antiretroviral therapy, and one was not receiving any antiviral treatment. Seven of eight of the asymptomatic patients were receiving antiretroviral therapy. No patients were receiving corticosteroids nor had any patients been receiving long-term corticosteroids before study entry. The study was approved by our institutional review board, and all patients and normal control participants who were included in the study signed informed consent to participate after receiving an explanation of all procedures.
MR Imaging
All MR imaging examinations were performed on the same 1.5-T clinical MR imaging system (Signa; GE Medical Systems, Milwaukee, WI) with a quadrature transmitter-receiver head coil. Contiguous transverse 3-mm-thick dual echo fast spin-echo proton density-weighted and T2-weighted (2500/18, 90 [TR/effective TE]; one signal acquired) images were obtained with a 192 × 256 matrix and a 22-cm field of view. The echo train length was eight. To cover the whole brain, >50 sections were acquired and corresponding acquisitions were obtained. Magnetization transfer imaging was performed by using a standard 3D gradient-echo sequence (106/5; flip angle, 12 degrees) modified by the addition of a magnetization transfer pulse. The field of view was 22 cm, the matrix size was 128 × 256, and the section thickness was 5 mm. Magnetization transfer contrast was achieved by applying a saturation pulse, which consisted of a 19-ms sync-shaped RF pulse during each TR. Two consecutive sets of transverse images, one with and one without the magnetization transfer saturation pulse, were obtained to calculate MTR and construct its histogram.
Image Processing
The first (proton density-weighted) and second (T2-weighted) echoes of the fast spin-echo sequence and magnetization transfer images in each study were transferred to a Sun Sparc workstation (Sun Microsystems, Mountain View, CA) for image processing. The segmentation is based on the concept of fuzzy connectivity (13) incorporated in a software system called 3DVIEWNIX (14). The process begins with the segmentation of intracranial brain by using dual echo images. An angle image of CSF is then created from both proton density- and T2-weighted data sets based on segmented intracranial contents (15). This method creates a voxel-by-voxel image by using the formula Iangle = tan−1 (IT2/IPD), where Iangle, IT2, and IPD are the intensities of the voxels from the angle and from the T2-weighted and proton density-weighted images, respectively. The resulting angle image has relatively homogenous CSF intensity values that can be easily thresholded to produce a CSF-only image and volume. The brain parenchyma volume image was obtained by subtracting the CSF image from the total intracranial binary image. The volumes of brain parenchyma, CSF, and total intracranial volume image were then calculated on the basis of associated binary images. This method has been validated previously by using a repeat imaging test, and the known coefficient of variation (median) was 0.23% for brain parenchyma volume and 0.45% for CSF volume (16). Lesions, if presented, were identified as 3D fuzzy objects that were segmented by using a validated semiautomated computerized method with a known lower coefficient of variation <1% (15). Lesions, however, that were excluded by the program from brain parenchyma were added in the calculation of the total tissue volume of brain parenchyma. To normalize for head size differences among participants, fractional brain parenchyma volume was computed as the percentage of brain parenchyma volume within the volume of the intracranial contents.
The computation of MTR used both segmented whole brain parenchyma volume images without lesions and magnetization transfer images. After the interpolation (14) of magnetization transfer images and fast spin-echo images, we registered the proton attenuation-weighted image with the magnetization transfer control (unsaturated) image, because they have similar intensity patterns, by using an intensity correction method (17). This allowed translation and rotation in 3D and generated the rigid transformation to the segmented tissue volume image to match them with the magnetization transfer images. Once registered, for each voxel in the brain parenchyma volume image, the MTR was calculated by using the following expression: MTR = [(Mo - Ms)/Mo] × 100%, where Mo and Ms represent the signal intensity of the voxel with saturation pulse off and on, respectively (18). The MTR histogram of whole brain parenchyma was then generated, and the peak height was normalized using each histogram frequency value (ie, the total number of voxels with a certain MTR value) divided by the total number of voxels in the sample. The peak height of the histogram was determined as a measure of the frequency of appearance in the most common MTR value.
Statistical Analysis
Least squares regression was used to assess the relationship of each MTR histogram statistic with patient age and sex. Because no statistically significant relationships were observed in the given range of age and sex, patient and control groups were compared in terms of each MTR statistic without adjustment for age or sex differences. After this analysis, the independent sample t test was used to make the group pair-wise comparisons with Satterthwaite correction for unequal variances. Pearson product-moment correlation coefficients were also used to assess the relationship between volume measures (lesion and brain parenchyma) and MTR histogram statistics.
Results
No statistically significant interactions between disease status and either age or sex were noted, and neither age nor sex was significantly associated with any of the MTR histogram statistics in this study with a certain age range. None of the normal control participants had any abnormalities shown on MR images. However, the total T2 lesion volume in symptomatic patients (mean ± SD, 4.6 ± 6.9 cm3) was larger than that in asymptomatic patients (0.1 ± 0.2 cm3), although the difference did not reach statistical significance (P = .14), indicating the greater variability of lesions in these two patient groups. We found a significant difference of fractional brain parenchyma volume between the symptomatic patient group and either the control group (P = .003) or the asymptomatic group (P = .02), but no significant difference between asymptomatic patients and control participants was noted (Table 1). One section of segmented volume images of brain parenchyma and CSF from one person in each group is shown in Fig 1, in which significant brain atrophy was identified in the symptomatic patient.
Comparisons of MTR and Fractional Brain Parenchyma Volume Statistics (Mean ± SD) in Groups of Normal Control Participants and Asymptomatic and Symptomatic Patients With HIV
| Measurements | Control | Asymptomatic | Symptomatic |
P Values |
||
|---|---|---|---|---|---|---|
| Control vs. A | Control vs. S | A vs. S | ||||
| Mean (%) | 32.1 ± 0.5 | 31.3 ± 0.7 | 29.7 ± 2.0 | .02 | .02 | .09 |
| Median (%) | 33.8 ± 0.7 | 32.8 ± 0.7 | 31.6 ± 1.6 | .006 | .009 | .12 |
| Peak height (10−3) | 105.7 ± 9.9 | 108.9 ± 11.3 | 92.7 ± 15.1 | .54 | .07 | .04 |
| fBPV (%) | 88.3 ± 3.4 | 85.3 ± 4.7 | 76.5 ± 6.7 | .15 | .003 | .02 |
Note.—A indicates asymptomatic; S, symptomatic; fBPV, fractional brain parenchyma volume.
Fig 1.
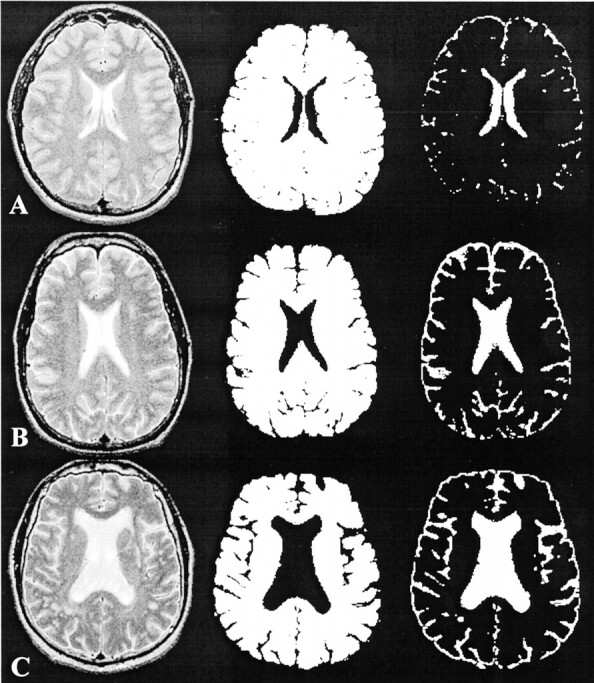
T2-weighted MR images (left), segmented brain parenchyma volume images (middle), and CSF volume images (right). The loss of brain parenchyma, as reflected by the enlargement of ventricles and sulci, was most apparent in the symptomatic patient.
A, Normal control participant.
B, Asymptomatic patient.
C, Symptomatic patient.
Regarding MTR histogram statistics (Table 1), a significant difference was found in whole brain parenchyma MTR histogram mean (P = .02) and median (P ≤ .009) between both groups of HIV-1-infected patients and normal control participants (Fig 2), suggesting that abnormalities could occur during the very early stage of disease in the absence of neurologic symptoms. However, the first quartile, third quartile, and peak location of MTR histogram also showed significant differences between symptomatic patients with controls (P = .04) and between asymptomatic patients with controls (P = .04). Compared with the asymptomatic patients, symptomatic patients had a lower peak height of MTR histogram (P = .04).
Fig 2.

MTR histograms from asymptomatic and symptomatic patients with HIV and from normal control participants. Histograms from two patient groups were shifted to the left toward the lower MTR values. Normalized peak height was generally lower for symptomatic patients compared with the other two groups.
Pearson product-moment correlation was used to identify MTR histogram statistics predictive effects of MR imaging volume measurements in the combined symptomatic and asymptomatic patient group (n = 15). There were moderate positive correlations (P ≤ .03) between fractional brain parenchyma volume and MTR histogram mean (r = 0.58), median (r = 0.57), and peak height (r = 0.56), indicating that subtle pathologic changes in brain may have predictive values for brain atrophy in HIV-1-infected patients. However, lesion volume was not associated with either fractional brain parenchyma volume or MTR histogram statistics in these patients.
Discussion
The data in this study showed the feasibility of generating, on a whole brain basis, quantitative measures of tissue damage during the early phase of HIV disease with mild cognitive symptoms (AIDS dementia complex score, 0.5–1) or without cognitive symptoms by using volumetric MR imaging and MTR histogram analysis. The study was motivated by previous work showing that the MTR is abnormally low in lesions (19) and normal appearing white matter (20) in patients with HIV-1 infection and that the region-specific cerebral volume loss is detected in the disease with HIV infection (21). Our results extend these earlier findings to a global index of disease burden and emphasize that both microscopic (MTR) and macroscopic (atrophy) assessments are useful markers of HIV-1-associated brain injury. Imaging markers of the amount of injury are necessary to assess the natural history of disease evolution and their relationship with clinical status and are crucial for monitoring response to treatment.
Our results indicate that whole brain MTR measurements significantly differed between each patient group and the seronegative control group. Our observations of abnormal MTR in neurologically asymptomatic patients may reflect the pathologic processes occurring microscopically before the neurocognitive symptoms appear. Most previous imaging studies (19, 22, 23) evaluated tissue damage in patients with HIV primarily during the late stages of the disease, when severe cognitive impairments were apparent. Recently, however, with the development of more sensitive techniques, such as MR spectroscopy and magnetization transfer imaging, more investigators have turned to study subtle abnormalities in the brains of HIV-1 patients relatively early during the disease process. Meyerhoff et al (24) detected higher choline-containing metabolites in subcortical brain in cognitively and clinically asymptomatic patients with HIV, which was thought to reflect membrane damage after HIV infection (24, 25). This has been also observed pathologically (3, 26). Magnetization transfer imaging is well suited to the study of normal appearing white matter tissue of MS (27, 28) because of its ability to detect small abnormal changes in water signal intensity due to magnetization transfer by means of selective saturation of macromolecular bounded water in regions undergoing magnetization transfer (29). Our results of MTR in neurologically asymptomatic patients were consistent with the findings identified by MR spectroscopy (24, 30). The mechanism of MTR changes in HIV-infected brain tissue is still not well known but pathologically may include inflammation (macrophage and microglial activation), demyelination, and neuronal injury (dendritic) during the early stages of the disease process.
The findings of this study with regard to brain volume by using fractional measure showed significant differences between normal control participants and patients but only in symptomatic patients whose cognitive symptoms are mild (AIDS dementia complex score, 0.5–1). The lack of significant atrophy in asymptomatic patients in this study may further suggest that cerebral atrophy is significantly associated with HIV-induced dementia (31). Previous work from our group with this patient cohort showed that fractional brain parenchyma volume shows significant correlation with neuropsychological tests of motor function in HIV-1-infected patients (32). Compared with normal control participants, the decreased MTR values in asymptomatic patients with no significant volume loss imply that these abnormalities may occur microscopically and may not cause tissue loss during the course of disease. This may also indicate that MTR is a more sensitive imaging marker in detecting early tissue destructive changes of brain in cases of disease with HIV infection. The pathogenesis of brain atrophy in patients with HIV is still not well known. However, several studies (5, 7, 33) have shown that HIV does not cause brain atrophy directly but virus replication in vulnerable brain regions drives local neurotoxin (ie, quinolinic acid) biosynthesis, which may eventually induce brain atrophy. Brain tissue loss seems to be an accumulative net effect from all neurotoxin-induced chronic neurodegenerative processes in patients with HIV and may cause symptoms. Because brain atrophy was found in various regions and most likely occurs in subcortical gray matter, frontal lobe, and parietal white matter (9, 10, 34), our whole brain parenchyma volume measure could be an imaging surrogate marker to correlate with the amount of disease progression and neurologic symptoms (16).
Although T2 lesion volume was observed to be substantially lower for asymptomatic patients (mean, 0.1 cm3) than for symptomatic patients (mean, 4.6 cm3), the difference did not reach statistical significance partly because of the high variability observed in this study. We did not find significant correlations between T2 lesion volume and either fractional brain parenchyma volume or MTR histogram statistics in this study. This finding agrees with those of previous reports that T2 white matter abnormalities do not correlate with neuropsychologic variables in HIV-positive patients (31, 35). One possible explanation is that not all abnormalities can be seen on conventional MR images, as indicated by abnormal MTR findings in normal appearing brain tissues in this study. However, we observed the positive correlations in patients between MTR histogram parameters and fractional brain parenchyma volume, suggesting that these microscopic changes may contribute to the brain tissue loss in patients. Further, we showed brain atrophy in the symptomatic group; even their cognitive function was mildly impaired in this study. This indicates that the early use of MTR histogram analysis in clinically asymptomatic patients without detectable cognitive impairment may be helpful to predict irreversible brain atrophy and to guide modification of therapy.
The findings of differences in fractional brain parenchyma volume and MTR histogram measurements in control and different patient groups suggest that the extent and severity of the pathologic process could be graded by the new technologies, such as MTR and volumetric MR imaging. Because peak height is considered as an indicator of the residual amount of normal tissue in a given part of brain (36) and was thought to be inversely related to the amount of parenchyma affected by the disease, the significantly lower fractional brain parenchyma volume and MTR histogram peak height in symptomatic patients (Figs 1 and 2) indicate wide pathologic involvement, compared with asymptomatic patients. This is consistent with their different clinical appearance reflected by cognitive heterogeneity. However, how and when HIV produces imaging-detectable changes and produces brain functional impairments are still poorly understood. It may be argued that brain atrophy could be seen during the very early phase before cognitive impairment (37) in HIV-infected patients. We did not find significant atrophy in asymptomatic patients compared with normal control participants. Although we carefully identified the cognitive performance and found no age effect on MTR in the current range of age in patients, the number of patients was small, the symptomatic patient group was older than the asymptomatic patient group, and the influence of atrophy on MTR changes in patients is not yet known. Further study of a larger, age-matched cohort may be required to consolidate these preliminary observations of MTR and brain atrophy measurements in patients with HIV.
Conclusion
MTR measurements and volumetric MR imaging show the subtle and gross structural changes in HIV-1-infected cognitive normal and abnormal patients. Analysis from only individual lesions or regions lacks specificity with respect to all different types of pathologic abnormalities and may not be a good marker for the presence of the disease that could be widespread. Our data suggest that global measures of MTR and brain atrophy provide valuable and noninvasive assessment of the various stages of HIV infection. It is also likely that MTR may have potential value in detecting early pathologic changes and guiding therapy in patients without clinical symptoms and before significant loss of brain tissue.
Footnotes
Supported in part by grant NS 29029 from the National Institutes of Health.
References
- 1.Heyes MP, Jordan EK, Lee K, et al. Relationship of neurologic status in macaques infected with the simian immunodeficiency virus to cerebrospinal fluid quinolinic acid and kynurenic acid. Brain Res 1992;570:237–250 [DOI] [PubMed] [Google Scholar]
- 2.Stone TW. Neuropharmacology of quinolinic and kynurenic acids. Pharmacol Rev 1993;45:309–379 [PubMed] [Google Scholar]
- 3.Masliah E, Ge N, Morey M, DeTeresa R, Terry RD, Wiley CA. Cortical dendritic pathology in human immunodeficiency virus encephalitis. Lab Invest 1992;66:285–291 [PubMed] [Google Scholar]
- 4.Pemberton LA, Kerr SJ, Smythe G, Brew BJ. Quinolinic acid production by macrophages stimulated with IFN-gamma, TNF-alpha, and IFN-alpha. J Interferon Cytokine Res 1997;17:589–595 [DOI] [PubMed] [Google Scholar]
- 5.Masliah E, Ge N, Mucke L. Pathogenesis of HIV-1 associated neurodegeneration. Crit Rev Neurobiol 1996;10:57–67 [DOI] [PubMed] [Google Scholar]
- 6.Kerr SJ, Armati PJ, Guillemin GJ, Brew BJ. Chronic exposure of human neurons to quinolinic acid results in neuronal changes consistent with AIDS dementia complex. AIDS 1998;12:355–363 [DOI] [PubMed] [Google Scholar]
- 7.Heyes MP, Ellis RJ, Ryan L, et al. Elevated cerebrospinal fluid quinolinic acid levels are associated with region-specific cerebral volume loss in HIV infection. Brain 2001;124:1033–1042 [DOI] [PubMed] [Google Scholar]
- 8.Gendelman HE, Lipton SA, Epstein L, Swindells S. HIV neurocognitive disorders. In: Gendelman HE, Lipton SA, Epstein L, Swindells S, eds. The Neurology of AIDS. New York: Chapman and Hall;1998. :499–523
- 9.Kieburtz K, Ketonen L, Cox C, et al. Cognitive performance and regional brain volume in human immunodeficiency virus type 1 infection. Arch Neurol 1996;53:155–158 [DOI] [PubMed] [Google Scholar]
- 10.Aylward EH, Henderer JD, McArthur JC, et al. Reduced basal ganglia volume in HIV-1-associated dementia: results from quantitative neuroimaging. Neurology 1993;43:2099–2104 [DOI] [PubMed] [Google Scholar]
- 11.Aylward EH, Brettschneider PD, McArthur JC, et al. Magnetic resonance imaging measurement of gray matter volume reductions in HIV dementia. Am J Psychiatry 1995;152:987–994 [DOI] [PubMed] [Google Scholar]
- 12.McArthur JC, Sacktor N, Selnes O. Human immunodeficiency virus-associated dementia. Semin Neurol 1999;19:129–150 [DOI] [PubMed] [Google Scholar]
- 13.Udupa JK, Samarasekera S. Fuzzy connectedness and object definition: theory, algorithms and applications in imaging segmentation. Graph Models Image Proc 1996. :480–489
- 14.Udupa JK, Odhner D, Samarasekera S. 3DVIEWNIX: an open, transportable, multidimensional, multimodality, multiparametric imaging software system. Proc SPIE 1994. :58–73
- 15.Udupa JK, Wei L, Samarasekera S, Miki Y, van Buchem MA, Grossman RI. Multiple sclerosis lesion quantification using fuzzy-connectedness principles. IEEE Trans Med Imaging 1997;16:598–609 [DOI] [PubMed] [Google Scholar]
- 16.Ge Y, Grossman RI, Udupa JK, et al. Brain atrophy in relapsing-remitting multiple sclerosis and secondary progressive multiple sclerosis: longitudinal quantitative analysis. Radiology 2000;214:665–670 [DOI] [PubMed] [Google Scholar]
- 17.Woods R, Mazziotta J, Cherry S. MRI-PET registration with automated algorithm. J Comput Assist Tomogr 1993;17:536–546 [DOI] [PubMed] [Google Scholar]
- 18.Dousset V, Grossman RI, Ramer KN, et al. Experimental allergic encephalomyelitis and multiple sclerosis: lesion characterization with magnetization transfer imaging [published erratum appears in Radiology 1992;183:878]. Radiology 1992;182:483–491 [DOI] [PubMed] [Google Scholar]
- 19.Dousset V, Armand JP, Lacoste D, et al. Magnetization transfer study of HIV encephalitis and progressive multifocal leukoencephalopathy: Groupe d’Epidemiologie Clinique du SIDA en Aquitaine. AJNR Am J Neuroradiol 1997;18:895–901 [PMC free article] [PubMed] [Google Scholar]
- 20.Filippi CG, Ulug AM, Ryan E, Ferrando SJ, van Gorp W. Diffusion tensor imaging of patients with HIV and normal-appearing white matter on MR images of the brain. AJNR Am J Neuroradiol 2001;22:277–283 [PMC free article] [PubMed] [Google Scholar]
- 21.Stout JC, Ellis RJ, Jernigan TL, et al. Progressive cerebral volume loss in human immunodeficiency virus infection: a longitudinal volumetric magnetic resonance imaging study: HIV Neurobehavioral Research Center Group. Arch Neurol 1998;55:161–168 [DOI] [PubMed] [Google Scholar]
- 22.Brightbill TC, Post MJ, Hensley GT, Ruiz A. MR of Toxoplasma encephalitis: signal characteristics on T2-weighted images and pathologic correlation. J Comput Assist Tomogr 1996;20:417–422 [DOI] [PubMed] [Google Scholar]
- 23.Thurnher MM, Thurnher SA, Schindler E. CNS involvement in AIDS: spectrum of CT and MR findings. Eur Radiol 1997;7:1091–1097 [DOI] [PubMed] [Google Scholar]
- 24.Meyerhoff DJ, Bloomer C, Cardenas V, Norman D, Weiner MW, Fein G. Elevated subcortical choline metabolites in cognitively and clinically asymptomatic HIV+ patients. Neurology 1999;52:995–1003 [DOI] [PubMed] [Google Scholar]
- 25.Tracey I, Carr CA, Guimaraes AR, Worth JL, Navia BA, Gonzalez RG. Brain choline-containing compounds are elevated in HIV-positive patients before the onset of AIDS dementia complex: a proton magnetic resonance spectroscopic study [published erratum appears in Neurology 1996;46:1787]. Neurology 1996;46:783–788 [DOI] [PubMed] [Google Scholar]
- 26.Wiley CA, Achim C. Human immunodeficiency virus encephalitis is the pathological correlate of dementia in acquired immunodeficiency syndrome. Ann Neurol 1994;36:673–676 [DOI] [PubMed] [Google Scholar]
- 27.Filippi M, Rocca MA, Martino G, Horsfield MA, Comi G. Magnetization transfer changes in the normal appearing white matter precede the appearance of enhancing lesions in patients with multiple sclerosis. Ann Neurol 1998;43:809–814 [DOI] [PubMed] [Google Scholar]
- 28.Leary SM, Silver NC, Stevenson VL, Barker GJ, Miller DH, Thompson AJ. Magnetisation transfer of normal appearing white matter in primary progressive multiple sclerosis. Mult Scler 1999;5:313–316 [DOI] [PubMed] [Google Scholar]
- 29.Pike GB. Magnetization transfer imaging of multiple sclerosis. Ital J Neurol Sci 1997;18:359–365 [DOI] [PubMed] [Google Scholar]
- 30.Suwanwelaa N, Phanuphak P, Phanthumchinda K, et al. Magnetic resonance spectroscopy of the brain in neurologically asymptomatic HIV-infected patients. Magn Reson Imaging 2000;18:859–865 [DOI] [PubMed] [Google Scholar]
- 31.Broderick DF, Wippold FJ, Clifford DB, Kido D, Wilson BS. White matter lesions and cerebral atrophy on MR images in patients with and without AIDS dementia complex. AJR Am J Roentgenol 1993;161:177–181 [DOI] [PubMed] [Google Scholar]
- 32.Patel SH, Kolson DL, Glosser G, et al. Correlation between percentage of brain parenchymal volume and neurocognitive performance in HIV-infected patients. AJNR Am J Neuroradiol 2002;23:543–549 [PMC free article] [PubMed] [Google Scholar]
- 33.Sardar AM, Hutson PH, Reynolds GP. Deficits of NMDA receptors and glutamate uptake sites in the frontal cortex in AIDS. Neuroreport 1999;10:3513–3515 [DOI] [PubMed] [Google Scholar]
- 34.Heindel WC, Jernigan TL, Archibald SL, Achim CL, Masliah E, Wiley CA. The relationship of quantitative brain magnetic resonance imaging measures to neuropathologic indexes of human immunodeficiency virus infection. Arch Neurol 1994;51:1129–1135 [DOI] [PubMed] [Google Scholar]
- 35.Dooneief G, Bello J, Todak G, et al. A prospective controlled study of magnetic resonance imaging of the brain in gay men and parenteral drug users with human immunodeficiency virus infection. Arch Neurol 1992;49:38–43 [DOI] [PubMed] [Google Scholar]
- 36.van Buchem MA, Udupa JK, McGowan JC, et al. Global volumetric estimation of disease burden in multiple sclerosis based on magnetization transfer imaging. AJNR Am J Neuroradiol 1997;18:1287–1290 [PMC free article] [PubMed] [Google Scholar]
- 37.Elovaara I, Poutiainen E, Raininko R, et al. Mild brain atrophy in early HIV infection: the lack of association with cognitive deficits and HIV-specific intrathecal immune response. J Neurol Sci 1990;99:121–136 [DOI] [PubMed] [Google Scholar]