

Abstract
BACKGROUND AND PURPOSE: Multifocal microhemorrhages have been reported to be commonly found in the brain of patients with systemic hypertension and spontaneous brain hemorrhage. The factors associated with these lesions detected on T2*-weighted gradient-echo images were examined to determine whether these lesions serve to indicate different types of microangiopathy and to predict a patient’s risk for symptomatic hemorrhage.
METHODS: The study population consisted of 2164 patients who underwent 2416 consecutive brain MR imaging studies performed during 3 years. The patients with intracerebral hemorrhages due to vascular malformations, neoplasms, trauma, or intracranial surgery and those with incomplete medical records were excluded; 2019 cases were analyzed.
RESULTS: The overall incidence of microhemorrhages was 9.8%, predominantly in the lentiform nucleus (n = 96), thalamus (n = 88), and cortical-subcortical region (n = 93). Presence of microhemorrhages had the highest significant correlation with history of hemorrhagic stroke (P < .0001); advancing age, hypertension, and prominent white matter hyperintensity on T2-weighted images had the next highest significant correlation. Cortical-subcortical microhemorrhages were more frequently observed in patients who had previous lobar hemorrhagic stroke (P < .005). Among 139 patients with microhemorrhages who could be clinically followed up for more than 1 month, four (2.9%) had new hemorrhagic stroke.
CONCLUSION: The presence of microhemorrhages may be not only a direct marker of bleeding-prone small-vessel diseases but also an indicator of different types of microangiopathy and a predictor of further hemorrhagic stroke.
T2*-weighted gradient-echo MR imaging is useful in the detection of old intracerebral hemorrhage, which causes marked signal intensity loss because of magnetic susceptibility effect (1, 2). Multifocal small hypointense lesions on T2*-weighted gradient-echo images have been reported to be commonly observed in the brain of patients with systemic hypertension, spontaneous brain hemorrhage, and ischemic lesions (1–10). A recent histopathologic study (5) confirmed that these small hypointense lesions seen on gradient-echo images indicate previous extravasation of blood and most are asymptomatic. These lesions are rarely observed in a healthy elderly population (11, 12).
Both cerebral amyloid angiopathy (CAA) and hypertensive microangiopathy were commonly observed in specimens from the patients with hypointense lesions seen on T2*-weighted gradient-echo images (5, 6). Therefore, it has been suggested that the presence of these lesions may be a direct marker of bleeding-prone small-vessel diseases (5, 6, 13) or even a predictor of a patient’s risk for symptomatic hemorrhage, as are clinical findings such as systemic hypertension. The strong relation of these hypointense lesions with systemic hypertension, which is the leading condition associated with brain hemorrhage (14), may also support this assumption. However, the incidence of microhemorrhages in patients who have previously had hemorrhagic stroke ranges from 30% to 80% (2, 6, 7, 9, 10), probably because of the small size of patient groups analyzed and differences in patient selection. For the study reported herein, we examined the factors associated with microhemorrhages revealed by T2*-weighted gradient-echo imaging to determine whether the distribution of microhemorrhages can be used to determine the pathologic cause of these micorhemorrhages and whether presence of microhemorrhages is associated with increased risk of hemorrhagic stroke.
Methods
Participants and Clinical Data Collection
During the period from April 1998 through March 2001, 2416 MR imaging studies of the brain were performed for 2164 patients at our hospital. The charts and MR images of all the patients were carefully reviewed. Brain stroke consisted of physician-diagnosed symptomatic infarction and hemorrhages, and transient ischemic attack was not considered as a brain stroke. Patient self-report of stroke was accepted only when the medical record or physician confirmation was available. Hemorrhagic stroke was defined as spontaneous intracerebral bleeding confirmed by CT without evidence of any kind of vascular malformation, cavernous angioma, brain tumor, surgical intervention, or trauma as the source of the hematoma. The hemorrhages were grouped by cerebral regions as lobar hemorrhages (cortical and subcortical) and deep hemorrhages (involving basal ganglia, thalamus, cerebellum, or brain stem). Patients were considered to have systemic hypertension if their blood pressure readings had repeatedly exceeded 140 mm Hg systolic or 90 mm Hg diastolic, if they were currently receiving antihypertensive therapy, or if they had medical histories of systemic hypertension. Diabetes mellitus was diagnosed by a fasting serum glucose concentration of >140 mg/dL or if the patient was receiving current treatment.
Among the 2164 patients considered, 145 patients were excluded from further analysis because of incomplete medical records (n = 81), clinical or radiographic appearance of intracerebral hemorrhages due to head trauma (n = 35), arteriovenous malformation or cavernous angioma (n = 3), or previous intracranial surgery (n = 26). Thus, 2019 patients remained (1141 men and 878 women; mean age, 56.6 ± 15.9 years; age range, 0–96 years). If a patient underwent more than two MR imaging examinations, the first MR imaging study was analyzed. No patients in our study were suggested to be abusers of drugs such as heroin or cocaine. The ethical principles put forth in the Declaration of Helsinki were followed.
MR Images
All participants were studied with the same 1.0-T MR imager (Magnex; Shimadzu, Kyoto, Japan). Images were obtained with axial T1-weighted spin-echo (450/15 [TR/TE]), proton density-weighted and T2-weighted fast spin-echo (4000/20, 100; echo train length, eight), and T2*-weighted gradient-echo (1000/30; flip angle, 20 degrees) sequences. The matrix was 256 × 192, and section thickness was 5 mm with an intersection gap of 2.5 mm for all pulse sequences performed. When a possibility of brain tumor or venous malformation existed, contrast-enhanced T1-weighted MR images were additionally obtained (Magnevist; Nihon Schering, Osaka, Japan).
Images were reviewed by a single investigator (Y.T.). The scoring of hypointense lesions on the T2*-weighted gradient-echo images was performed by counting the lesions that were considered to be abnormal. These lesions were defined as small hypointense areas (<10 mm in diameter) with well-defined margins. These hypointense lesions have been reported to represent microhemorrhages (5, 6). Microhemorrhages were grouped by cerebral regions as lobar lesions (involving cortical and subcortical white matter) and deep lesions (involving lentiform nucleus, caudate nucleus, thalamus, cerebellum, or brain stem). No effort was made to define lesions as either purely cortical versus subcortical, because this was not thought to be feasible by analysis of images. The severity of white matter hyperintensity on T2-weighted fast spin-echo images was graded as follows: absent, punctate foci, early confluent, or confluent (15).
Data Analysis
The presence of microhemorrhages was correlated with the demographic and clinical characteristics of all patients included in the analysis. For the patients who had previous hemorrhagic stroke, we further analyzed the clinical features and the presence and location of microhemorrhages. The patients with microhemorrhages were followed up clinically, and MR imaging or CT or both were performed for some patients if clinically necessary.
Statistical Methods
For statistical analyses, a Student t test and χ2 test were used. Logistic regression analysis and Spearman rank correlation were also conducted. P < .05 was considered to represent a statistically significant finding.
Results
Microhemorrhages were detected in 197 (9.8%) of the 2019 patients included in the analysis (Table 1). These microhemorrhages were easily recognized as small hypointense lesions on the T2*-weighted gradient-echo images and were more pronounced compared with those on T2-weighted fast spin-echo images (Fig 1). These lesions were rarely seen on the T1-weighted spin-echo images. These microhemorrhages were observed in deep regions in 161 patients, predominantly in the lentiform nucleus (96 patients) and thalamus (88 patients). The lobar region was also a common location of microhemorrhages (93 patients) (Table 2). In 60 patients, microhemorrhages were observed at both the deep and lobar regions.
TABLE 1:
Demographic and Clinical Data Regarding the Patients With and Without Microhemorrhages
| Variables | Patients with Microhemorrhages (n = 197) | Patients without Microhemorrhages (n = 1822) | P Value |
|---|---|---|---|
| Age (years) | 67.2 ± 11.1 | 55.5 ± 15.9 | <.00001 |
| Sex, male | 113 | 1028 | .93 |
| Hypertension | 156 (79.1%) | 545 (29.9%) | <.00001 |
| Diabetes mellitus | 56 (28.4%) | 289 (15.9%) | .00002 |
| Brain stroke history | |||
| Hemorrhage | 49 (24.9%) | 20 (1.1%) | <.00001 |
| Infarction | 67 (34.0%) | 165 (9.1%) | <.00001 |
| White matter hyperintensity | <.00001 | ||
| Absent | 41 (20.8%) | 1387 (76.1%) | |
| Punctate foci | 64 (32.5%) | 289 (15.9%) | |
| Early confluent | 70 (35.5%) | 129 (7.1%) | |
| Confluent | 22 (11.2%) | 17 (0.9%) |
Fig 1.
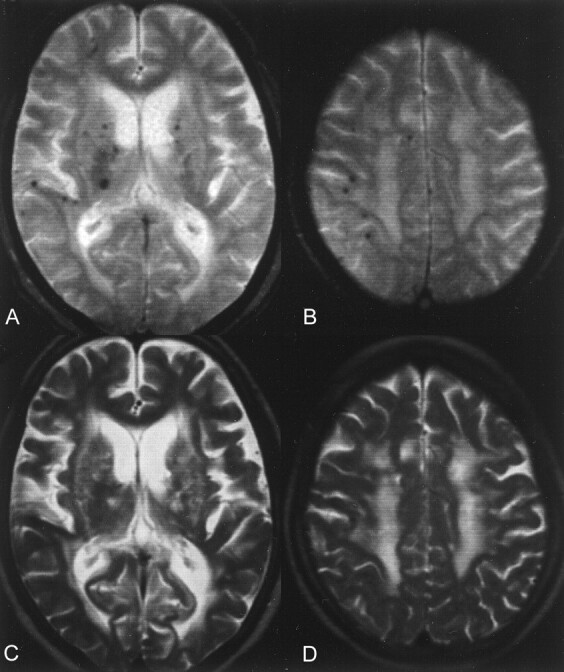
Multiple microhemorrhages were detected.
A and B, T2*-weighted gradient-echo images show microhemorrhages.
C and D, Lesions were less conspicuous on T2-weighted fast spin-echo images and were rarely shown on T1-weighted spin-echo images (not shown).
TABLE 2:
Location of Microhemorrhages Depicted on T2*-weighted Gradient-Echo Images
| Location of Microhemorrhages | No. of Patients | No. of Lesions (range) |
|---|---|---|
| Deep | 161 | 0–40 |
| Lentiform nucleus | 96 | 0–19 |
| Caudate nucleus | 14 | 0–4 |
| Internal capsule | 4 | 0–3 |
| Thalamus | 88 | 0–14 |
| Brain stem | 54 | 0–8 |
| Cerebellum | 33 | 0–9 |
| Lobar | 93 | 0–40 |
| Total | 197 | 1–40 |
These lesions were usually observed in patients older than 40 years. The incidence of deep microhemorrhages increased with age but that of lobar microhemorrhages seemed to plateau in patients older than 60 years (Fig 2). The patients with microhemorrhages were not only older but also were more often hypertensive and diabetic and more frequently had histories of stroke, compared with the patients without microhemorrhages (Table 1). The white matter hyperintensity on T2-weighted images was more prominent on the images of patients with microhemorrhages, and a significant correlation existed between the severity of white matter hyperintensity and the number of microhemorrhages (r = 0.71, P < .00001; Fig 3).
Fig 2.

Graph shows age distribution (in years) of microhemorrhages. These lesions are usually observed in patients older than 40 years. The incidence of deep microhemorrhages increases with age, but that of lobar microhemorrhages seems to plateau in patients older than 60 years.
Fig 3.

Graph shows correlation between the severity of white matter hyperintensity and the number of microhemorrhages (r = 0.71, P < .00001). Bars indicate SD.
Among 2019 patients, 69 had histories of hemorrhagic stroke and 232 had a histories of infarction (two patients had previous hemorrhagic transformation, and 16 had both hemorrhagic and ischemic strokes before). Microhemorrhages were detected in 71.0% of the patients with histories of hemorrhagic stroke (Fig 4), whereas 18.1% of the patients with histories of ischemic stroke and only 3.7% of the patients without previous stroke had microhemorrhages (Table 3). Because comparison between patients with and those without hemorrhagic stroke showed highly significant differences regarding other variables assessed, we conducted logistic regression analysis (Table 4), which showed that presence of microhemorrhages had the highest significant correlation with a history of hemorrhagic stroke (P < .000001), with an odds ratio of 15.03.
Fig 4.

T2*-weighted gradient-echo image of a 67-year-old hypertensive man who had hemorrhagic stroke at the left lentiform nucleus 2 years previously shows many deep microhemorrhages.
TABLE 3:
Demographic and Clinical Data Regarding the Patients With and Without Histories of Symptomatic Brain Hemorrhage
| Variable | Patients with Hemorrhagic Stroke (n = 69) | Patients without Hemorrhagic Stroke (n = 1950) | P Value |
|---|---|---|---|
| Age (years) | 62.9 ± 10.1 | 56.4 ± 16.0 | <.000001 |
| Sex, male | 48 (69.6%) | 1093 (56.1%) | .03 |
| Hypertension | 57 (82.6%) | 644 (33.0%) | <.000001 |
| Diabetes mellitus | 12 (17.4%) | 333 (17.1%) | 1.00 |
| History of ischemic stroke | 16 (23.2%) | 216 (11.1%) | .004 |
| White matter hyperintensity | <.000001 | ||
| Absent | 11 (15.9%) | 1269 (65.1%) | |
| Punctate foci | 33 (47.8%) | 320 (16.4%) | |
| Early confluent | 19 (27.5%) | 180 (9.2%) | |
| Confluent | 6 (8.7%) | 33 (1.7%) | |
| Microhemorrhages | 49 (71.0%) | 148 (7.6%) | <.000001 |
TABLE 4:
Logistic Regression Analysis Shows That The Presence of Microhemorrhages Has the Highest Significant Correlation With History of Hemorrhagic Stroke
| Variable | Coefficient Standard |
P Value | Exp (B) | |
|---|---|---|---|---|
| B | Error | |||
| Age (years) | 0.021 | 0.01 | .06 | 1.02 |
| Sex, male | 0.67 | 0.30 | .02 | 1.95 |
| Hypertension | 1.32 | 0.37 | .0004 | 3.74 |
| History of ischemic stroke | −0.43 | 0.34 | .21 | 0.65 |
| White matter hyperintensity | 0.49 | 0.17 | .005 | 1.63 |
| Microhemorrhages | 2.71 | 0.34 | <.000001 | 15.03 |
Among 69 patients with histories of hemorrhagic stroke, comparison was made between patients with lobar hemorrhages and those with deep hemorrhages to identify the variables that should best separate these two groups (Table 5). Lobar microhemorrhages were more frequently observed in patients who had a history of lobar hemorrhagic stroke (P < .005) (Table 5; Fig 5).
TABLE 5:
Demographic, Clinical, and MR Imaging Data Regarding the Patients With Histories of Hemorrhagic Stroke
| Variable | Hemorrhagic Stroke |
P Value | |
|---|---|---|---|
| Lobar (n = 11) | Deep (n = 58) | ||
| Age (years) | 65.1 ± 10.1 (range, 42–76) | 62.5 ± 10.1 (range, 38–84) | .44 |
| Sex, male | 7 (63.6%) | 41 (70.7%) | .72 |
| Hypertension | 9 (81.8%) | 48 (92.3%) | .99 |
| Diabetes mellitus | 0 (0%) | 12 (20.7%) | .19 |
| Periventricular hyperintensity | .11 | ||
| Absent | 3 | 8 | |
| Punctate foci | 6 | 27 | |
| Early confluent | 0 | 19 | |
| Confluent | 2 | 4 | |
| Microhemorrhages | |||
| Lobar | 7 (63.6%) | 22 (37.9%) | .005 |
| Deep | 5 (45.5%) | 38 (65.5%) | .31 |
Note.—Only the presence of microhemorrhages discriminates between cortical/subcortical and deep hemorrhagic strokes.
Fig 5.

Graph shows incidence of microhemorrhages in patients with histories of deep and lobar hemorrhagic stroke. The incidence of lobar microhemorrhages is significantly higher in the patients with histories of lobar hemorrhagic stroke (P < .005).
For the 197 patients with microhemorrhages, clinical follow-up was attempted. Twenty-four patients were lost to follow-up, 31 patients were followed up for less than 1 month, and three patients died as a result of unrelated causes, such as pneumonia. Thus, 139 patients with microhemorrhages could be clinically followed up for more than 1 month (468.4 ± 330.0 days; median, 411 days; range, 32–1105 days), and four patients prospectively had new hemorrhagic stroke (Table 6; Figs 6 and 7). They were older than 52 years, and hemorrhagic strokes occurred 34 to 402 days after microhemorrhages were first observed on T2*-weighted gradient-echo images. No patients had subsequent ischemic stroke.
TABLE 6:
Patients With Microhemorrhages, In Whom Hemorrhagic Strokes Were Prospectively Observed
| Age (yr)/Sex | Number of Microhemorrhages |
Hemorrhagic Stroke |
Associated Condition |
|||
|---|---|---|---|---|---|---|
| Lobar | Deep | Location | Days* | HT | DM | |
| 71/M | 6 | 0 | Parietal lobar | 34 | − | − |
| 75/F† | 2 | 0 | Frontal lobar | 147 | + | − |
| 64/F‡ | 2 | 8 | Caudate head | 402 | + | − |
| 52/M | 0 | 9 | Thalamus | 371 | + | + |
Note.—There may be a link between the site of hemorrhagic stroke and the distribution of microhemorrhages. HT indicates hypertension; DM, diabetes mellitus.
Days indicates number of days after the microhemorrhages were first observed on T2*-weighted gradient-echo images.
This patient had a history of parietal lobar hemorrhage. The other three patients had no previous brain stroke.
This patient had a history of myocardial infarction, pulmonary artery thromboembolism, and deep venous thrombosis, for which she received warfarin.
Fig 6.
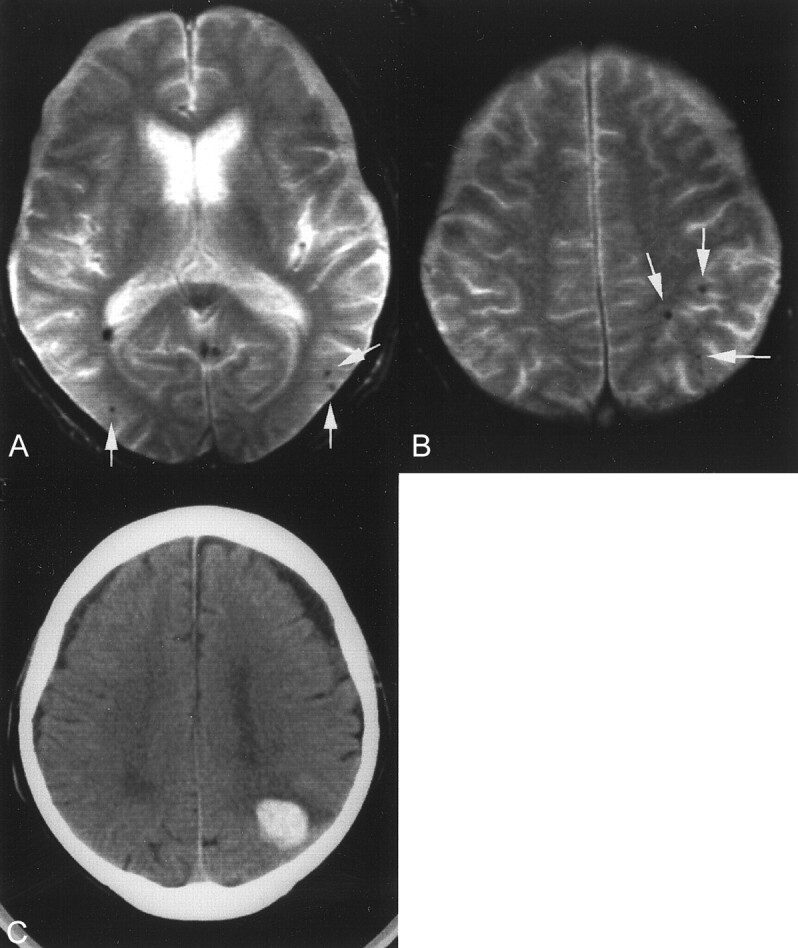
Images of a 71-year-old man who had multiple lobar (cortical-subcortical) microhemorrhages.
A and B, T2*-weighted gradient-echo images show multiple lobar microhemorrhages (arrows).
C, New hemorrhagic stroke at the left parietal lobe can be seen 34 days after microhemorrhages were first observed on T2*-weighted gradient-echo images.
Fig 7.

Images obtained in a 64-year-old woman who had multiple deep microhemorrhages.
A and B, T2*-weighted gradient-echo images show multiple deep microhemorrhages (arrows).
C, New hemorrhagic stroke at the right caudate head can be seen 402 days after microhemorrhages were first observed on T2*-weighted gradient-echo images.
Discussion
Microhemorrhages are shown as small signal intensity loss on T2*-weighted gradient-echo images because of magnetic susceptibility effect. Gradient-echo imaging provides superior sensitivity in detecting old hemorrhages as compared with spin-echo sequences. Gradient-recalled echo-planar imaging is also sensitive in depicting chronic hemorrhage with faster acquisition time but is inferior to gradient-echo imaging in detecting infratentorial or skull base lesions (16, 17). Histopathologic analyses (5, 6) confirmed that these hypointense lesions seen on T2*-weighted gradient-echo images were a result of hemosiderin deposits, indicative of old microhemorrhages. Angioma may be seen as a hypointensity focus on T2*-weighted gradient-echo images, although this is an uncommon incidental finding except in familial cases.
In this study, we observed microhemorrhages on the T2*-weighted gradient-echo images of 9.8% of the patients who underwent MR imaging examinations. These lesions occurred more frequently in patients with histories of brain stroke, particularly in those with histories of hemorrhagic stroke (71.0%), compared with patients without previous brain stroke (3.7%). The reported incidences of microhemorrhages seen on T2*-weighted images of adult patients without previous brain stroke are 5% and 6.4% (10, 11). The incidence in our study (3.7%) was slightly lower than those of previous studies (5%, 6.4%), possibly because our participants included young patients. In neurologically healthy adults, microhemorrhages were reported to be detected in 3.1% (12). The reported incidences of microhemorrhages in patients with previous hemorrhagic stroke range from 33% to 80% (2, 6, 7, 9, 10). Although our result was within this range (71%), these large differences are probably a consequence of small patient groups analyzed and differences in patient selection (18).
Patients with microhemorrhages were significantly older and had a higher frequency of hypertension. A strong correlation between the white matter hyperintensity and the number of microhemorrhages was also observed. Because hypertension is a well-established cause of small-vessel disease and extensive white matter hyperintensity has been reported to represent microangiopathy-related tissue damage (19), these findings support the role of small-vessel disease in the pathogenesis of microhemorrhages.
These microhemorrhages were most frequently located in lentiform nucleus, thalamus, and cortical-subcortical regions, where symptomatic hematomas are commonly observed. These results are consistent with those of previous studies that included a relatively small number of patients (3, 6, 9, 11, 12, 18). Although significant correlations were confirmed between history of hemorrhagic stroke and several clinical and morphologic variables (eg, advanced age, hypertension, and white matter hyperintensity), which previous studies had already associated with a high risk of hemorrhagic strokes (20, 21), the presence of microhemorrhages emerged as the most significant variable to discriminate patients with from those without previous hemorrhagic stroke in a logistic regression analysis. These results not only support the role of small-vessel disease in the pathogenesis of microhemorrhages but also support the hypothesis that the presence of microhemorrhages may be a risk factor for hemorrhagic stroke. Forty-nine (24.9%) of 197 patients with microhemorrhages had previous hemorrhagic stroke at the time of presentation. Because no test has been identified to predict risk of hemorrhage, this question assumes some clinical importance. However, to answer the question of whether clinical outcome in this population of patients would be changed by greater imaging accuracy, prospective investigation is required. In our series, four patients with microhemorrhages prospectively suffered from hemorrhagic strokes; the annual incidence of hemorrhagic stroke is estimated to be approximately 22.4 per 1000 patient-years. Because it is difficult to obtain an appropriate control group, we cannot determine whether the incidence of hemorrhagic stroke was really high in patients with microhemorrhages. In Japan, however, the overall incidence of intracerebral hemorrhage was reported to be 0.9 per 1000 patient-years (22), so that the incidence of hemorrhagic stroke is likely to be much higher in the patients with microhemorrhages.
Another question arising from the previous studies is whether presence and distribution of microhemorrhages can serve to indicate different types of angiopathy (eg, CAA and hypertensive microangiopathy). With rare exceptions, CAA-related hemorrhages characteristically involve the cortex and subcortical white matter. Deep central gray nuclei, corpus callosum, and cerebellum are primarily involved on rare occasions, and CAA is almost never observed to be a cause of primary brain stem hematomas (23–25). In contrast, the most common locations of hypertensive hemorrhage are the basal ganglia, thalamus, cerebellum, or pons (14).
The only identified risks for CAA and CAA-associated hemorrhages are advanced age and the accompanying presence of Alzheimer disease (25), and no specific clinical marker is currently available for diagnosis of CAA or assessment of an individual patient’s risk of hemorrhagic stroke. The significantly higher incidence of lobar microhemorrhages in patients with histories of lobar hemorrhagic stroke suggests that the presence of lobar microhemorrhages may represent CAA change, although some of them might be due to hypertensive microangiopathy change. Greenberg et al (7) recently reported that gradient-echo imaging depicted additional microhemorrhages, most of which were clinically silent, during follow-up MR imaging studies of patients with symptomatic lobar hemorrhage. They suggested the ability of gradient-echo imaging to help distinguish CAA from other causes of lobar hemorrhage. A genetic risk factor for CAA, the ε4 allele of the apolipoprotein E gene, has been reported to have an association with both severities of CAA and occurrence of CAA-related intracerebral hemorrhage (26). Allele frequency for apolipoprotein E ε4 was reported to be 14% in the general population (27). That this distinctive genetic factor promotes CAA may explain why only 10% of the elderly patients had lobar microhemorrhages, and the incidence of microhemorrhages seemed to plateau in patients older than 60 years (Fig 2).
The presence of deep microhemorrhages may also be a marker of hypertensive microangiopathy because of the high incidence (65.5%) of these lesions in patients with histories of deep hemorrhagic stroke. It is not surprising that no difference was observed in the incidence of deep microhemorrhages between the patients with lobar hemorrhagic strokes and those with deep hemorrhagic strokes when one considers that a significant proportion of patients with lobar hemorrhages had hypertension. These patients may have a mixed vascular change, and high blood pressure may exacerbate the tendency to CAA-related hemorrhages (25).
A relation may exist between the distribution of microhemorrhages and the location of the hemorrhagic stroke that prospectively occurred (Table 6). Although the number of cases was too small for statistical analysis, this possible relation may also support the hypothesis that these microhemorrhages may be markers of two different types of small-vessel disease. Roob et al (18) reported a tendency toward a regional association between the location of microhemorrhages and the site of the symptomatic hematoma but failed to discern specific patterns of microhemorrhage distribution. In our study, the patients were simply divided into two groups: those with lobar hemorrhages and those with deep hemorrhages. We think that this analysis is reasonable, as discussed above. The coexistence of both types of angiopathy in some patients is a likely cause for some overlap in the distribution of microhemorrhages.
Oral anticoagulation increases the risk of hemorrhagic stroke (28–31), and in certain patient populations, occurrence of intracranial hemorrhage has been reported to negate the reduction in ischemic stroke by oral anticoagulants (21, 28, 29). Although these hemorrhages may be related to bleeding from vessels different from those responsible for hypertensive microangiopathy- and CAA-related hemorrhages (24), under the influence of antithrombotic agents, small hemorrhages that are often self-limiting could enlarge, resulting in symptomatic bleeding (28, 32, 33). Intracerebral hemorrhagic complications resulting from anticoagulation therapy were reported to occur predominantly in patients who were older than 75 years and in those with extensive leukoaraiosis (21). Because focal hypointensities are directly indicative of previous hemorrhages, this MR imaging evidence may serve to identify patients who are at high risk for hemorrhagic complications rather than other clinical or morphologic variables (4, 5, 11, 34).
Conclusion
The presence of microhemorrhages on T2*-weighted gradient-echo images may be not only a direct marker of bleeding-prone small-vessel diseases but also an indicator of different types of microangiopathy and a predictor of further hemorrhagic stroke. Further studies are needed to prove that these findings are helpful in clinical decision making.
References
- 1.Chan S, Kartha K, Yoon SS, Desmond DW, Hilal SK. Multifocal hypointense cerebral lesions on gradient-echo MR are associated with chronic hypertension. AJNR Am J Neuroradiol 1996;17:1821–1827 [PMC free article] [PubMed] [Google Scholar]
- 2.Offenbacher H, Fazekas F, Schmidt R, Koch M, Fazekas G, Kapeller P. MR of cerebral abnormalities concomitant with primary intracerebral hematomas. AJNR Am J Neuroradiol 1996;17:573–578 [PMC free article] [PubMed] [Google Scholar]
- 3.Kwa VI, Franke CL, Verbeeten B Jr, Stam J. Silent intracerebral microhemorrhages in patients with ischemic stroke. Ann Neurol 1998;44:372–377 [DOI] [PubMed] [Google Scholar]
- 4.Chan S, Desmond DW. Silent intracerebral microhemorrhages in stroke patients. Ann Neurol 1999;45:412–413 [PubMed] [Google Scholar]
- 5.Fazekas F, Kleinert R, Roob G, et al. Histopathologic analysis of foci of signal loss on gradient-echo T2*-weighted MR images in patients with spontaneous intracerebral hemorrhage: evidence of microangiopathy-related microhemorrhages. AJNR Am J Neuroradiol 1999;20:637–642 [PMC free article] [PubMed] [Google Scholar]
- 6.Tanaka A, Ueno Y, Nakayama Y, Takano K, Takebayashi S. Small chronic hemorrhages and ischemic lesions in association with spontaneous intracerebral hematomas. Stroke 1999;30:1637–1642 [DOI] [PubMed] [Google Scholar]
- 7.Greenberg SM, O’Donnell HC, Schaefer PW, Kraft E. MRI detection of new hemorrhages: potential marker of progression in cerebral amyloid angiopathy. Neurology 1999;53:1135–1138 [DOI] [PubMed] [Google Scholar]
- 8.Greenberg SM, Finklestein SP, Schaefer PW. Petechial hemorrhages accompanying lobar hemorrhage: detection by gradient-echo MRI. Neurology 1996;46:1751–1754 [DOI] [PubMed] [Google Scholar]
- 9.Tsushima Y, Tamura T, Unno Y, Kusano S, Endo K. Multifocal hypointense lesions in brain on T2*-weighted gradient echo MR imaging. Neuroradiology 2000;42:499–504 [DOI] [PubMed] [Google Scholar]
- 10.Kinoshita T, Okudera T, Tamura H, Ogawa T, Hanazawa J. Assessment of lacunar hemorrhage associated with hypertensive stroke by echo-planar gradient-echo T2*-weighted MRI. Stroke 2000;31:1646–1650 [DOI] [PubMed] [Google Scholar]
- 11.Roob G, Schmidt R, Kapeller P, Lechner A, Hartung HP, Fazekas F. MRI evidence of past cerebral microhemorrhages in a healthy elderly population. Neurology 1999;52:991–994 [DOI] [PubMed] [Google Scholar]
- 12.Tsushima Y, Tanizaki Y, Aoki J, Endo K. MR detection of microhemorrhages in neurologically healthy adults. Neuroradiology 2002;44:31–36 [DOI] [PubMed] [Google Scholar]
- 13.Massaro AR, Sacco RL, Mohr JP, et al. Clinical discriminators of lobar and deep hemorrhages: the Stroke Data Bank. Neurology 1991;41:1881–1885 [DOI] [PubMed] [Google Scholar]
- 14.Atlas SW, Mark AS, Grossman RI, Gomori JM. Intracranial hemorrhage: gradient-echo MR imaging at 1.5 T: comparison with spin-echo imaging and clinical applications. Radiology 1988;168:803–807 [DOI] [PubMed] [Google Scholar]
- 15.Fazekas F, Chawluk JB, Alavi A, Hurtig HI, Zimmerman RA. MR signal abnormalities at 1.5-T in Alzheimer’s dementia and normal aging. AJNR Am J Neuroradiol 1987;8:421–426 [DOI] [PubMed] [Google Scholar]
- 16.Liang L, Korogi Y, Sugahara T, et al. Detection of intracranial hemorrhage with susceptibility-weighted MR sequences. AJNR Am J Neuroradiol 1999;20:1527–1534 [PMC free article] [PubMed] [Google Scholar]
- 17.Lin DD, Filippi CG, Steever AB, Zimmerman RD. Detection of intracranial hemorrhage: comparison between gradient-echo images and b0 images obtained from diffusion-weighted echo-planar sequences. AJNR Am J Neuroradiol 2001;22:1275–1281 [PMC free article] [PubMed] [Google Scholar]
- 18.Roob G, Lechner A, Schmidt R, Flooh E, Hartung HP, Fazekas F. Frequency and location of microhemorrhages in patients with primary intracerebral hemorrhage. Stroke 2000;31:2665–2669 [DOI] [PubMed] [Google Scholar]
- 19.Fazekas F, Kleinert R, Offenbacher H, et al. Pathologic correlates of incidental MRI white matter signal hyperintensities. Neurology 1993;43:1683–1689 [DOI] [PubMed] [Google Scholar]
- 20.Inzitari D, Giordano GP, Ancona AL, Pracucci G, Mascalchi M, Amaducci L. Leukoaraiosis, intracerebral hemorrhage, and arterial hypertension. Stroke 1990;21:1419–1423 [DOI] [PubMed] [Google Scholar]
- 21.The Stroke Prevention in Reversible Ischemia Trial (SPIRIT) Study Group. A randomized trial of anticoagulants versus aspirin after cerebral ischemia of presumed arterial origin. Ann Neurol 1997;42:857–865 [DOI] [PubMed] [Google Scholar]
- 22.Ueda K, Hasuo Y, Kiyohara Y, et al. Intracerebral hemorrhage in a Japanese community, Hisayama: incidence, changing pattern during long-term follow-up, and related factors. Stroke 1988;19:48–52 [DOI] [PubMed] [Google Scholar]
- 23.Gilbert JJ, Vinters HV. Cerebral amyloid angiopathy: incidence and complications in the aging brain: I. cerebral hemorrhage. Stroke 1983;14:915–923 [DOI] [PubMed] [Google Scholar]
- 24.Kase CS. Intracerebral hemorrhage: non-hypertensive causes. Stroke 1986;17:590–595 [DOI] [PubMed] [Google Scholar]
- 25.Vinters HV. Cerebral amyloid angiopathy: a critical review. Stroke 1987;18:311–324 [DOI] [PubMed] [Google Scholar]
- 26.Greenberg SM, Rebeck W, Vonsattel JP, Gomez-Isla T, Hyman BT. Apolipoprotein E ε4 and cerebral hemorrhage associated with amyloid angiopathy. Ann Neurol 1995;38:254–259 [DOI] [PubMed] [Google Scholar]
- 27.Mahley RW. Apolipoprotein E: cholesterol transport protein with expanding role in cell biology. Science 1988;240:622–630 [DOI] [PubMed] [Google Scholar]
- 28.Hart RG, Boop BS, Anderson DC. Oral anticoagulants and intracranial hemorrhage: fact and hypothesis. Stroke 1995;26:1471–1477 [DOI] [PubMed] [Google Scholar]
- 29.Stroke Prevention in Atrial Fibrillation Investigators. Warfarin versus aspirin for prevention of thromboembolism in atrial fibrillation. Lancet 1994;343:687–691 [PubMed] [Google Scholar]
- 30.Chesebro JH, Adams PC, Fuster V. Antithrombotic therapy in patients with valvular heart disease and prosthetic heart valves. J Am Coll Cardiol 1986;8:41B–56B [DOI] [PubMed] [Google Scholar]
- 31.Gebel JM, Sila CA, Sloan MA, et al. Thrombolysis-related intracranial hemorrhage: a radiographic analysis of 244 cases from the GUSTO-1 trial with clinical correlation. Stroke 1998;29:563–5699506593 [Google Scholar]
- 32.Cole FM, Yates PO. The occurrence and significance of intracerebral micro-aneurysms. J Pathol Bacteriol 1967;93:393–411 [DOI] [PubMed] [Google Scholar]
- 33.Fisher CM. Cerebral miliary aneurysms in hypertension. Am J Pathol 1972;66:313–330 [PMC free article] [PubMed] [Google Scholar]
- 34.Roob G, Fazekas F. Magnetic resonance imaging of cerebral microbleeds. Curr Opin Neurol 2000;13:69–73 [DOI] [PubMed] [Google Scholar]