Abstract
Summary: Restricted water diffusion has been used to distinguish pyogenic abscess from other rim-enhancing brain masses; however diffusion-weighted imaging of cerebral infection before capsule formation has rarely been described. We report a case of fungal cerebritis in which water diffusion was more restricted than that of normal contralateral brain and the measured diffusion coefficient was in the range of that reported for pyogenic brain abscess. In the proper clinical setting, cerebritis should be considered in the differential diagnosis of an ill-defined focal brain mass associated with markedly restricted water diffusion.
Diffusion-weighted (DW) imaging has been used to diagnose cerebral ischemia in its earliest stages. Restricted diffusion, however, is not specific for acute brain ischemia and has been reported in cases of herpes encephalitis, cortical spreading depression, hyperacute hemorrhage, traumatic axonal injury, Creutzfeld-Jakob syndrome, and, in rare cases, acute multiple sclerosis (1). Abnormal DW imaging has also been reported in cases of pyogenic brain abscess and is attributed to restricted water diffusion in purulent fluid (2). However, MR imaging in earlier stages of brain abscess, before capsule formation, has not been widely reported.
We report a case of cerebritis secondary to frontoethmoidal fungal sinusitis in which restricted water diffusion is demonstrated by use of DW imaging.
Case Report
A 44-year-old woman was found unresponsive and apneic, with twitching of her facial muscles, tongue, and lower extremities. Her family reported that the patient had headache and increasing lethargy of 6-day duration. She had a medical history of insulin-dependent diabetes mellitus and hypertension. In the emergency room, initial physical examination revealed a blood pressure of 223/104 and a supple neck. Blood tests showed a white cell count of 11,900/mm3 and glucose level of 990 mg/dL. Noncontrast CT demonstrated no brain mass, intracranial hemorrhage, or extraaxial fluid, although frontal and bilateral ethmoid mucosal thickening was noted.
The patient was intubated and admitted to the intensive care unit. Analysis of CSF obtained by lumbar puncture showed a count of 45 cells/mm3 (normal range, 0–5 cells/mm3) of which 93% were neutrophilic leukocytes, no red blood cells, a glucose level of 261 mg/dL (normal range, 38–85 mg/dL), and a protein concentration of 31 mg/dL (normal range, 15–45 mg/dL). The diagnosis of meningitis was made, and intravenous therapy with ceftriaxone was begun.
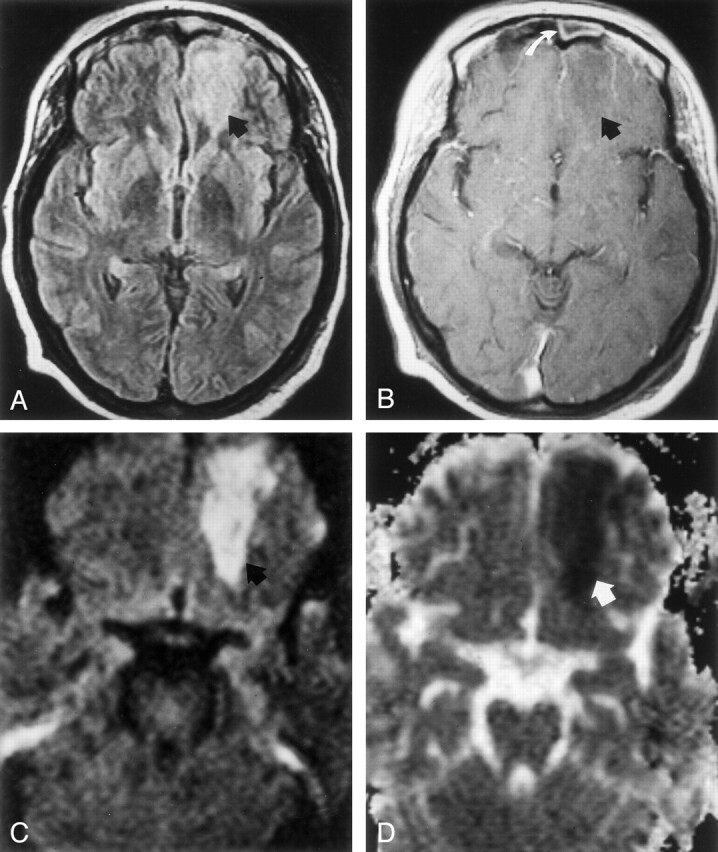
MR imaging of the brain (Fig 1) was performed on hospital day 5 and revealed an ill-defined area of increased signal intensity in the left orbitofrontal lobe on fluid-attenuated inversion recovery (FLAIR) images and marked hyperintense signal on DW images (b value = 1000 s/mm2). T1-weighted images showed no contrast enhancement within or around this lesion or in the subfrontal meninges, although mucosal enhancement of the frontal and ethmoid paranasal sinuses was demonstrated. On the apparent diffusion coefficient (ADC) map, a mean of six region of interest measurements (3 mm in diameter) showed an average ADC of 0.41 ± 0.04 (10−3mm2/s ± SD) in the left orbitofrontal lesion, and 0.83 ± 0.09 in the contralateral normal frontal white matter. On the basis of MR imaging, a diagnosis of cerebritis secondary to frontoethmoidal sinusitis was made, and intravenous vancomycin was added to the antimicrobial regimen.
Fig 1.

Images acquired on hospital day 5 during the early stage of left orbitofrontal cerebritis.
A, FLAIR image (8000/105 [TR/TE]; TI, 2500) shows hyperintense subcortical white matter of left frontal lobe (arrow).
B, Postcontrast T1-weighted image (650/17) shows no contrast enhancement around an ill-defined hypointense area (arrow). Note mucosal enhancement in left frontal sinus (white arrow).
C, DW image (b = 1000 s/mm2) shows hyperintense signal (arrow) in frontal cerebritis.
D, ADC map shows hypointense signal intensity (arrow) indicating restricted water diffusion. Mean ADC is 0.41 ± 0.04 (10−3mm2/s).
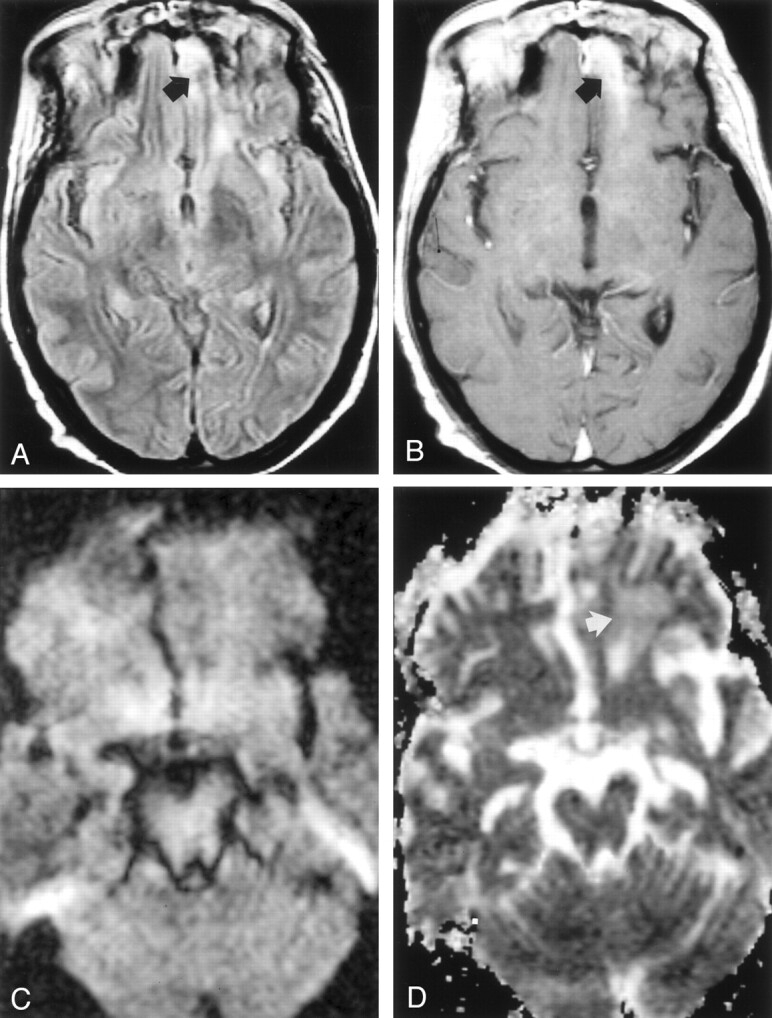
On hospital day 9, MR imaging (Fig 2) demonstrated faint, thin peripheral contrast-enhancement around the left orbitofrontal mass, consistent with late cerebritis or early brain abscess. Trace DW images again showed marked hyperintensity in the lesion and a mean ADC of 0.59 ± 0.03 (10−3mm2/s) was measured. The ADC of contralateral normal right frontal white matter and frontal horn CSF was 0.89 ± 0.08 (10−3mm2/s) and 3.75 ± 0.4 (10−3mm2/s), respectively. Operative drainage of the left ethmoid and frontal sinus was performed later that day, and jellylike tissue fragments showed very small, scattered areas of fungal hyphae mixed with bacterial colonies on the surface of mucosa.
Fig 2.
MR images acquired on hospital day 9 during the late stage of cerebritis or early stage of abscess.
A, Contrast-enhanced T1-weighted image (650/17) shows thin, faint peripheral contrast enhancement around a left frontal mass (arrow).
B, DW image (b = 1,000 s/mm2) demonstrates marked hyperintensity with a rim of even higher signal intensity (arrow).
C, Restricted diffusion is indicated by hypointensity (arrow) on this ADC map. Mean ADC is 0.59 ± 0.03 (10−3mm2/s).
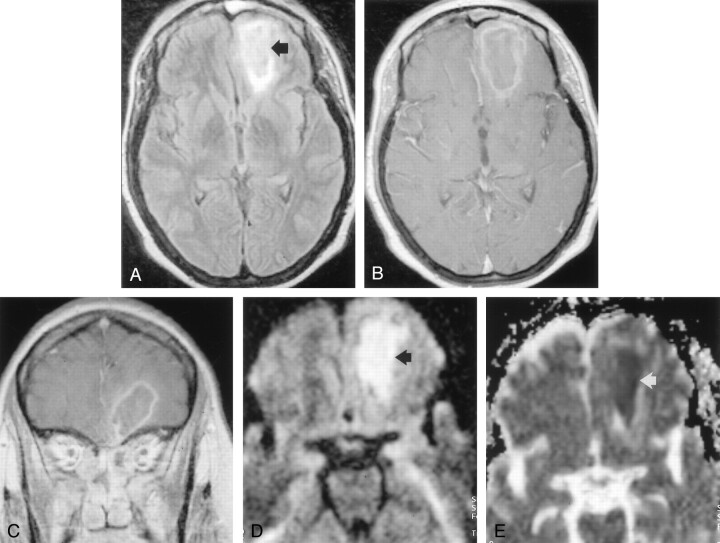
On hospital day 15, contrast-enhanced MR imaging showed a slightly thicker, enhancing rim around the left orbitofrontal mass, consistent with brain abscess (Fig 3). Mean ADC of the abscess center and of contralateral frontal white matter was 0.56 ± 0.05 (10−3mm2/s) and 0.92 ± 0.04 (10−3mm2/s), respectively. Stereotactic aspiration of the left orbitofrontal abscess was performed, and examination of gelatinous purulent fluid revealed necrotic tissue, 2+ nonseptate hyphae, consistent with noninvasive mucormycosis, but no bacteria. The patient then began an 8-week regimen of intravenous amphotericin B.
Fig 3.
Images acquired before abscess aspiration on hospital day 15.
A, FLAIR image (9000/105; TI; 2500) shows a poorly defined left frontal mass (arrow).
B and C, Postcontrast axial (B) and coronal (C) T1-weighted images show a thin, well-defined enhancing wall, consistent with cerebral abscess.
D, DW image (b = 1000 s/mm2) shows marked increased signal intensity is present in this mass (arrow).
E, Marked hypointensity (arrow) on ADC map is consistent with restricted diffusion. Mean ADC is 0.56 ± 0.05 (10−3mm2/s).
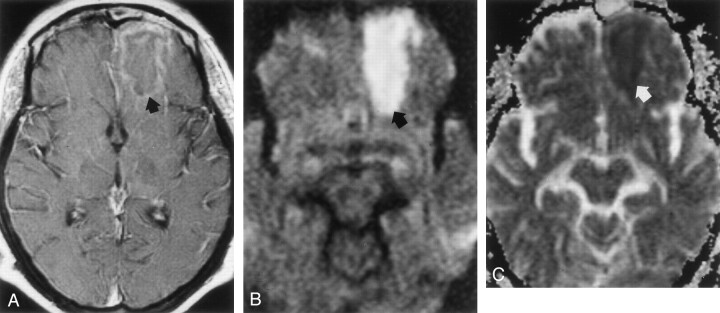
On hospital day 45, a follow-up MR imaging examination showed marked reduction in size and signal intensity and near-complete resolution of the orbitofrontal abscess (Fig 4). The patient was discharged to a rehabilitation facility on hospital day 65.
Fig 4.

Images acquired after surgical aspiration and antifungal therapy; cerebral abscess has resolved, leaving focal gliosis.
A, FLAIR (7000/105; TI, 2500) shows hyperintense signal in the left frontal lobe (arrow).
B, Postcontrast T1-weighted image (650/17) shows a band of contrast enhancement at the site of treated abscess (arrow).
C, DW image (b = 1000 s/mm2) shows symmetric signal intensities in frontal lobes.
D, ADC map shows minimal hyperintensity (arrow) in left frontal lobe, a finding consistent with gliosis. Mean ADC is 1.87 ± 0.08 (10−3 m2/s).
Discussion
Although most commonly used to investigate acute brain ischemia, DW imaging has also helped characterize several focal mass lesions (1). In particular, pyogenic brain abscess may present as a hyperintense mass on DW images because of prolonged T2 relaxation time and because of markedly restricted water diffusion of suppurative fluid. Ebisu et al (2) were the first to report a brain abscess with marked hyperintensity on DW images; the ADC of in vivo purulent fluid was 0.31 (10−3mm2/s) and of aspirated pus was 0.43 (10−3mm2/s). Subsequent investigators have confirmed restricted diffusion in suppurative fluid and report ADC values between 0.28 and 0.7 (10−3mm2/s) (3–5).
Cerebritis is the earliest manifestation of a cerebral infection that may progress to the formation of a brain abscess and occurs 2–3 days following pathogen inoculation in the rat model of cerebral abscess (6). In response to the infecting microbe, an ill-defined area of coagulative necrosis forms with profuse infiltration of the necrotic center by polymorphonuclear leukocytes (6, 7). There is a surrounding area of edematous parenchyma with eosinophilic neurons and blood vessels with a proteinaceous perivascular exudate. Vascular proliferation does not occur until several days later (6). Because it is unusual for patients to present at this stage of cerebral infection, imaging of early cerebritis has not been reported widely. On T1-weighted MR images, an ill-defined area of isointensity or hypointensity and subtle mass effect may be seen, and contrast enhancement is absent or minimal. On FLAIR and T2-weighted images, the infected tissue is hyperintense (8). To our knowledge, only one prior report of diffusion-weighted MR imaging in cerebritis that proceeded to brain abscess formation exists in the literature (9). The case we present is important, because it shows that early cerebritis should be added to the growing list of ill-defined focal lesions that may be associated with restricted water diffusion.
In the absence of purulent fluid, restricted diffusion in early cerebritis might be attributed to hypercellularity, brain ischemia, or cytotoxic edema. Because the translational movement of water occurs primarily in the extracellular compartment, increased cellularity from the abundant infiltration of neutrophils may restrict water diffusion because of the reduced extracellular space, a more complex intracellular environment, or both. For example, hypercellular high-grade primary brain neoplasms typically have a lower diffusion coefficient compared with that of normal brain tissue (10). When a contiguous extracerebral infection such as frontal sinusitis exists, cerebritis may develop from retrograde diploic or emissary thrombophlebitis (7). Although many cases of occlusive venous ischemia are characterized by increased water diffusion from vasogenic edema, some cases are associated with reduced diffusion (11). Although not observed in our case, mycotic infections may infiltrate along cerebral vessels, causing a necrotizing angiitis and arterial thrombosis (12). In these cases, cytotoxic edema from arterial ischemia may explain restricted water diffusion. Finally, restricted diffusion in cases of herpes and other viral encephalitides has been attributed to direct cytotoxicity that results in neuronal swelling (1).
Conclusion
We report a case of cerebritis secondary to frontoethmoidal fungal sinusitis in which water diffusion is more restricted than that of normal contralateral white matter and the measured diffusion coefficient is in the range reported for that of brain abscess. Cerebritis should be considered in the proper clinical setting when an ill-defined focal brain mass is associated with markedly restricted water diffusion.
References
- 1.Schaefer P, Grant P, Gonzalez R. Diffusion-weighted MR imaging of the brain. Radiology 2000;217:331–345 [DOI] [PubMed] [Google Scholar]
- 2.Ebisu T, Tanaka C, Umeda M, et al. Discrimination of brain abscess from necrotic or cystic tumors by diffusion-weighted echo planar imaging. Magn Reson Imaging 1996;14:1113–1116 [DOI] [PubMed] [Google Scholar]
- 3.Desprechins B, Stadnik T, Koerts G, et al. Use of diffusion-weighted MR imaging in differential diagnosis between intracerebral necrotic tumors and cerebral abscesses [see comments]. AJNR Am J Neuroradiol 1999;20:1252–1257 [PMC free article] [PubMed] [Google Scholar]
- 4.Noguchi K, Watanabe N, Nagayoshi T, et al. Role of diffusionweighted echo-planar MRI in distinguishing between brain abscess and tumour: a preliminary report. Neuroradiology 1999;41:171–174 [DOI] [PubMed] [Google Scholar]
- 5.Tung G, Evangelista P, Rogg J, Duncan JI. Diffusion-weighted MR imaging of rim-enhancing brain masses: is markedly decreased water diffusion specific for brain abscess? AJR Am J Roentgenol 2001;177:709–712 [DOI] [PubMed] [Google Scholar]
- 6.Flaris N, Hickey W. Development and characterization of an experimental model of brain abscess in the rat. Am J Pathol 1992;141:1299–1307 [PMC free article] [PubMed] [Google Scholar]
- 7.Wispelwey B, Dacey RJ, Scheld W. Brain abscess. In: Scheld W, Whitley R, Durack D, eds. Infections of the Central Nervous System. 2nd ed. Philadelphia: Lippincott-Raven;463–493
- 8.Falcone S, Post M. Encephalitis, cerebritis, and brain abscess: pathophysiology and imaging findings. Neuroimaging Clin N Am 2000;10:333–353 [PubMed] [Google Scholar]
- 9.Hollinger P, Zurcher R, Schroth G, Mattle H. Diffusion magnetic resonance imaging findings in cerebritis and brain abscesses in a patient with septic encephalopathy. J Neurol 2000;247:232–234 [DOI] [PubMed] [Google Scholar]
- 10.Gauvain K, McKinstry R, Mukherjee P, et al. Evaluating pediatric brain tumor cellularity with diffusion-tensor imaging. AJR Am J Roentgenol 2001;177:449–454 [DOI] [PubMed] [Google Scholar]
- 11.Forbes K, Pipe J, Heiserman J Evidence for cytotoxic edema in the pathogenesis of cerebral venous infarction. AJNR Am J Neuroradiol 2001;22:450–455 [PMC free article] [PubMed] [Google Scholar]
- 12.Vidal F, Aznar A, deGrassa B. Central nervous system aspergillosis: computed tomography patterns and radiopathologic correlation. Int J Neuroradiol 1998;4:323–333 [Google Scholar]


