Abstract
Summary: Curved-surface projection (CSP) is a new technique for visualizing functional MR imaging data. This technique helps in identifying anatomic structures by demonstrating the whole gyral and sulcal pattern of the brain at once. Compared with other techniques, CSP preserves the spatial relation of eloquent areas to lesions. Especially in neurosurgical patients with space-occupying lesions, CSP helps in assigning the anatomy to its function.
Functional imaging is becoming more often used for presurgical planning and for guiding neurosurgeons during their interventions. Functional MR imaging (fMRI) can help improve our understanding of the anatomic relationship of a lesion to eloquent areas. This information might be used to optimize resection margins and to reduce the postoperative deficit. However, if a lesion distorts the brain surface or deep anatomy, making the right topographic assignment or understanding the anatomic relation of a lesion to eloquent areas often becomes difficult.
Several approaches are used to display functional imaging results. These include overlaying fMRI results on orthogonally reformatted high-spatial-resolution T1-weighted images, projecting statistical maps onto three-dimensional (3D) models of the rendered brain surfaces, and projecting flat-mounted maps. The first method is most widely used. However, in the case of large space-occupying or deep subcortical lesions, this kind of visualization often fails or requires interactive browsing through all three orthogonal views. Even the more advanced techniques, such as 3D surface rendering and flat mounting, do not solve this problem entirely. We propose an alternative visualization method that has the potential to overcome these difficulties by displaying the gyral pattern as flat maps would do, yet preserve the spatial relationship of the eloquent areas to the lesions.
Description of the Technique
To generate a 3D source dataset, we performed a T1-weighted, high-spatial-resolution, isotropic, 3D gradient-echo pulse sequence on a clinical 1.5-T system (Gyroscan Intera; Philips Medical Systems, Best, the Netherlands) by using a birdcage head coil. The following pulse sequence parameters were used: TR/TE, 12.3/3.6; flip angle, 10°; field of view (FOV), 256 × 256 mm; matrix size, 256; contiguous sections, 150; and section thickness, 1 mm. fMRI was performed with a standard echo-planar imaging sequence, with the following parameters: 3000/50; flip angle, 90°; spatial resolution, 4 × 4 × 4 mm; FOV, 256; matrix size, 64 × 64; and section thickness, 4 mm. The curved-surface projection (CSP) was performed on a standard personal computer (Pentium II processor at 800 MHz, 256 MB RAM) by using a software package developed by two of the authors (R.K., L.S.).
After coregistration of the functional dataset and the anatomic reference dataset by using SPM99 available at www.fil.ion.ucl.ac.uk/spm (1), the functional dataset was further preprocessed and analyzed by using the general linear model as implemented in SPM99. The thresholded statistical map (P < .05, corrected) was written into a separate file and interpolated to fit the spatial resolution of the structural reference dataset. The interpolated map was then superimposed on the reference dataset by using the image calculation option of SPM99.
Our approach to visualizing the fMRI results was to reconstruct the fused dataset on curved planes parallel to the brain surface. We called this visualization method CSP.
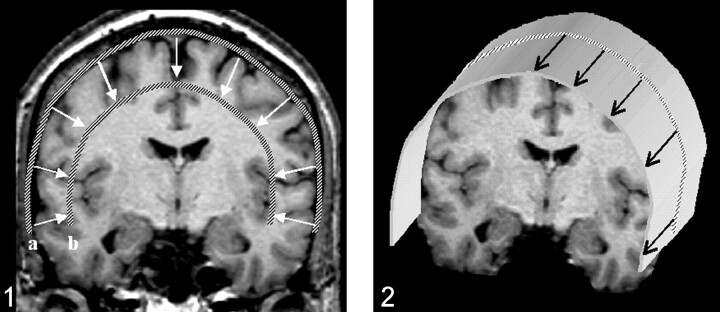
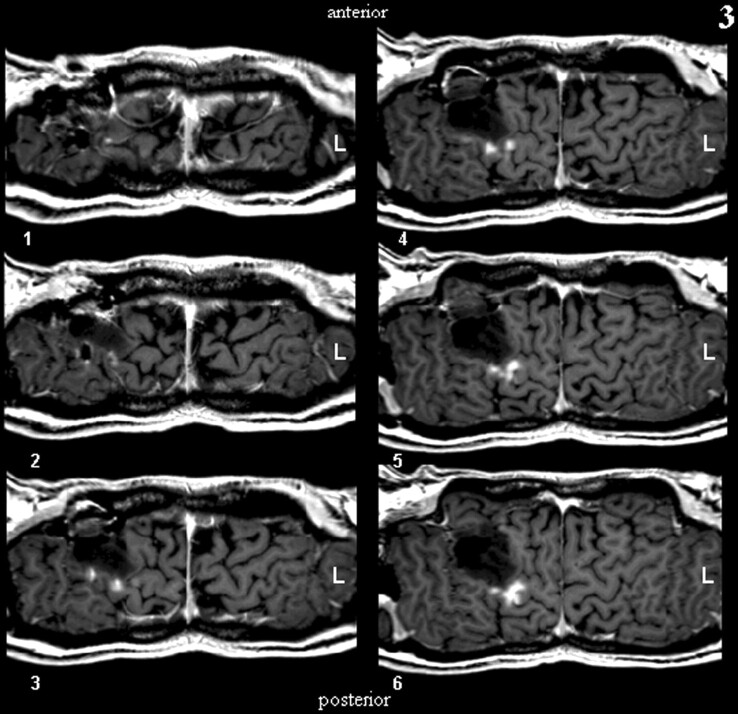
The first step in performing CSP was the definition of a path parallel to the brain surface on a coronal view of the 3D-volume dataset (Fig. 1). The (curved) surface is constructed by parallel shifting of the defined path in an anteroposterior direction (Fig 2). By collapsing the path in the direction of the surface gradients with the normal evolution algorithm described by Gomes et al (2), (Fig 1), the whole brain can be automatically reformatted, and therefore, structures in any depth become accessible. The resulting planes are unfolded by using a Mercator projection (3), (Fig 3). If the functional maps are not fused with the anatomic reference image at the beginning, this can be performed at the final stage by applying the transformation matrix onto the statistical map.
Fig 1.
Definition of a path along the outer curvature of the brain. After the first path is defined, additional paths can be calculated by collapsing the initial path parallel to the path gradients. Displayed are the outer (a) and the inner (b) paths, which define the reconstructed volume. The thickness of the slab to be reconstructed as curved surfaces, as well as the section thickness, can be freely chosen.
Fig 2.
Construction of a curved surface by means of parallel shifting of a predefined path.
Fig 3.
The first six reconstructed sections defined in Figure 1 are displayed (section thickness, 1 mm).
Discussion
The projection of thresholded statistical maps on high-spatial-resolution 3D datasets is commonly used to visualize fMRI results. Results can be analyzed either by browsing orthogonal projections of the statistical maps or by viewing the projections on 3D-rendered brain surfaces. After normalization of the data into the Talairach (4) or Montreal Neurological Institute space (5) the coordinates can additionally be used to locate focal brain activity (6). A more advanced technique is the projection of activity maps onto inflated and flat-mounted brains to visualize the two-dimensional topology of the cerebral cortex (7, 8).
However valuable these techniques may be for analyzing volunteer data, they tend to fail if a lesion distorts the brain, and browsing 3D datasets can become a tedious and time-consuming job. The anatomic-functional assignment often fails, because the standard technique does not provide a survey of the gyral and sulcal pattern. In particular, the identification of the central sulcus is often problematic because of its oblique progression from a posterior-medial to an anterior-lateral inferior direction. To find the central sulcus, the datasets have to be viewed section by section. Viewing both hemispheres in all three planes simultaneously could help in this situation, but most programs lack this feature. However, even if both hemispheres can be displayed and browsed simultaneously in three orthogonal planes, following the sulcal or gyral patterns on those images is still error prone.
Identifying structures on 3D-rendered surfaces often becomes difficult when lesions and their surrounding edema blur the gyral and sulcal patterns. Additionally, in considering subcortical lesions, this method does not provide any information about the relation of a lesion to eloquent brain areas. Furthermore, Talairach coordinates are not precise enough in labeling anatomic structures, and they are invalid and must not be used when space-occupying lesions distort the regular anatomy. Even with more advanced techniques, such as inflating and flat mounting as performed by FreeSurfer available at surfer.nmr.mgh.harvard.edu (7, 8), the problem is not entirely solved. Flat-mounted maps reveal the entire gyral and sulcal pattern at once and help in identifying anatomic structures, yet they lose the topographic relation between anatomy and function in cases of subcortical lesions. The reason for this limitation is that the gray matter-white matter segmentation needed for constructing inflated and flat-mounted surfaces can be flawed if lesions are present. This error occurs because segmentation often depends on prior information such as gray matter-white matter probability maps, which are only conditionally applicable in patients with lesions, brain atrophy, and so forth. In addition, lesions are likely to change the topology of the brain by adding holes into the segmentation maps, which may result in difficulties or failure of the inflating algorithm. In addition, inflating and flat mounting are time-consuming techniques. Depending on the software used, 12–24 hours are required to transform and reconstruct one hemisphere on a modern personal computer. Therefore, this approach is not suitable for use in a clinical setting.
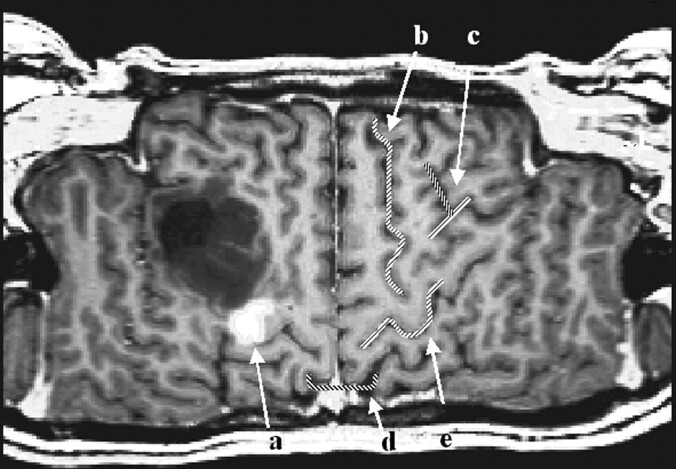
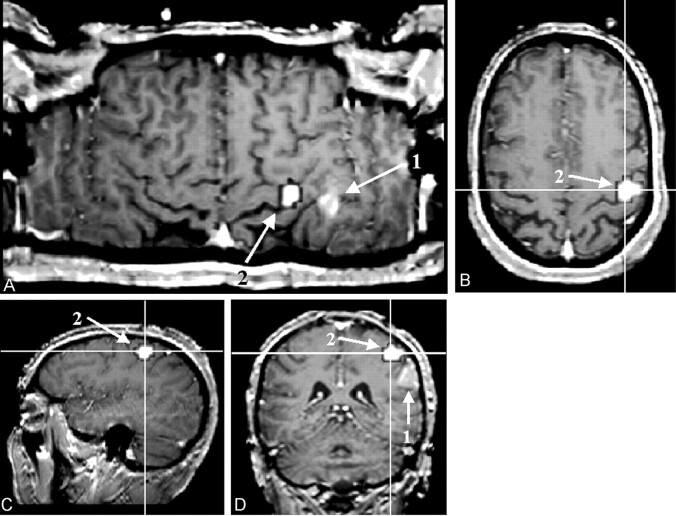
As opposed to the previously mentioned visualization methods, CSP displays the gyral and sulcal patterns of both hemispheres at the same time, enabling a direct side-to-side comparison of the gyral and sulcal patterns. This capability is exceedingly helpful for the identification of the exact sulcal and gyral topography of a space-occupying lesion. Because CSP does not rely on any assumption as the topologic structure of the anatomic reference dataset or on a segmentation process, deteriorated tissue contrast that goes along with cortical and subcortical lesions does not impair the accuracy of the results. With CSP, a multitude of anatomic landmarks, such as the bracket sign, the T sign, the Omega-sign, and so forth (9–10) (see Fig 4), can be visualized simultaneously. Therefore, even if a lesion destroys one or several landmarks, enough anatomic features should still be left to enable a direct topographic assignment. The orientation is consequently less time consuming as compared with the anatomic analysis of orthogonally reformatted datasets (11), (Fig 5).
Fig 4.
Figure shows the result of an finger-tapping experiment on a T1-weighted reference image (block design, self-paced finger tapping of the left hand). The examination was performed in the context of presurgical evaluation of a patient after recurrence of a frontocentral astrocytoma (World Health Organization grade III) in the right hemisphere. The tumor margins reach the precentral gyrus close to the hand area of the primary motor cortex. The motor area, as detected with fMRI, is marked in white (a). The central sulcus can be identified by using five anatomic features: 1, The superior frontal sulcus ends in the precentral gyrus (b). 2, The lower part of the precentral sulcus and the inferior sulcus define the T sign (c). 3, The bracket sign defines the interception of the marginal part of the cingulate sulcus and the central sulcus close to the midline (d). 4, The omega shape of the precentral gyrus defines the hand motor area, the hand knob of the primary motor cortex (e). 5, The relative thickness of the precentral gyrus to the postcentral gyrus (pre > post) can help in identifying the central sulcus (e)
Fig 5.
A direct comparison of a curved reconstruction (A) with orthogonal projections (B–D). The patient was admitted with a suspected central glioma (1). The curved projection reveals the location of the glioma as being posterior to the central sulcus; this is demarked by the functional overlay (2). It can be unmistakably assigned to the inferior parietal lobulus. On orthogonal projections, the assignment was more difficult and possible only after we browsed through all three projections (paradigm: block design, self-paced finger tapping of the right hand).
Nevertheless, we should mention at this point that the method just described helps in visualizing fMRI results, but it does not overcome the problem of potential misregistration between anatomic and functional datasets owing to the well-known artifacts of echo-planar imaging. These must especially be kept in mind when fMRI is used in a clinical setting.
From a practical point of view, an additional advantage of the curved reconstruction is its simplicity. The computational power needed is far less than that needed for flat-mounting techniques. Even on a low-budget computer, the reconstruction of the surfaces can be performed almost in real time; this ability makes the method suitable for daily, routine clinical use, without adding extra time or cost. The simplicity of the algorithm also allows us to incorporate information gained by using other techniques, such as electrophysiologic data, as provided by subdural electrode grids (12).
Curved-surface reconstructions can also aid in teaching brain anatomy by offering better visualization of the gyral and sulcal topology. By reformatting high-spatial-resolution T1-weighted images on curved planes, the anatomic connectivity between sulci and gyri becomes easily accessible. Different anatomic landmarks and their anatomic relation to each other can be visualized on one section. Therefore, this method can help in obtaining a better understanding of the anatomic relationship of cortical structures. Having internalized these relationships, one may find it easier to orient them on standard pathology sections.
Conclusion
CSP is a helpful, time-saving, and cost-effective method to display the spatial relationships among functions, lesions, and anatomy of the brain. The biggest advantage of CSP, compared with existing methods, is its ability to show the gyral and sulcal patterns of both hemispheres at the same time, simplifying their orientation on the reconstructed maps. Because this technique does not rely on any segmentation process or any assumption of the topologic structure of the anatomic reference dataset, CSP can be applied, even if the brain anatomy is largely distorted. The robustness and simplicity of the algorithm make CSP ideally suited for the clinical daily use in the presurgical planning and analysis of brain function.
References
- 1.Friston K, Holmes AP, Worsely KJ, Poline JB, Frith CD, Franckowiak RSJ. Statistical parametric maps in functional imaging: a general linear approach. Human Brain Mapping 1995;2:189–210 [Google Scholar]
- 2.Gomes J, Darsa L, Costa B, Velho L. Warping and Morphing of Graphical Objects. San Francisco: Morgan Kaufmann Publishers, Inc.1999;326–329
- 3.Sachs JM. A curious mixture of maps, dates, and names. Mathematics Magazine 1987;60:151–158 [Google Scholar]
- 4.Talairach J, Tournoux P. Co-planar stereotaxic atlas of the human brain. New York: Thieme;1988
- 5.Evans AC, Collins DL, Mills SR, Brown ED, Kelly RL, Peters TM. 3D statistical neuroanatomical models from 305 MRI volumes. Proceedings of the IEEE-Nuclear Science Symposium and Medical Imaging Conference. Chicago, IEEE;1993
- 6.Lancaster JL, Woldorff MG, Parsons LM, et al. Automated Talairach atlas labels for functional brain mapping. Hum Brain Mapp 2000;10:120–131 [DOI] [PMC free article] [PubMed] [Google Scholar]
- 7.Dale AM, Fischl B, Sereno MI. Cortical surface-based analysis, I: segmentation and surface reconstruction. NeuroImage 1999;9:179–194 [DOI] [PubMed] [Google Scholar]
- 8.Fischl B, Sereno MI, Dale AM. Cortical surface-based analysis, II: inflation, flattening, and a surface-based coordinate system. NeuroImage 1999;9:195–207 [DOI] [PubMed] [Google Scholar]
- 9.Naidich TP, Brightbill TC. Systems for localizing fronto-parietal gyri and sulci on axial CT and MRI. Int J Neuroradiology 1996;2:313–338 [Google Scholar]
- 10.Naidich TP, Valavanis AG, Kubik S. Anatomic relationships along the low-middle convexity: normal specimens and MRI. Neurosurgery 1995;36:517–532 [DOI] [PubMed] [Google Scholar]
- 11.Braks E, Hattingen J, Clussmann H, Meyer B, Urbach H, Schild H. Die Hirnoberfläche als “Landkarte”- eine hilfreiche Ansicht zur Lokalisation zerebraler Läsionen? 81. Deutscher Röntgenkongress; May 31–June 3,2000; Wiesbaden, Germany
- 12.Koenig R, Urbach H, Oertzen J von, et al. Entwicklung eines neuen Algorithmus zur Projektion von Gitterelektroden auf planare Hirnoberflächenprojektionen (sog. Pancake-Reformatierung). 83. Deutscher Röntgenkongress; May 8–11,2002; Wiesbaden, Germany


