

Abstract
BACKGROUND AND PURPOSE: Perfusion measurement in multiple sclerosis (MS) may cast light on the disease pathogenesis and lesion development since vascular pathology is frequently demonstrated in the disease. This study was performed to investigate the perfusion characteristics in MS lesions using dynamic susceptibility contrast MR imaging (DSC-MRI) to better understand the hemodynamic changes in MS.
METHODS: Seventeen patients with relapsing-remitting MS were studied with DSC-MRI. Perfusion measurements included cerebral blood flow (CBF), cerebral blood volume (CBV), and mean transit time (MTT), were obtained in enhancing, non-enhancing lesions covered by DSC-MRI and contralateral normal appearing white matter (NAWM) in patients as well as normal white matter in seventeen control subjects.
RESULTS: DSC-MRI data demonstrated reduced perfusion with significantly prolonged MTT (P < 0.001) in lesions and NAWM in patients compared with normal white matter in controls. Compared to contralateral NAWM, enhancing lesions demonstrate increased CBF (P = 0.007) and CBV (P < 0.0001), indicating inflammation-mediated vasodilatation. A K means cluster analysis was performed and identifies approximately 63.8% of non-enhancing lesions (Class 1) with significantly decreased perfusion (P ≤ 0.0001) when compared with contralateral NAWM. In contrast, the remainder 36.2% non-enhancing lesions (Class 2) show increased CBV (P = 0.02) in a similar fashion to enhancing lesions and can be observed on quantitative color-coded maps even without blood-brain barrier breakdown.
CONCLUSION: DSC-MRI measurements demonstrate potential for investigating hemodynamic abnormalities that are associated with inflammatory activity, lesion reactivity and vascular compromise in MS lesions. Non-enhancing lesions showed both low and high perfusion suggesting microvascular abnormalities with hemodynamic impairment and inflammatory reactivity that cannot be seen on conventional MRI.
It has long been noted that vascular inflammation in the brain is the critical event in the pathogenesis of multiple sclerosis (MS) (1) and that MS plaques typically develop along venous structures that form the so called “Dawson’s fingers” (2). Cerebrovascular perfusion can be potentially altered due to the close relationship (3) between MS lesions and vascular pathology. Recently, there have been histopathological studies (4–6), in which a hypoxia-like tissue injury was identified with suggestion of hemodyanamic impairment in relation to lesion pathogenesis of MS. Early work (7, 8) has also observed vascular occlusive changes that are associated with early endothelial cell activation and fibrin deposition in the vessels. However, prior imaging studies in MS have focused principally on brain tissue structural disruption due to the inflammatory demyelinating process of the disease; few have investigated and little is known about the pathophysiological perfusion changes in MS.
Advances in MRI allow the assessment of brain hemodynamics in vivo by applying dynamic susceptibility contrast MRI (DSC-MRI), a technique now gaining more widespread utility in clinical practice. So far, only a few studies (9, 10) have applied this technique in MS, however, they have used a relative perfusion method expressed as a ratio to the contralateral normal appearing white matter (NAWM) as a reference for calculating lesion perfusion. In this study, the perfusion measurements were based on an arterial input function (AIF) (11) in order to avoid the potential error of taking measurements relative to “NAWM” which is actually pathologically abnormal and hence is unsuitable as a reference in MS. We present hemodynamic abnormalities in patients with relapsing-remitting MS to investigate cerebral hemodynamics and attempt to characterize the vascular pathology of different lesion types and NAWM according to their perfusion abnormalities. Our hypothesis is that microvascular abnormalities, which are related to the vascular inflammatory and occlusive changes, can be detected by measurements of perfusion parameters using DSC-MRI in MS.
Methods
Subjects
Seventeen patients with clinical relapsing remitting MS disease were recruited by a board certified neurologist (J.H.). Informed consent was obtained in all patients to participate in this study. There are five male and twelve female patients with the median age of 38.4 years (range: 27.6 to 56.9 years). The median disease duration was 2.7 years (0.3 to 17.0 years). Fourteen of seventeen patients were receiving immunomodulating therapy; twelve patients were on Interferon β1-a and two patients were receiving copolymer 1. No patients receiving systemic corticosteroids within 3 months prior to the study were included. For comparison, seventeen control subjects (7 men, 10 women) were also recruited with a median age of 43.3 years (range: 20.2–62.5 years). These patients had no history of cerebrovascular disease, evidence of small vessel ischemic disease, no substantial intracranial pathology in MR imaging.
MR Imaging
All patients were studied using a 1.5T MR scanner (Vision, Siemens Medical Systems, Malvern, Pa). The protocol includes transverse dual echo T2-weighted (TR/TE: 3400/17,119 msec), non-enhanced T1-weighted (TR/TE: 600/14 msec), and FLAIR imaging (TR/TE/TI: 9000/110/2500 msec). DSC-MRI was performed in transverse plane using a gradient-echo echo planar sequence with the following parameters: TR/TE/flip angle: 1000/54/30°, field of view: 230 × 230 mm; slice thickness: 5 mm; matrix: 128 × 128; in-plane voxel size: 1.8 × 1.8 mm; signal bandwidth: 1470 Hz/pixel. Prior to scanning, an 18- or 20-gauge intravenous catheter placed in the antecubital fossa for the purpose of contrast administration. The imaging was performed during the first pass of a standard dose (0.1 mmol/kg) bolus of gadopentetate dimeglumine and a series of 60 DSC-MRI images were acquired at one-second intervals during the first pass of contrast agent. The injection was performed at the 10th acquisition at a speed of 5 ml/sec using an MR-compatible power injector, immediately followed by a bolus injection of saline at the same injection rate. Post-contrast transverse T1-weighted (TR/TE: 600/14 msec) images were then obtained following DSC-MRI sequence.
Image Data Processing
The DSC-MRI images were sent to an off-line SUN Sparc Ultra 10 workstation (Sun Microsystems, Mountain View, CA) for further postprocessing. The perfusion data was analyzed using software developed in-house based on the C and IDL (RSI, Boulder, CO) programming languages. Absolute perfusion parameters such as cerebral blood volume (CBV), cerebral blood flow (CBF), and mean transit time (MTT) were calculated by standard algorithms (11–13). Although, the algorithms assume that contrast agent remains in the vascular compartment with no recirculation or leakage, these assumptions are often violated in the clinical cases, however, the effects were corrected or reduced by fitting a gamma-variate function (14) to the measured ΔR2* curve and simply by only including the first pass without T1 effects become evident (15).
The concentration of intravascular contrast agent is proportional to the change of relaxation rate, ΔR2*, which can be calculated from the signal intensity with the following equation:
 |
1) |
where S(t) is the signal intensity at time t, S0 is the precontrast signal intensity, and TE is the echo time. The concentration time curves that result from an idealized instantaneous bolus through brain vasculature are first estimated by deconvolving the measured curves with the AIF. It can then be shown that
 |
2) |
 |
3) |
and
 |
4) |
where C is the idealized tissue concentration, Cmax is its maximum.
The AIF was obtained by an automated AIF algorithm (11, 16), which has less operator selection bias than manual estimation. The average signal drop and average bolus arrival time are first calculated for all pixels. Pixels where the bolus arrives early and where the signal drop is larger than average are assumed to be within arteries. The AIF is estimated by averaging the signals from all such pixels.
For the measurement of hemodynamic parameters, the regions of interest (ROIs) consisting 2 pixels were carefully placed in lesions and corresponding contralateral NAWM regions based on the perfusion images after visual co-registration with the axial T2-weighted and postcontrast T1-weighted images. Lesions with area size smaller than the fixed ROI (radius = 1 image pixel, 1.8 mm) will be excluded to avoid partial volume effects and lesions with area size much larger than fixed ROI were measured based on an averaged value from several ROIs within the lesion. Since the number of enhancing lesions is relatively small (n = 17) and only 2 ring enhancements were detected with DSC-MRI, we did not make comparisons between ring and nodular enhancing patterns. The images for the selected slice during the passage of intravascular gadopentetate dimeglumine were first inspected for overall image quality and exclusion of arterial and venous structures in the chosen ROIs. The NAWM data was obtained by placing the ROI in the NAWM contralateral to the measured lesions. Finally, color-coded maps of CBV, CBF, and MTT with the application of threshold were computed and generated by pixel-by-pixel basis for better visualizing the differences between tissues. Both enhancing and non-enhancing lesions on T1-weighted imaging were evaluated with DSC-MRI.
Statistical Analysis
A K means cluster analysis applied to the perfusion measures (CBF, CBV, MTT) associated with the lesions of MS patients resulted in the identification of three distinct lesion types: (1) enhancing, (2) non-enhancing with perfusion characteristics similar to enhancing lesions, and (3) non-enhancing with perfusion characteristics markedly dissimilar to enhancing lesions. Mixed model analysis of covariance (ANCOVA) was used to compare the lesions of each type to the NWM of control subjects and to compare the NAWM of MS patients contralateral to lesions of different types to each other and to NWM of controls with respect to CBF, CBV and MTT. A separate univariate analysis was conducted for each perfusion measure. In each case, the perfusion measure was the dependent variable and the statistical model included lesion type as a fixed classification factor and subject age and gender as fixed covariates. The correlation structure introduced by the acquisition of data from multiple lesions or ROI within the same subject was modeled by assuming that model error terms were independent or exchangeable when associated with the same or different patients, respectively.
Results
A total of 75 lesions on conventional T2-weighted and postcontrast T1-weighted imaging were identified and studied on DSC-MRI. These include seventeen enhancing lesions and 58 non-enhancing lesions, which had been covered by the DSC-MRI dataset. In addition, seventy-five NAWM areas from the side contralateral to the lesions in patients and sixty-eight white matter areas in control group were also measured.
A K means cluster analysis applied to the perfusion measures (i.e. CBF, CBV, and MTT) associated with the lesions of MS patients resulted in the construction of 3 clusters. An examination of the constitution and perfusion characteristics of each cluster, as shown in Figure 1, suggests a classification of non-enhancing lesions into two groups of those without (Class 1) and those with (Class 2) perfusion measures similar to that of enhancing lesions. Thus, the cluster analysis resulted in the identification of three distinct lesion types: (1) enhancing, (2) Class 1 non-enhancing lesions with perfusion characteristics markedly dissimilar to enhancing lesions, and (3) Class 2 non-enhancing lesions with perfusion characteristics similar to enhancing lesions. The perfusion characteristics of the three lesion types and the corresponding contralateral NAWM in patients as well as those of normal white matter from controls are summarized in Table 1. Approximately 63.8% (n = 37) of the non-enhancing lesions were classified as Class 1 and were associated with perfusion measures unlike those of enhancing lesions in the sense of having low CBF (all 37 Class 1 non-enhancing lesions, but only 1 enhancing lesion had CBF < 13.52), low CBV (mean = 0.8 versus 1.4 for enhancing lesions) and high MTT (mean = 6.30 versus 4.98 for enhancing lesions). Approximately 36.2% (n = 21) of non-enhancing lesions were classified as Class 2 and were associated with perfusion measurements that are not distinguishable from those of enhancing lesions (Table 1), suggesting that a subtype of chronic non-enhancing lesions can be identified on the basis of their perfusion measures.
Fig 1.

A K means cluster analysis applied to perfusion measures (CBF and CBV) of MS lesions results in the construction of 3 clusters of enhancing and non-enhancing lesion types and suggests a further classification of non-enhancing lesions into two subtypes (class 1 [characteristics distinct from enhancing lesions] and class 2 [characteristics similar to enhancing lesions]).
TABLE 1:
Mean and standard deviation of each perfusion measure in lesions and normal-appearing white matter in patients with multiple sclerosis compared with those of normal white matter in control subjects
| Lesion/Region | Cerebral Blood Flow | Cerebral Blood Volume | Mean Transit Time |
|---|---|---|---|
| Enhancing | 21.5 ± 5.1 | 1.4 ± 0.3 | 5.0 ± 1.4¶ |
| Nonenhancing: class 1 | 10.2 ± 1.8¶ | 0.8 ± 0.2£ | 6.3 ± 1.2¶ |
| Nonenhancing: class 2 | 20.9 ± 5.8 | 1.6 ± 0.5£ | 4.8 ± 0.7¶ |
| NAWM: contralateral to enhancing | 16.9 ± 3.7§ | 1.06 ± 0.3 | 5.0 ± 1.5¶ |
| NAWM: contralateral to class 1 | 16.1 ± 5.9§ | 1.09 ± 0.3 | 5.1 ± 1.0¶ |
| NAWM: contralateral to class 2 | 18.3 ± 6.9§ | 1.24 ± 0.3 | 4.6 ± 0.9¶ |
| Normal white matter (control group) | 28.3 ± 10.3 | 1.2 ± 0.5 | 1.3 ± 0.5 |
Enhancing indicates enhancing lesions; nonenhancing: class 1, nonenhancing lesions with decreased perfusion and perfusion measures dissimilar to those of enhancing lesions; nonenhancing: class 2, nonenhancing lesions with increased perfusion and perfusion measures similar to those of enhancing lesions; NAWM, normal appearing white matter. The Dunnett-Hsu corrected significance levels for the comparison of each lesion type and normal-appearing white matter to control normal white matter with respect to each perfusion measure are also reported here, and values of significance at the familywise levels are highlighted as
: P < .001,
: P ≤ .01,
: P < .05.
Since the clusters and concomitant lesion types were constructed so as to maximize between cluster and lesion type differences with respect to CBF, CBV, and MTT, the data could not meaningfully be used to compare lesion types with respect to the perfusion measures. However, lesions of each type and corresponding NAWM were compared to the normal white matter of control subjects using mixed model ANCOVA with a Dunnett-Hsu correction to maintain the familywise type I error rate for comparisons to the control normal white matter at the nominal 5% level. The comparison results are also reported in Table 1. We note that, relative to the white matter of controls, all 3 types of lesions and NAWM showed significantly prolonged MTT (P < 0.0001) and there was a trend toward decreased CBF for both enhancing (P = 0.07) and Class 2 non-enhancing lesions (P = 0.05) although the CBV of these two lesion types were slightly higher. Class 1 non-enhancing lesions showed significant hypoperfusion compared with control normal white matter with decreased CBF (P < 0.01) and increased MTT (P < 0.001).
The comparisons (P values) between each type of lesion and corresponding contralateral NAWM of each perfusion measure were summarized in Table 2. Enhancing lesions have significantly increased CBF (P = 0.007) and CBV (P < 0.0001) as shown on color-coded maps in Figure 2, but no significant difference in MTT as compared with contralateral NAWM. Class 1 non-enhancing lesions (n = 37) showed significant hypoperfusion (P ≤ 0.0001) in terms of decreased CBF and CBV and increased MTT as compared with contralateral NAWM, and these can be observed on CBF and MTT color maps in Figure 3. However, as shown in Figure 4, the Class 2 non-enhancing lesions (n = 21) show significantly higher CBV (P = 0.016) as compared with contralateral NAWM in MS patients, indicating that not all chronic non-enhancing lesions have the same perfusion changes.
TABLE 2:
Comparisons of perfusion measures (cerebral blood flow, cerebral blood volume, and mean transit time) in patients with multiple sclerosis of each lesion type with their contralateral normal-appearing white matter
| Lesion Type | Cerebral Blood Flow (P) | Cerebral Blood Volume (P) | Mean Transit Time (P) |
|---|---|---|---|
| Enhancing | .007 | <.0001 | .99 |
| Nonenhancing: class 1 | <.0001 | .0001 | <.0001 |
| Nonenhancing: class 2 | .16 | .02 | .12 |
Enhancing indicates enhancing lesions; nonenhancing: class 1, nonenhancing lesions with decreased perfusion and perfusion measures dissimilar to those of enhancing lesions; nonenhancing: class 2, nonenhancing lesions with increased perfusion and perfusion measures similar to those of enhancing lesions.
Fig 2.

CBF and CBV color-coded maps obtained in a patient with an enhancing lesion show increased perfusion (black arrows) in the enhancing lesion compared with perfusion in contralateral NAWM.
Fig 3.
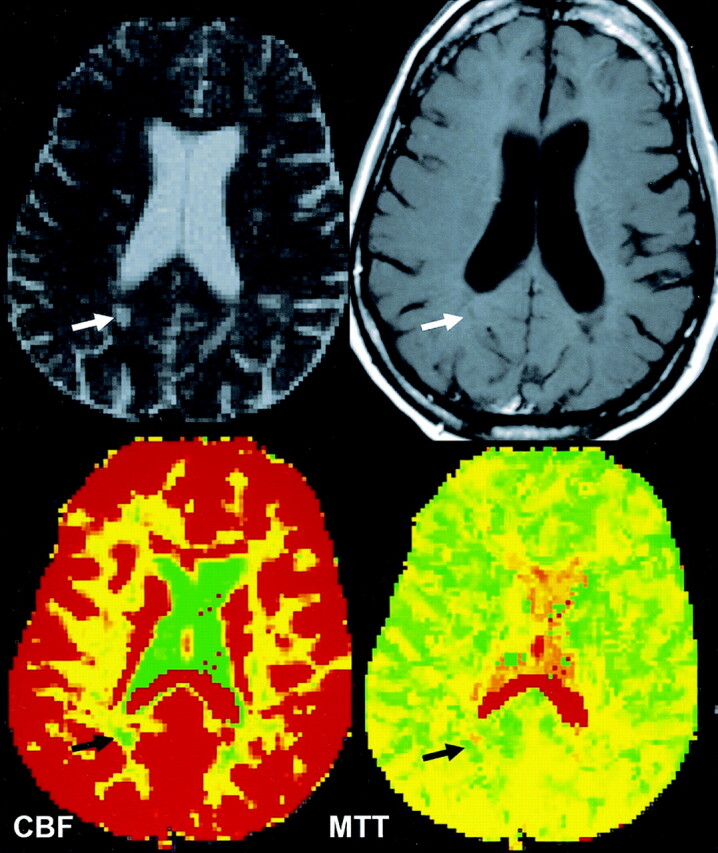
CBF and MTT color-coded maps obtained in a patient with a nonenhancing lesion show decreased perfusion with decreased CBF and increased MTT (black arrows) compared with those measures in contralateral NAWM.
Fig 4.

CBF and CBV color-coded maps obtained in two patients with nonenhancing lesions show the various degree of increased perfusion (black arrows) in class 2 lesions compared with that of contralateral NAWM.
Figure 5 illustrates the comparisons and overlap in the CBF (Fig 5A) and CBV (Fig 5B) for different lesions and NAWM in patients as well as normal white matter in controls by using bar graphs. The mean and standard deviation of CBF and CBV values for NAWM demonstrated here are from all the measured NAWM areas. Although there are significant differences of CBF and CBV found between enhancing lesions and contralateral NAWM (Table 2), the overlap is increased when values are taken from all NAWM areas instead of corresponding NAWM, indicating regional variation of NAWM perfusion in different locations in MS patients.
Fig 5.

Bar graphs show the mean ± SD of CBF (A) and CBV (B) in different types of lesions and all NAWM areas obtained in patients and measures in normal white matter (WM) areas obtained in control subjects. Despite the large overlap of CBV measurements between normal WM and those of lesions and NAWM, CBF is generally lower in both lesions and NAWM compared with normal WM in controls.
Discussion
The addition of DSC-MRI to routine, conventional MRI protocols can provide physiological assessment of cerebral blood flow and perfusion in patients with MS. Our results, using DSC-MRI perfusion measurements based on AIF, suggest that cerebral hemodynamic impairment can be found in various lesion types, and importantly, can be detected without BBB disruption as shown in Class 2 non-enhancing lesions. The data also confirm previous histopathologic evidence of vascular occlusion (7) and/or hypoxia-like tissue injury (6) in MS. In particular, three important observations emerge from our data. First, there is a reduced blood flow in all MS lesions as reflected by significantly prolonged MTT and decreased CBF compared with normal values taken from white matter areas in controls. Second, inflammatory activity can cause compensative vasodilatation and result in increased CBF and CBV, found in enhancing lesions. Lastly, increased perfusion in some chronic non-enhancing lesions (Class 2) may indicate lesion reactivity with new vascular inflammatory changes.
The measurement of perfusion parameters based on artery input function (AIF) used in this study enables more reliable and reproducible measurements of CBF, CBV and MTT in lesions and NAWM. This is because measurements of relative cerebral blood volume (rCBV) where perfusion parameters are made relative to the contralateral white matter may be erroneous, as we already know that the NAWM is abnormal in MS and the perfusion in white matter is not homogeneously distributed even in control subjects (17). Therefore it is inappropriate to use diseased tissue as the internal reference for relative perfusion measurements of lesion. The perfusion measurement of NAWM in MS using relative method is also meaningless and inaccurate because NAWM is the target tissue, instead of a reference, for measurement. Using AIF where the reference is the concentration of contrast material in blood to provide quantification of perfusion probably provides a much more stable signal reference than a reference in NAWM. Furthermore, as MS is a disease likely affecting the microvenous system, the AIF, taken from larger arteries is less likely to be affected by disease pathology.
Although MS has been extensively studied in the last few decades, a nidus still remains in general knowledge that has not been addressed concerning vascular hemodynamic impairment. This is partially due to the technical difficulty in measuring cerebral blood flow in either postmortem or living human subjects. Nevertheless, optimal human brain function is critically dependent on the flow of blood circulating through the brain. Techniques, such as DSC-MRI, have been recently developed in clinical studies to measure cerebral perfusion (i.e., CBF, CBV, and MTT) in vivo and used as diagnostic and research tools in many brain disorders (18–20), particularly in patients with stroke (21–23). However, few prior imaging studies have examined cerebral perfusion in MS. In the present study, we found both lesions and NAWM showed reduced perfusion (prolonged MTT and decreased CBF) in MS patients compared with those in the control group by using DSC-MRI. This is consistent with the earlier histopathological work (7, 8), in which the vascular occlusive changes were observed in MS and may have effects on brain hemodynamics.
We interpret the diminished perfusion in MS as a primary vascular pathology rather than decreased metabolic demand, and there are several possible explanations for this hypothesis. First, earlier and recent histopathological studies showed evidence that the vascular occlusive changes could present in MS due to fibrin deposition and thrombosis of vessels (7, 8). These occlusive changes can be found in the acute phase even in the absence of apparent inflammatory infiltration (8). Adams (24) also described edematous onion-skin and hyalinized changes of the vein wall. Second, studies (25) have found vascular abnormalities such as fluorescein leakage and perivenous sheathing can be found in the retinal venules, a region free of myelin and oligodendrocytes in patients with optic neuritis that progressed to MS. Third, very recently, Lassmann et al (6) also pointed out that there are apoptotic nuclear changes in oligodendrocytes associated with the preferential loss of myelin proteins, however, this condition of oligodendrogliopathy was found most consistently with acute white matter stroke (4, 26), suggesting hypoxia may be one of the pathogenetic components in MS. Lastly, recent research has shown that cholesterol-lowering drugs (particularly the “statins”) could be beneficial in treatment of MS (27) and plasma cholesterol level is increased during the disease activity after a first demyelinating event (28). Thus, the mechanism related to a primary ischemic pathogenesis due to vascular abnormality might be involved in the MS lesion and NAWM pathology of the disease.
We also found that enhancing lesions demonstrated increased CBF (P = 0.007) and CBV (P < 0.0001) relative to contralateral NAWM, which can also be observed on color-coded maps (Fig 2). However, although CBF and CBV of the enhancing lesions are higher than those of NAWM, they are still lower and with significantly prolonged MTT (P < 0.0001) as compared with those of normal white matter in control group, suggesting that local inflammatory induced increased perfusion or vasodilatation may be occurring on an ischemic background. The brain has a substantial reserve and autoregulatory ability to preserve perfusion above the threshold for frank ischemia or infarction. As seen in other systems, vascular inflammation in central nervous system can also cause vasodilatation and increased blood flow. In addition, the vasculitis-mediated injury within vessel walls can stimulate perivascular cells to secret a number of vasoactive factors, which could modulate vascular tone and cerebral blood flow (29). For example, nitric oxide synthesis (iNOS) and cytokines interleukin 1 and 6, as well as tumor necrosis factor alpha (TNF-α) that can be secreted by T-lymhocytes and pericytes pleiotropic cells, were found expressed in MS (30–32).
Our observation of increased perfusion (CBF and CBV) in enhancing lesions may indicate DSC-MRI is sensitive in detecting lesion inflammatory activity in acute phase of disease. The current data of enhancing lesions is consistent with the findings in the recent other studies (9), in which a relative DSC-MRI method was used. In our study, compared with contralateral NAWM, we did not find a significant difference in MTT for enhancing lesions, suggesting that the transit time is not prolonged in these enhancing lesions. Although CBV may not be sensitive in detecting tissue ischemia because of possible autoregulatory increase in blood volume due to ischemia, it is considered as a sensitive marker for neovascularity in tumor angiogenesis (33) and potentially also for vasodilatation from vascular inflammatory activity. Compared to CBV, MTT is felt to be a more sensitive marker of ischemia in stroke (34), partly as it is closely related to cerebral perfusion pressure. The significantly increased MTT in both lesions and NAWM found in this study supports the hypothesis of an ischemic component in MS pathology.
Interestingly, we found that not all chronic non-enhancing lesions showed hypoperfusion and indeed, some non-enhancing lesions (Class 2) demonstrated increased CBF and CBV (P = 0.02) in a similar fashion to enhancing lesions when compared with NAWM. Non-enhancing lesions are less likely to demonstrate perivenular inflammation and often have thickened hyalined vein walls (24); however, new lesions or new inflammatory activity (35) is likely to be formed around these chronic lesions. It is possible that renewed inflammatory activity may occur in these non-enhancing lesions or in the adjacent tissues resulting in increased perfusion (Fig 4), which can now be detected in the absence of gadolinium enhancement or BBB disruption. Therefore, this finding is important in providing the additional data that perfusion imaging may have predictive role of lesion reactivity and/or new lesion formation. This is supported by a very recent report by Wuerfel et al (10) in which the increased local perfusion is detected prior to the BBB breakdown and precedes lesion formation. Similar to enhancing lesions, MTT is not significantly altered in these increased perfusion regions, indicating a mechanism of inflammatory vasodilatation.
The findings of this study with regard to the NAWM were in accordance with a previous study of NAWM perfusion. Law et al (17) reported that there is significantly decreased perfusion in periventricular regions in MS patients as compared with control groups. In the current study, we measured the perfusion in the NAWM contralateral to the lesions for comparison in order to avoid the regional variability. This ability to detect changes in NAWM perfusion has also prompted us to measure large amounts of segmented white matter with DSC-MRI. The potential for in vivo examination of the entire brain or NAWM with DSC MRI and quantifying the global subtle hemodynamic impairment may be useful in predicting disease activity, monitoring disease progression or the effects of therapy.
Our results indicate that vascular hemodynamic abnormality is a significant component in the pathophysioloy of MS lesions. This may have important clinical implications in both disease pathogenesis and development of experimental therapies in MS. For example, very recent histopathological studies have suggested that there is an ischemic mechanism of demyelination in one lesion type and in a subgroup of MS patients (4, 6). Studies have also reported that cholesterol-lowering statin drugs have potential efficacy in the treatment of MS (27) and the fact that myelin destruction can be due to pathology without active inflammation (36), indicating initial hypoxic/ischemic tissue damage may occur followed by subsequent demyelination. The results of the present study of diminished perfusion in MS lesions support the findings in these studies and suggest that DSC-MRI can be used as a paraclinical tool in monitoring of new targets for therapy of MS. In addition, our data confirmed the heterogeneity of MS lesions (37) and the ability in classifying or differentiating lesions according to their perfusion characteristics suggests that DSC-MRI has the potential to identify the new lesion activity or reactivity before BBB disruption and might be useful in modulating therapy based on the microcirculation changes of lesions.
There are several limitations to this study. First, there is no comparative pathological data in our study although for obvious reasons, such dynamic intracerebral perfusion alterations cannot be measured in the post-mortem human brains. Second, our data is not longitudinal and it is unknown whether the increased perfusion in class-2 nonenhancing lesions precedes new lesions. Given the fact that chronic lesions can often be reactive and recent study showing perfusion changes in NAWM precede new enhancing lesions (10), perfusion changes in class-2 lesions likely represent new inflammatory activity. Third, it is possible that the diffusion weighted imaging (DWI) or diffusion tensor imaging (DTI), which was not included in our study, may help to interpret the findings of our DSC-MRI data since perfusion and diffusion imaging are commonly used in stroke studies for characterizing tissue ischemic changes. It is important to note that DWI is very sensitive only in detecting early or acute ischemic lesions, positive DWI signs (decreased ADC) are difficult to elucidate in MS and most MS studies of DWI have shown uniformly increased ADC in both lesions and NAWM due in part to the edema and chronicity of the disease process (38). It is also important to note that although there appears to be ischemic white matter injury in MS patients, the underlying mechanisms may differ from that in stroke patients. In MS, the ischemia is likely to represent venous pathology (39, 40), rather than arterial occlusion, that results in hemodynamic changes.
Conclusion
The present investigation indicates that measurements of cerebral blood perfusion by DSC-MRI can provide additional information of microvascular abnormalities that may be associated with lesion development, lesion activity, and lesion reactivity in MS. Further studies investigating the correlation between DSC-MRI with clinical functional impairment and disease progression as well as monitoring therapeutic effects will be envisioned.
Footnotes
Supported in part by grants R37 NS 29029-11 from the National Institutes of Health and NCRR M01 RR00096 (GCRC).
References
- 1.Putnam TJ. The pathogenesis of multiple sclerosis: a possible vascular factor. N Engl J Med 1933;209:786–790 [Google Scholar]
- 2.Dawson JW. The histology of disseminated sclerosis: transactions of the Royal Society of Edinburgh.1916;50:517–740 [Google Scholar]
- 3.Tanaka R, Iwasaki Y, Koprowiski H. Ultrastructural studies of perivascular cuffing cells in multiple sclerosis brain. Am J Pathol 1975;81:467–478 [PMC free article] [PubMed] [Google Scholar]
- 4.Lucchinetti C, Bruck W, Parisi J, Scheithauer B, Rodriguez M, Lassmann H. Heterogeneity of multiple sclerosis lesions: implications for the pathogenesis of demyelination. Ann Neurol 2000;47:707–717 [DOI] [PubMed] [Google Scholar]
- 5.Lassmann H, Reindl M, Rauschka H, et al. A new paraclinical CSF marker for hypoxia-like tissue damage in multiple sclerosis lesions. Brain 2003;126(Pt 6):1347–1357 [DOI] [PubMed] [Google Scholar]
- 6.Lassmann H. Hypoxia-like tissue injury as a component of multiple sclerosis lesions. J Neurol Sci 2003;206:187–191 [DOI] [PMC free article] [PubMed] [Google Scholar]
- 7.Putnam TJ. Evidences of vascular occlusion in multiple sclerosis and encephalomyelitis. Arch Neurol Neuropsychol 1935;32:1298–1321 [Google Scholar]
- 8.Wakefield AJ, More LJ, Difford J, McLaughlin JE. Immunohistochemical study of vascular injury in acute multiple sclerosis. J Clin Pathol 1994;47:129–133 [DOI] [PMC free article] [PubMed] [Google Scholar]
- 9.Haselhorst R, Kappos L, Bilecen D, et al. Dynamic susceptibility contrast MR imaging of plaque development in multiple sclerosis: application of an extended blood-brain barrier leakage correction. J Magn Reson Imaging 2000;11:495–505 [DOI] [PubMed] [Google Scholar]
- 10.Wuerfel J, Bellmann-Strobl J, Brunecker P, et al. Changes in cerebral perfusion precede plaque formation in multiple sclerosis: a longitudinal perfusion MRI study. Brain 2004;127(Pt 1):111–119 [DOI] [PubMed] [Google Scholar]
- 11.Rempp KA, Brix G, Wenz F, Becker CR, Guckel F, Lorenz WJ. Quantification of regional cerebral blood flow and volume with dynamic susceptibility contrast-enhanced MR imaging. Radiology 1994;193:637–641 [DOI] [PubMed] [Google Scholar]
- 12.Ostergaard L, Weisskoff RM, Chesler DA, Gyldensted C, Rosen BR. High resolution measurement of cerebral blood flow using intravascular tracer bolus passages. Part I. Mathematical approach and statistical analysis. Magn Reson Med 1996;36:715–725 [DOI] [PubMed] [Google Scholar]
- 13.Wirestam R, Andersson L, Ostergaard L, et al. Assessment of regional cerebral blood flow by dynamic susceptibility contrast MRI using different deconvolution techniques. Magn Reson Med 2000;43:691–700 [DOI] [PubMed] [Google Scholar]
- 14.Ostergaard L, Hochberg FH, Rabinov JD, et al. Early changes measured by magnetic resonance imaging in cerebral blood flow, blood volume, and blood-brain barrier permeability following dexamethasone treatment in patients with brain tumors. J Neurosurg 1999;90:300–305 [DOI] [PubMed] [Google Scholar]
- 15.Wong JC, Provenzale JM, Petrella JR. Perfusion MR imaging of brain neoplasms. AJR Am J Roentgenol 2000;174:1147–1157 [DOI] [PubMed] [Google Scholar]
- 16.Carroll TJ, Rowley HA, Haughton VM. Automatic calculation of the arterial input function for cerebral perfusion imaging with MR imaging. Radiology 2003;227:593–600 [DOI] [PubMed] [Google Scholar]
- 17.Law M, Saindane AM, Ge Y, et al. Microvascular abnormality in relapsing-remitting multiple sclerosis: perfusion MR imaging findings in the normal-appearing white matter. Radiology 2004;231:645–652 [DOI] [PubMed] [Google Scholar]
- 18.Law M, Cha S, Knopp EA, Johnson G, Arnett J, Litt AW. High-grade gliomas and solitary metastases: differentiation by using perfusion and proton spectroscopic MR imaging. Radiology 2002;222:715–721 [DOI] [PubMed] [Google Scholar]
- 19.Calamante F, Lythgoe MF, Pell GS, et al. Early changes in water diffusion, perfusion, T1, and T2 during focal cerebral ischemia in the rat studied at 8.5 T. Magn Reson Med 1999;41:479–485 [DOI] [PubMed] [Google Scholar]
- 20.Chang L, Ernst T, Leonido-Yee M, Speck O. Perfusion MRI detects rCBF abnormalities in early stages of HIV-cognitive motor complex. Neurology 2000;54:389–396 [DOI] [PubMed] [Google Scholar]
- 21.Aronen HJ, Perkio J, Karonen JO, et al. Perfusion-weighted MRI in human acute ischemic stroke: a comparison with the progression of the infarct on diffusion-weighted images. Acad Radiol 2002;9 (suppl 1):S160–S164 [DOI] [PubMed] [Google Scholar]
- 22.Derdeyn CP, Powers WJ, Grubb RL Jr. Hemodynamic effects of middle cerebral artery stenosis and occlusion. AJNR Am J Neuroradiol 1998;19:1463–1469 [PMC free article] [PubMed] [Google Scholar]
- 23.Aksoy FG, Lev MH. Dynamic contrast-enhanced brain perfusion imaging: technique and clinical applications. Semin Ultrasound CT MR 2000;21:462–477 [DOI] [PubMed] [Google Scholar]
- 24.Adams CW, Poston RN, Buk SJ. Pathology, histochemistry and immunocytochemistry of lesions in acute multiple sclerosis. J Neurol Sci 1989;92:291–306 [DOI] [PubMed] [Google Scholar]
- 25.Lightman S, McDonald WI, Bird AC, et al. Retinal venous sheathing in optic neuritis: its significance for the pathogenesis of multiple sclerosis. Brain 1987;110(Pt 2):405–414 [DOI] [PubMed] [Google Scholar]
- 26.Semenza GL. Surviving ischemia: adaptive responses mediated by hypoxia-inducible factor 1. J Clin Invest 2000;106:809–812 [DOI] [PMC free article] [PubMed] [Google Scholar]
- 27.Zamvil SS, Steinman L. Cholesterol-lowering statins possess anti-inflammatory activity that might be useful for treatment of multiple sclerosis. Neurology 2002;59:970–971 [DOI] [PubMed] [Google Scholar]
- 28.Giubilei F, Antonini G, Di Legge S, et al. Blood cholesterol and MRI activity in first clinical episode suggestive of multiple sclerosis. Acta Neurol Scand 2002;106:109–112 [DOI] [PubMed] [Google Scholar]
- 29.Sims DE. Recent advances in pericyte biology: implications for health and disease. Can J Cardiol 1991;7:431–443 [PubMed] [Google Scholar]
- 30.Chakravarthy U, Stitt AW, McNally J, Bailie JR, Hoey EM, Duprex P. Nitric oxide synthase activity and expression in retinal capillary endothelial cells and pericytes. Curr Eye Res 1995;14:285–294 [DOI] [PubMed] [Google Scholar]
- 31.Hirschi KK, D’Amore PA. Pericytes in the microvasculature. Cardiovasc Res 1996;32:687–698 [PubMed] [Google Scholar]
- 32.Seilhean D, Kobayashi K, He Y, et al. Tumor necrosis factor-alpha, microglia and astrocytes in AIDS dementia complex. Acta Neuropathol (Berl) 1997;93:508–517 [DOI] [PubMed] [Google Scholar]
- 33.Cha S, Knopp EA, Johnson G, Wetzel SG, Litt AW, Zagzag D. Intracranial mass lesions: dynamic contrast-enhanced susceptibility-weighted echo-planar perfusion MR imaging. Radiology 2002;223:11–29 [DOI] [PubMed] [Google Scholar]
- 34.Latchaw RE. The roles of diffusion and perfusion MR imaging in acute stroke management. AJNR Am J Neuroradiol 1999;20:957–959 [PMC free article] [PubMed] [Google Scholar]
- 35.Guo AC, Jewells VL, Provenzale JM. Analysis of normal-appearing white matter in multiple sclerosis: comparison of diffusion tensor MR imaging and magnetization transfer imaging. AJNR Am J Neuroradiol 2001;22:1893–1900 [PMC free article] [PubMed] [Google Scholar]
- 36.Guseo A, Jellinger K. The significance of perivascular infiltrations in multiple sclerosis. J Neurol 1975;211:51–60 [DOI] [PubMed] [Google Scholar]
- 37.Lucchinetti C, Bruck W, Parisi J, Scheithauer B, Rodriguez M, Lassmann H. A quantitative analysis of oligodendrocytes in multiple sclerosis lesions: a study of 113 cases. Brain 1999;122(Pt 12):2279–2295 [DOI] [PubMed] [Google Scholar]
- 38.Filippi M, Cercignani M, Inglese M, Horsfield MA, Comi G. Diffusion tensor magnetic resonance imaging in multiple sclerosis. Neurology 2001;56:304–311 [DOI] [PubMed] [Google Scholar]
- 39.Adams CW, Abdulla YH, Torres EM, Poston RN. Periventricular lesions in multiple sclerosis: their perivenous origin and relationship to granular ependymitis. Neuropathol Appl Neurobiol 1987;13:141–152 [DOI] [PubMed] [Google Scholar]
- 40.Tan IL, van Schijndel RA, Pouwels PJ, et al. MR venography of multiple sclerosis. AJNR Am J Neuroradiol 2000;21:1039–1042 [PMC free article] [PubMed] [Google Scholar]