

Abstract
BACKGROUND AND PURPOSE: Differentiation between tumor recurrence and treatment-related brain injury is often difficult with conventional MRI. We hypothesized that the diffusion-weighted imaging (DWI) could help differentiate these 2 conditions, because water diffusion may be greater for necrotic tissues in the treatment-related brain injury than for tumor tissues in recurrence. Our aim was to analyze whether DWI findings of recurrent tumor are distinct from those of radiation necrosis.
METHODS: Seventeen patients were examined prospectively. Two readers assessed the images by consensus for homogeneity and signal intensity of the lesions. Five regions of interest were drawn within the lesions on trace DWI images and apparent diffusion coefficient (ADC) maps. The minimal, maximal, and mean values of each lesion were compared between the 2 groups. Findings in 12 of 17 patients were verified histologically by surgery or biopsy; the diagnoses in the remaining 5 patients were made on the basis of follow-up MRI findings and clinical follow-up.
RESULTS: There were a total of 20 lesions; 12 lesions were due to radiation necrosis and 8 lesions to tumor recurrence. In the radiation necrosis group, 8 lesions had marked hypointensity. In the recurrence group, however, no marked hypointensity was seen. The maximal ADC values within each lesion were significantly smaller for the recurrence group than for the necrosis group (P = .039).
CONCLUSION: Radiation necrosis usually showed heterogeneity on DWI images and often included spotty, marked hypointensity. Significant difference was found in the maximal ADC values between radiation necrosis and tumor recurrence. DWI was useful in differentiating recurrent neoplasm from radiation necrosis.
During the past decade, the treatment of malignant brain tumors has benefited from several advances, including early detection of tumors by using MRI, improvements in neurosurgical instrumentation that have facilitated more precise resection of neoplasms, advances in the delivery of radiation doses to tumors, and new chemotherapeutic protocols. However, MRI images obtained in these patients have shown several radiation- and chemotherapy-induced changes in the brain. Radiation necrosis is the most substantial and most severe form of radiation-induced injury with therapeutic implications. The diagnosis of radiation necrosis on imaging has been challenging, primarily because the pattern of abnormal enhancement closely mimics that of recurrent brain tumor. Diffusion-weighted imaging (DWI) is based on the detection of a change in the random motion of protons in water, and it enables the characterization of tissues and their pathological processes at a microscopic level. It has become a routine MRI technique and has been widely used to diagnose cerebral ischemia; however, the role of DWI in other disease entities is relatively limited. Several studies have used DWI in the assessment of tumor cellularity (1–7); however, few DWI studies have reported on radiation necrosis (8, 9). We hypothesized that DWI could differentiate these 2 conditions, because water diffusion may be greater for necrotic tissues in treatment-related brain injury than for tumor tissues in recurrence. The purpose of this study was to evaluate the DWI findings of radiation-induced brain injury and to analyze whether DWI can differentiate recurrent tumor from radiation necrosis.
Methods
Patient Population
Seventeen patients (13 men and 4 women; mean age, 47.7 y; age range, 23–62 y) were prospectively entered into the study over a 24-month period on the basis of the following criteria: previous treatment with conventional external-beam radiation and systemic chemotherapy after surgical resection for intraaxial tumors; new development of small, enhancing lesions within the radiation field 6–120 months after radiation therapy (10, 11); and MRI findings consistent with those of tumor recurrence (enhancing areas surrounded by T2 hyperintense areas). All patients underwent follow-up MRI examinations in intervals of ≤2 months once the newly developed, small, enhancing lesions were observed. None of the patients received any therapy during the follow-up period. Initial diagnoses in all patients were proven by examinations of histologic specimens. Fifteen patients had astrocytic tumors with pathologic grades of II (n = 1), III (n = 9), or IV (n = 5). In the remaining 2 patients, lesions consisted of 1 lymphoma and 1 pineal tumor.
The final determination between tumor recurrence and radiation-induced brain injury was decided either histopathologically or by clinical follow-up. Five cases of tumor recurrence and 7 of radiation necrosis were histologically verified either by surgical resection or stereotactic biopsy. In the remaining 5 patients who did not undergo surgical intervention, the lesions were considered to be nonneoplastic contrast-enhancing tissue when the enhancing lesions disappeared or decreased in size on subsequent MRI images or were present but unchanged on serial follow-up MRI images for at least 9 months, accompanied by neurologic improvement during the follow-up period. When the enhancing lesions increased progressively in size on at least 3 serial MRI images over ≥5 months and the patient’s clinical condition deteriorated progressively during the period, the lesions were interpreted as tumor recurrence.
Imaging Procedures
All MR images were obtained with a 1.5-T superconducting system (Magnetom Vision; Siemens Medical Systems, Erlangen, Germany) using a circularly polarized head coil. Sagittal T1-weighted (T1WI) localizing images (TR/TE/NEX, 15/6/1) were acquired first, and then unenhanced axial T1WI and T2-weighted (T2WI) images were obtained in each patient. DWI images and conventional MRI images were obtained in all patients. All conventional sequences were obtained with a 5-mm section thickness and a 1-mm intersection gap. DWI was performed in the transverse plane by using a spin-echo echo-planar imaging sequence with the following parameters: TR/TE/TI, 12000/100/2200; diffusion gradient encoding in 3 orthogonal directions; b = 1000 s/mm2; FOV, 220 mm; matrix, 128 × 64 pixels; section thickness, 5 mm; section gap, 0.2 mm; and NSA, 1. Then T1WI sequences were performed after administration of 0.1 mmol/kg body weight of gadopentetate dimeglumine.
Apparent diffusion coefficient (ADC) values were calculated on the basis of the following equation:
 |
1) |
where G is the amplitude of the pulsed diffusion gradient, γ is the gyromagnetic ratio, Δ is the interval between the diffusion gradients, δ is the duration of diffusion gradients, S(G) is the signal strength with pulsed diffusion gradient on, S(0) is the signal strength with the pulsed diffusion gradient off.
Image Evaluation
Two blinded readers (C.A., Y.K.) performed qualitative visual inspection of DWI images and ADC maps of tumor recurrence and radiation necrosis with a consensus reading for homogeneity and signal intensity (SI) of the lesions. SI patterns were divided into 3 groups: hyperintense, hypointense, or heterogeneous. The presence of marked hyperintensity and marked hypointensity was also assessed. Five uniform regions of interest (ROI) were manually drawn on DWI images and ADC maps in areas corresponding to the enhancing portion of lesions to obtain the SI of DWI and ADC values of the lesion. Five ROI were placed within the enhancing lesion to avoid volume averaging with cystic regions that influence ADC values. In a heterogeneous lesion, we placed 5 ROI to represent the signal heterogeneity of the lesion; ROI corresponding to the hyperintense portion of the lesions and also corresponding to the hypointense portion were included. For example, at least 1 ROI was separately placed on each hyperintense or hypointense area for the heterogeneous lesion. When a lesion included marked hypointensity, at least 1 ROI was placed on the markedly hypointense area. Methods for drawing the ROI were the same for both sets of lesions.
Data Analysis
Quantitatively, the SI of DWI images and ADC maps of the lesions were compared between the groups of tumor recurrence and radiation necrosis. The minimal, maximal, and mean values of each lesion were compared between the 2 groups and statistically analyzed by using an unpaired t test.
Results
There were a total of 20 lesions. Twelve lesions of 10 patients were a result of radiation necrosis, and 8 lesions of 7 patients arose from tumor recurrence.
Visual Inspection
In the radiation necrosis group, 11 lesions were of mixed SI (Fig 1) and 1 was predominantly hypointense on DWI images; 8 lesions had marked hypointensity (Table). In the tumor recurrence group, 2 lesions had mixed SI and 6 were predominantly hyperintense on DWI images (Fig 2); there was no marked hypointensity (Table).
Fig 1.
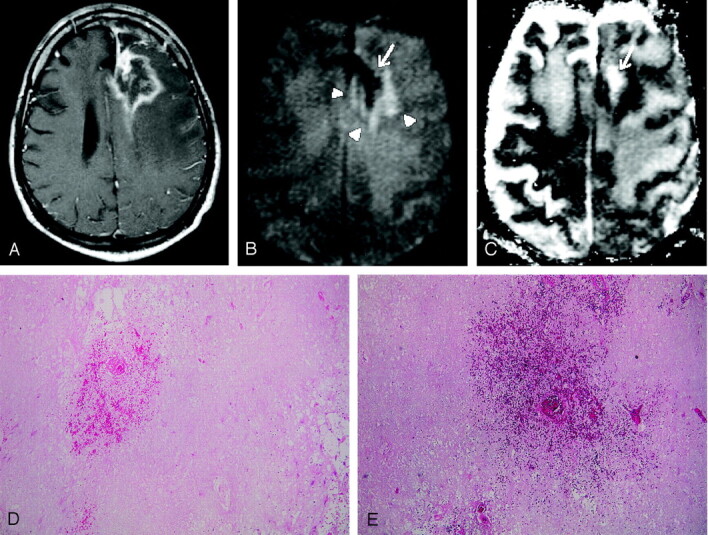
Images obtained in a 54-year-old man with biopsy-proven radiation necrosis after receiving radiation and chemotherapy for anaplastic oligodendroglioma.
A, Gadolinium-enhanced T1WI image shows an irregular ring-enhancing lesion with mass effect.
B, DWI image obtained at the same level as A shows a mixed SI pattern (arrowheads), with marked hypointensity (arrow), which is typical for radiation necrosis. Radiation necrosis may have a variety of SI patterns on DWI images, reflecting the development of necrosis. Marked DWI hypointensity is probably attributable to liquefactions in late-stage necrosis.
C, ADC map, which corresponds to B, shows a mixed SI pattern, with a markedly high ADC value (arrow).
D and E, Histopathological specimens (hematoxylin-eosin, ×20 [D], ×40 [E]) show total parenchymal necrosis with hemorrhage. No evidence of viable tumor cells was found.
Results of visual assessment of DWO findings
| Signal Intensity Pattern | Radiation Necrosis (N = 12) | Recurrence (N = 8) |
|---|---|---|
| Predominantly hypointense | 1 | 0 |
| Heterogeneous | 11 | 2 |
| Predominantly hyperintense | 0 | 6 |
| Markedly hypointense | 8 | 0 |
Fig 2.
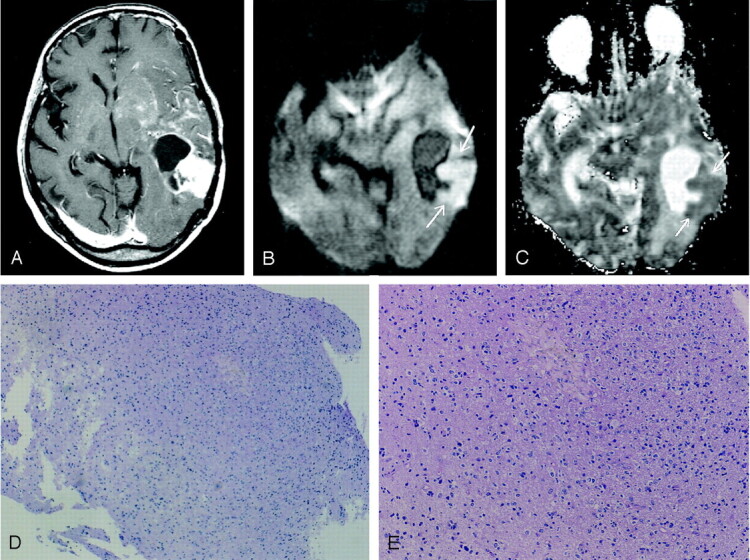
Images obtained in a 53-year-old woman with biopsy-proven tumor after receiving radiation and chemotherapy for anaplastic astrocytoma.
A, Gadolinium-enhanced T1WI image shows a ring-enhancing lesion with a solid enhancing component in the left temporal lobe. Multiple patchy enhancements with mass effect are also seen in the left basal ganglia and insula, suggestive of tumor infiltration.
B, DWI image obtained at the same level as that of A shows the solid enhancing component of predominant hyperintensity (arrows), which usually represents densely packed tumor cells.
C, ADC map, which shows the relatively low apparent diffusion coefficient value of the lesion (arrows).
D and E, Histopathological specimens (hematoxylin-eosin, ×20 [D], ×80 [E]) show tumor tissues with increased cellular density corresponding to anaplastic astrocytoma. No evidence of necrotic tissue was found.
On ADC maps, 11 lesions were of mixed SI and 1 was predominantly hyperintense; 8 lesions had marked hyperintensity. In the tumor recurrence group, 2 lesions were of mixed SI, and 6 were predominantly hypointense on ADC maps; there was no marked hyperintensity.
Quantitative Evaluation
On DWI images obtained in the radiation necrosis group, the minimal SI was 0.78 ± 0.54, the maximal SI was 2.02 ± 0.82, and the mean SI was 1.39 ± 0.44. In the recurrence group, the minimal SI was 1.41 ± 0.35, the maximal SI was 2.03 ± 0.64, and the mean SI was 1.73 ± 0.43. Only the minimal SI was significantly lower for radiation necrosis than for recurrence (P < .05). In the radiation necrosis group, the minimal ADC was 1.04 ± 0.31, the maximal ADC was 2.30 ± 0.73, and the mean ADC was 1.68 ± 0.46. In the recurrence group, the minimal ADC was 1.07 ± 0.18, the maximal ADC was 1.68 ± 0.37, and the mean ADC was 1.37 ± 0.25. Although the maximal and mean ADC values within each lesion were smaller for the recurrence group than for necrosis group, the difference between the 2 groups was only significant for the maximal ADC values (P <.05) (Fig 3).
Fig 3.

A comparison of each ADC value between radiation necrosis and recurrence. The maximal and mean ADC values of each lesion were lower for the recurrence group than for the necrosis group; however, the difference between the 2 groups was significant only for the maximal ADC values.
Discussion
Delayed radiation necrosis consists of confluent zones of parenchymal necrosis that most severely affect the white matter and the deep laminae of the overlying cortex with relative sparing of the superficial cortex (12). During the early phase of radiation necrosis, a highly characteristic fibrinoid necrosis of blood vessel walls is followed by necrosis of the surrounding parenchyma (12). Late vascular changes include wall thickening, hyalinization, and telangiectasia. Extensive reactive gliosis is commonly observed adjacent to the necrotic foci (12). Secondary changes in necrotic tissue, including cyst formation and dystrophic calcification, may occur. Delayed radiation necrosis is directly proportional to dose and inversely related to fractional number (10, 11). The mean interval between irradiation and presentation is approximately 1 y for patients who receive a total dose of >50 Gy; however, cases of radiation necrosis have been reported as early as 3 mo and as late as 19 y after radiation therapy (11).
The typical MRI findings of radiation necrosis are areas of cystic or fingerlike lesions of increased SI in white matter on T2WI images, which frequently extend beyond the radiation portals. Nodular or rim enhancement may be seen (13–15), because diffuse damage to the blood-brain barrier is present, although the degree of enhancement can vary with time. Larger lesions may appear as islands of enhancement surrounded by areas nonenhancing necrosis. Minimal local mass effect for the size of the lesion is typical. However, reactive vasogenic edema, which often accompanies this condition, can be extensive and can produce substantial regional mass effect on adjacent structures. These findings are often nonspecific and may not permit differentiation from tumor recurrence.
Our results revealed that all minimal, maximal, and mean ADC values within each lesion were smaller for the recurrence group than for the necrosis group. These findings may be consistent with the previous DWI studies of brain tumor; densely packed tumor cells can inhibit effective motion of water molecules and can restrict diffusion (16). Low-grade tumors tend to have higher ADC values than those of high-grade tumors, which may reflect the increase of water content within the neoplastic cells or interstitial spaces (17). Investigators noted that tumor cellularity was inversely correlated with ADC values of tumor (2).
In tumors, the ADC is highest in areas of cystic necrosis, followed by vasogenic peritumoral edema, nonenhancing solid tumor, and enhancing solid-tumor components (1). Krabbe et al 18) reported that the mean ADC of the necrotic component was 1.65 (× 10−3 mm2/s) for 12 malignant gliomas and 2.62 for 7 metastases, compared with a mean ADC of 3.1 for CSF. Our quantitative measurements of ADC values in radiation necrosis were in good agreement with measurements of the necrotic component within the malignant tumor, although the minimal ADC values were lower than those of the previous data. We speculate that lower SI areas on DWI images observed in the radiation necrosis group are probably liquefactions without polymorphonuclear leukocytes in the late-stage necrosis; the increased diffusion could be a consequence of an increase in water in the interstitial space following cell necrosis.
Histopathological analysis of radiation necrosis frequently contained blood products, as shown in Figure 1, and the presence of blood products can alter the SI of a lesion on DWI images. Hemosiderin deposition might cause a decrease in SI on DWI images because of the T2* effect or so-called T2 dark-through (12, 14).
In our study, most lesions of radiation necrosis showed heterogeneous SI on DWI images. Not only hypointensities but also hyperintensities were observed within the lesions of radiation necrosis on DWI images. Many factors may influence water diffusion in living tissue, including restriction (cellular compartmentalization, cell type and number, cell membrane density, and macromolecular size and type), physicochemical properties of tissue (viscosity and temperature), and perfusion (19). We postulate that radiation necrosis may have a variety of SI on DWI images, reflecting the development in necrosis. To our knowledge, the present study is the first in which the heterogeneous SI on DWI images in patients with radiation necrosis was found.
A case of radiation necrosis with markedly increased SI on DWI images and a low ADC was reported in a retrospective study (20). Another investigator (17) also reported that low ADC values have been found in radiation necrosis, although there was not such a finding in our study. In a case report of a metastasis with a low ADC value, the authors suggested that this low apparent diffusion coefficient could be explained by the development of intracellular edema in the viable tumor cells during the transition to complete necrosis with liquefaction (21). The low ADC values in radiation necrosis might reflect the early necrosis with abundant polymorphonuclear leukocytes, as in purulent fluid; it is speculated that areas of necrosis with abundant polymorphonuclear leukocytes may decrease the apparent diffusion coefficient, because high viscosity and inflammatory cellular composition may restrict water diffusion (22). It is well known that pyogenic brain abscess shows markedly decreased ADC values (18, 22–26).
Several metabolic imaging techniques have been evaluated to help distinguish radiation necrosis from a recurrent neoplasm. Using MR spectroscopy, Fulham et al (27) found decreased levels of choline-containing compounds in areas affected by chronic radiation necrosis as compared with tumors. Positron emission tomography with 18F-fluoro-2-deoxyglocose will likely play a larger role in differentiating neoplasm from radiation necrosis on the basis of measurements of glucose metabolism (28, 29). Even with these metabolic images, however, it is not easy to differentiate recurrent neoplasm from radiation necrosis.
Conclusion
Radiation necrosis usually showed heterogeneity on DWI images and often included spotty, marked hypointensity. There was significant difference in the maximal ADC values between radiation necrosis and tumor recurrence. DWI was useful in differentiating recurrent neoplasm from radiation necrosis.
References
- 1.Tien RD, Felsberg GJ, Friedman H, Brown M, MacFall J. MR imaging of high-grade cerebral gliomas: value of diffusion-weighted echoplanar pulse sequences. AJR Am J Roentgenol 1994;162:671–677 [DOI] [PubMed] [Google Scholar]
- 2.Sugahara T, Korogi Y, Kochi M, et al. Usefulness of diffusion-weighted MRI with echo-planar technique in the evaluation of cellularity in gliomas. J Magn Reson Imaging 1999;9:53–60 [DOI] [PubMed] [Google Scholar]
- 3.Gupta RK, Sinha U, Cloughesy TF, Alger JR. Inverse correlation between choline magnetic resonance imaging spectroscopy signal intensity and the apparent diffusion coefficient in human gliomas. Magn Reson Med 1999;41:2–7 [DOI] [PubMed] [Google Scholar]
- 4.Kotsenas AL, Roth TC, Manness WK, Faerber EN. Abnormal diffusion-weighted MRI in medulloblastoma: does it reflect small cell histology? Pediatr Radiol 1999;29:524–526 [DOI] [PubMed] [Google Scholar]
- 5.Chevenrt TL, Stegman LD, Taylor JM, et al. Diffusion magnetic resonance imaging: an early surrogate marker of therapeutic efficacy in brain tumors. J Natl Cancer Inst 2000;92:2029–2036 [DOI] [PubMed] [Google Scholar]
- 6.Castillo M, Smith JK, Kwock L, Wilber K. Apparent diffusion coefficients in the evaluation of high-grade gliomas. AJNR Am J Neuroradiol 2001;22:60–64 [PMC free article] [PubMed] [Google Scholar]
- 7.Guo AC, Cummings TJ, Dash RC, Provenzale JM. Lymphomas and high-grade astrocytomas: comparison of water diffusibility and histologic characteristics. Radiology 2002;224:177–183 [DOI] [PubMed] [Google Scholar]
- 8.Tsui EYK, Chan JHM, Ramsey RG, et al. Late temporal lobe necrosis in patients with nasopharyngeal carcinoma: evaluation with combined multi-section diffusion weighted and perfusion weighted MR imaging. Eur J Radiol 2001;39:133–138 [DOI] [PubMed] [Google Scholar]
- 9.Hein PA, Eskey CJ, Dunn JF, Hug EB. Diffusion-weighted Imaging in the follow-up of treated high-grade gliomas: tumor recurrence versus radiation injury AJNR Am J Neuroradiol 2004;25:201–209 [PMC free article] [PubMed] [Google Scholar]
- 10.Glass JP, Hwang T-L, Leavens ME, Libshitz, HL. Cerebral radiation necrosis following treatment of extracranial malignancies. Cancer 1984;54:1966–1972 [DOI] [PubMed] [Google Scholar]
- 11.Marks JE, Wong J. The risk of cerebral radionecrosis in relation to dose, time and fractionation: a follow-up study. Prog Exp Tumor Res 1985;29:210–218 [DOI] [PubMed] [Google Scholar]
- 12.Burger PC, Boyko OB. The pathology of central nervous system radiation injury. In: Gutin PH, Leibel SA, Sheline GE, eds. Radiation Injury to the Central Nervous System. New York, NY: Raven;1991. :191–208
- 13.Lee AW, Cheung LO, Ng SH, et al. Magnetic resonance imaging in the clinical diagnosis of late temporal lobe necrosis following radiotherapy for nasopharyngeal carcinoma. Clin Radiol 1990;12:256–270 [DOI] [PubMed] [Google Scholar]
- 14.Chan YL, Leung SF, King AD, Choi PH, Metreweli C. Late radiation injury to the temporal lobes: morphologic evaluation at MR imaging. Radiology 1999;213:800–807 [DOI] [PubMed] [Google Scholar]
- 15.Kumar AJ, Leeds NE, Fuller GN, et al. Malignant gliomas: MR imaging spectrum of radiation therapy- and chemotherapy-induced necrosis of the brain after treatment. Radiology 2000;217:377–384 [DOI] [PubMed] [Google Scholar]
- 16.Le Bihan D, Breton E, Lallemand D, Grenier P, Cabanis E, Laval-Jeantet M. MR Imaging of intravoxel incoherent motions: application to diffusion and perfusion in neurologic disorders. Radiology 1986;161:401–407 [DOI] [PubMed] [Google Scholar]
- 17.Le Bihan D, Douek P, Argyropoulou M. Diffusion and perfusion magnetic resonance imaging in brain tumors. Top Magn Reson Imaging 1993;5:25–31 [PubMed] [Google Scholar]
- 18.Krabbe K, Gideon P, Wagn P, Hansen U, Thomsen C, Madsen F. MR diffusion imaging of human intracranial tumors. Neuroradiology 1997;39:483–489 [DOI] [PubMed] [Google Scholar]
- 19.Schaefer PW, Grant E, Gonzalez RG. Diffusion-weighted MR imaging of the brain. Radiology 2000;217:331–345 [DOI] [PubMed] [Google Scholar]
- 20.Tung GA, Evangelista P, Rogg JM, Duncan JA III. Diffusion-weighted MR Imaging of rim-enhancing brain masses: is markedly decreased water diffusion specific for brain abscess? AJR Am J Roentgenol 2001;177:709–712 [DOI] [PubMed] [Google Scholar]
- 21.Holtas S, Geijer B, Stromblad LG, Mary-Sundgren P, Burtscher IM. A ring-enhancing metastasis with central high signal on diffusion-weighted Imaging and low apparent diffusion coefficients. Neuroradiology 2000;42:824–827 [DOI] [PubMed] [Google Scholar]
- 22.Ebisu T, Tanaka C, Umeda M, et al. Discrimination of brain abscess from necrotic or cystic tumors by echo planar imaging. Magn Reson Imaging 1996;14:1113–1116 [DOI] [PubMed] [Google Scholar]
- 23.Desprechins B, Stadnik T, Koerts G, Shabana W, Breucq C, Osteaux M. Use of diffusion-weighted MR imaging in differential diagnosis between intracranial necrotic tumors and cerebral abscess. AJNR Am J Neuroradiol 1999;201:1252–1257 [PMC free article] [PubMed] [Google Scholar]
- 24.Noguchi K, Watanabe N, Nagayoshi T, et al. Role of diffusion-weighted echo-planar MRI in distinguishing between brain abscess and tumor: a preliminary report. Neuroradiology 1999;21:171–174 [DOI] [PubMed] [Google Scholar]
- 25.Ketelslegers E, Duprez T, Ghariani S, Thauvoy C, Cosnard G. Time dependence of serial diffusion-weighted imaging features in a case of pyogenic brain abscess. J Comput Assist Tomogr 2000;24:478–481 [DOI] [PubMed] [Google Scholar]
- 26.Kim YJ, Chang K-H, Song IC, et al. Brain abscess and necrotic or cystic brain tumor: discrimination with signal intensity on diffusion-weighted MR Imaging. AJR Am J Roentgenol 1998;171:1487–1490 [DOI] [PubMed] [Google Scholar]
- 27.Fulham MJ, Bizzi A, Dietz MJ, et al. Mapping of brain tumor metabolites with proton MR spectroscopic imaging: clinical relevance. Radiology 1992;185:675–686 [DOI] [PubMed] [Google Scholar]
- 28.Langleben DD, Segall GM. PET in differentiation of recurrent brain tumor from radiation injury. J Nucl Med 2000;41:1861–1867 [PubMed] [Google Scholar]
- 29.Chao ST, Suh JH, Raja S, Lee SY, Barnett G. The sensitivity and specificity of FDG PET in distinguishing recurrent brain tumor from radionecrosis in patients treated with stereotactic radiosurgery. Int J Cancer 2001;96:191–197 [DOI] [PubMed] [Google Scholar]