Abstract
Background
The purpose of this study was to investigate the feasibility of MOSFET dosimeter in measuring eye dose during 2D MV portal imaging for setup verification in radiotherapy.
Materials and methods
The in-vivo dose measurements were performed by placing the dosimeters over the eyes of 30 brain patients during the acquisition of portal images in linear accelerator by delivering 1 MU with the field sizes of 10 × 10 cm2 and 15 × 15 cm2.
Results
The mean doses received by the left and right eyes of 10 out of 30 patients when both eyes were completely inside the anterior portal field were found to be 2.56 ± 0.2 cGy and 2.75 ± 0.2, respectively. Similarly, for next 10 patients out of the same 30 patients the mean doses to left and right eyes when both eyes were completely out of the anterior portal fields were found to be 0.13 ± 0.02 cGy and 0.17 ± 0.02 cGy, respectively. The mean doses to ipsilateral and contralateral eye for the last 10 patients when one eye was inside the anterior portal field were found to be 3.28 ± 0.2 cGy and 0.36 ± 0.1 cGy, respectively.
Conclusion
The promising results obtained during 2D MV portal imaging using MOSFET have shown that this dosimeter is well suitable for assessing low doses during imaging thereby enabling to optimize the imaging procedure using the dosimetric data obtained. In addition, the documentation of the dose received by the patient during imaging procedure is possible with the help of an in-built software in conjunction with the MOSFET reader module.
Keywords: MV portal imaging, setup verification, in vivo dosimetry, MOSFET
Introduction
Innovations in radiotherapy have led to precise treatment in radiotherapy that requires image guidance for accurate localization of tumor and setup verification to provide standard care of practice. Image-guided radiotherapy (IGRT) makes use of different imaging modalities such as fluoroscopy, megavoltage/kilovoltage cone-beam computed tomography (MV-CBCT/kV-CBCT) for simple setup image verification or a complex intra-fraction tumor tracking [1–4]. The patient setup verification, pre-treatment verification and dose measurement during treatment have become main areas of research leading to the advancement of treatment techniques and equipment to deliver the dose accurately and precisely [5–7]. Electronic portal imaging device (EPID) has been recognized as a standard tool for online patient setup verification. In general, the radiation dose due to imaging is ignored due to its low magnitude when compared to the therapeutic dose used to treat patients. Though the portal dose due to imaging is small, repeated use of imaging could deliver a dose that may perhaps increase the probability of a stochastic effect [8, 9]. Hence, it is important to assess the dose due to imaging procedure as the image guidance systems are integrated in the treatment unit and the possibility of imaging for setup verification.
In-vivo dosimetry in radiotherapy plays a vital role in assessing dose delivery and detecting major errors during treatment [10–12]. In-vivo dosimetry procedures are very helpful in ensuring a high accuracy in dose delivery to cancer patients treated with high precision techniques [13–15]. Also, it is useful to record the actual dose received by the patients and to fulfill legal requirements. However, the complexity of modern radiotherapy techniques, such as IMRT and SRS, requires dose delivery evaluation to ensure the effectiveness of radiotherapy treatments. Ionization chambers, Thermoluminescence dosimeters (TLDs), diodes and metal oxide semiconductor field effect transistors (MOSFETs) are typical commonly used dosimeters. Ionization chambers, which are considered to be the gold standard and backbone for dosimetric measurements, are not preferred for in-vivo dosimetry due to its stability, accuracy, and practicality. TLD is the most predominant dosimeter for in-vivo dosimetry but has a drawback in re-estimation of absorbed dose due to a destructive readout technique. Diodes will provide real-time readout, but it requires corrective action for its dependency on the number of parameters, which limits its utility.
A suitable dosimeter has to be chosen, depending on the measurement situation appropriate to the intended use [9]. MOSFET dosimeter has several advantages, such as small detector size that allows pinpoint measurements, lightweight that does not cause any harm to the patient, minimal power requirement, ease of use, and online readout. Hence, a study was carried out to measure the dose delivered to the eyes during 2D MV portal imaging for setup verification with MOSFET dosimeters for patients undergoing 3D Conformal Radiotherapy treatments for brain tumors.
Materials and methods
Equipment used
The Primus linear accelerator (Siemens, Germany) has been used in this study which is capable of delivering 6 and 15 MV photon beams and five electron beams (06, 09, 12, 15, 18 and 21 MeV). In this treatment unit, the lower jaw is replaced by a Multileaf collimator (MLC) that consists of 27 pairs of central leaves with 1 cm projected width at isocenter and the 2 outermost pairs of leaves with 6.5 cm projected width at isocenter. This linear accelerator is equipped with a megavoltage amorphous silicon (aSi) electronic portal imaging device (EPID). In this, 6 MV photon beam was used for portal imaging throughout the study.
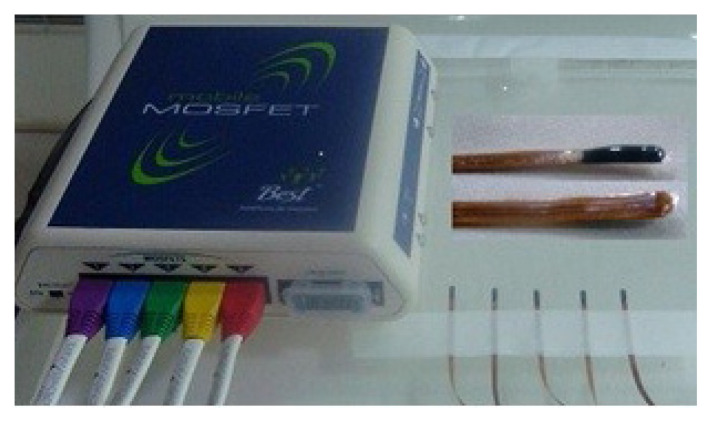
The mobile MOSFET dosimeter procured from Best Medicals, Canada, with a silicon chip of dimension 1 mm × 1 mm with an active area of 0.2 mm × 0.2 mm, located under a black epoxy bulb is used in this study and shown in Figure 1. It consists of remote monitoring dose verification software, wall-mounted Bluetooth wireless transceiver, and a small reader module. The reader module with the standard bias setting was used throughout the study as it has the sensitivity of 1 mV/cGy. The wireless transceiver helps in collecting the signals from the MOSFET reader module and transfers the signals to the computer with the help of remote dose verification software. An additional brass buildup cap (TN-RD-56-0.63, Best Medicals, Canada) of density 8.5 g/cm3 with a groove at the center for secure placement of MOSFET dosimeters (Fig. 2) was used during dose measurements along with an inherent buildup of 0.8 mm.
Figure 1.
MOSFET dosimeter and reader module
Figure 2.
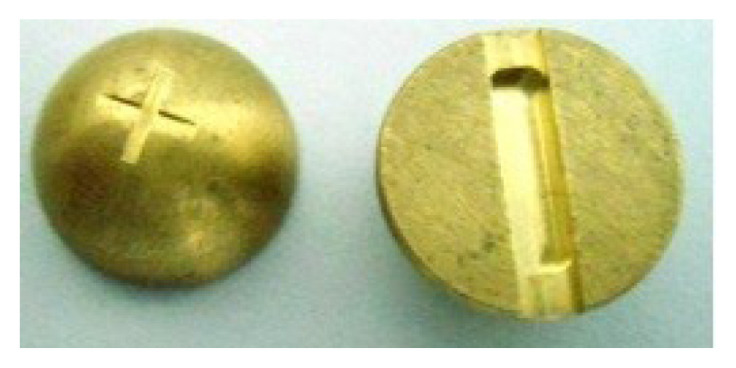
Brass buildup cap (front and back view)
RW3 slabs (PTW, Germany) of dimension 30 × 30 cm2 with different thicknesses ranging from 1 mm to 10mm were used for the calibration of MOSFET to measure low doses during imaging. Anthropomorphic Rando phantom (The Phantom laboratory, USA) was used to measure eye dose as a prelude to clinical measurements.
Calibration of mobile MOSFET dosimeter
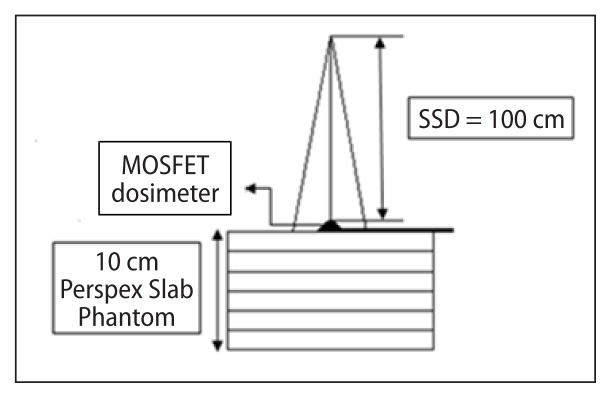
The mobile MOSFET dosimeters were calibrated to measure low dose during MV imaging with 6 MV photon beams. The MOSFET dosimeters with brass buildup caps were placed on the surface of an RW3 slab phantom of 10 cm thickness as backscatter (Fig. 3). The dosimeters were irradiated to low doses ranging from 1 to 10 cGy in steps of 1 cGy for a field size of 10 × 10 cm2. Each measurement was repeated three times and the average value was used in the study. A calibration curve was plotted with MOSFET response (mV) against the function of dose (cGy). The calibration factor in terms of cGy/mV was obtained by taking the ratio of the MOSFET response in mV to the dose (cGy) at the depth of dose maximum (Dmax). The IAEA TRS 398 protocol was used to measure the absolute dose at Dmax with a 0.6 cc Farmer type ionization chamber (Capintec, USA) and Capintec electrometer (Model 192, Capintec, USA)
Figure 3.
Setup to determine calibration factor using MOSFET dosimeter
Standardization of the dosimetry using MOSFET during 2D portal imaging
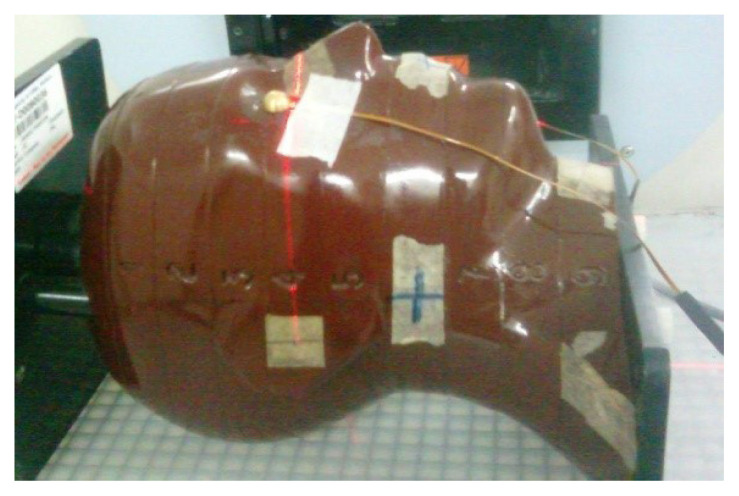
Dose measurements were carried out with standard sensitivity MOSFET dosimeters by placing these detectors on the surface of the eyes in anthropomorphic phantom during 2D MV portal imaging. Figure 4 shows the placement of MOSFET dosimeters on the surface of the eye with a buildup cap. The MV portal imaging consists of two orthogonal setup fields (anterior–posterior and lateral) and the double exposure technique was used to acquire portal images using an electronic portal imaging device (EPID) on the Primus linear accelerator with 6 MV photon beams. The field sizes used for the double exposure technique were 10 × 10 cm2 and 15 × 15 cm2, respectively. One monitor unit (MU) was delivered for each of the fields.
Figure 4.
Position of standard sensitivity MOSFET dosimeter with buildup cap on the eye level in Rando phantom
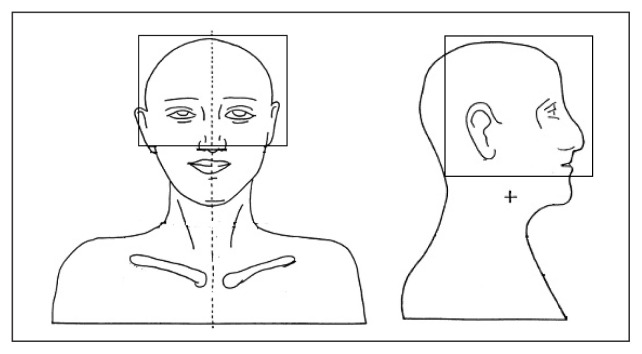
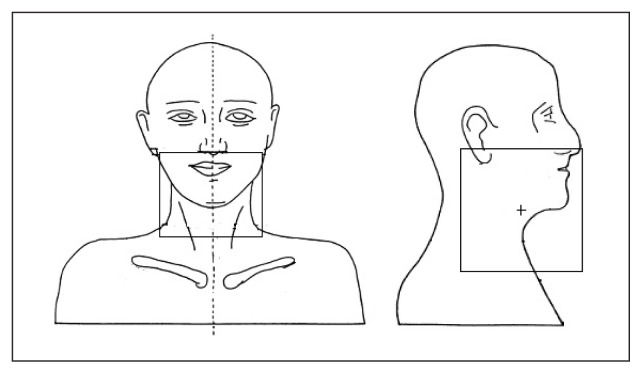
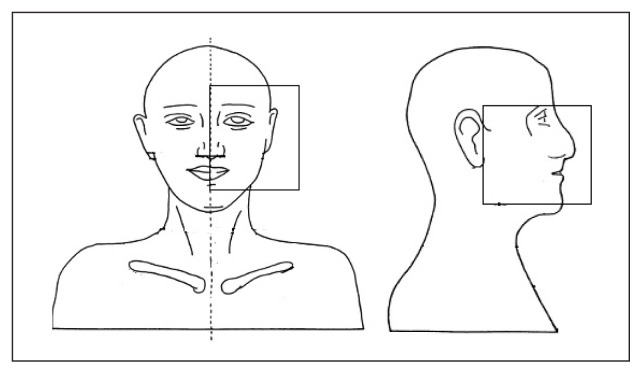
Eye doses were measured for three different ways. The portal fields were generated in such a way that the eyes were within the portal fields in the first set up, both eyes were completely outside the portal field during the second set up and, finally, only one eye was within the portal field in the third set up. Dose measurements in the phantom were carried out for the aforementioned set up three times. Figures 5–7 show the three different field set-ups and the placement of the MOSFET dosimeter during imaging.
Figure 5.
Both eyes inside the portal field during imaging
Figure 6.
Both eyes away from the portal field during imaging
Figure 7.
One eye inside the portal field during imaging
In-vivo dose measurements during 2D imaging
Thirty brain tumor patients undergoing 3DCRT were randomly selected for eye dose measurements during 2D MV portal imaging. In-vivo dose measurements were carried out for ten patients for each field configuration that has been mentioned above. Each measurement was repeated for 3 days for each patient.
Results
Calibration of standard sensitivity MOSFET dosimeter
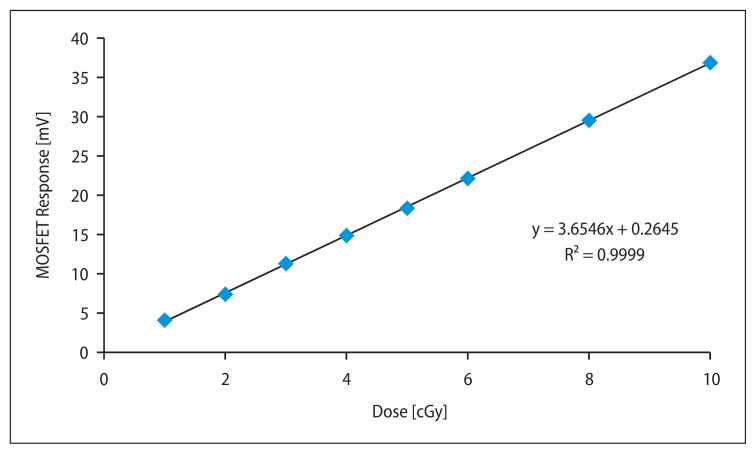
Figure 8 depicts the low dose calibration curve for 6 MV photon beam imaging using a standard sensitivity MOSFET dosimeter which is used to measure surface dose with a brass build-up cap. From the graph, it was evident that the response of the standard sensitivity MOSFET dosimeters was linear for low doses ranging from 1 to 10 cGy. The average calibration factor for the MOSFET dosimeters with a build-up cap to use it as in-vivo dosimeter was found to be 1.0 cGy/mV for 6 MV X-rays.
Figure 8.
Calibration curve for standard sensitivity MOSFET dosimeter for 6 MV photon beam
Dose measurements in phantom during MV portal imaging
Table 1 represents the average dose to eye measured with standard sensitivity MOSFET dosimeters in an anthropomorphic phantom during 2D MV portal imaging for three different field configurations. The maximum dose to eye observed was 1.92 ± 0.05 cGy in the anterior portal and 2.01 ± 0.09 cGy in the lateral portal when both eyes were inside the portal field during imaging whereas the maximum dose to the eye was 0.19 ± 0.01 cGy in the anterior portal and 0.63 ± 0.01 cGy in the lateral portal when both eyes were completely outside the portal fields. The maximum dose to the ipsilateral eye was found to be 2.08 ± 0.03 cGy in the anterior portal and 2.13 ± 0.05 cGy in the lateral portal, whereas the maximum dose to the contralateral eye was found to be 0.21 ± 0.02 cGy in the anterior portal and 1.65 ± 0.01 cGy in the lateral portal when only one eye was inside the portal field during imaging.
Table 1.
Eye doses measured at three different positions in phantom
| Portal fields | Both eyes inside the portal fields | Both eyes outside the portal fields | Singe eye inside the portal fields | |||
|---|---|---|---|---|---|---|
| Left Eye (cGy ± SD) | Right Eye (cGy ± SD) | Left Eye (cGy ± SD) | Right Eye (cGy ± SD) | Ipsilateral eye (cGy ± SD) | Contra-lateral eye (cGy ± SD) | |
| Anterior | 1.92 ± 0.05 | 1.76 ± 0.04 | 0.19 ± 0.01 | 0.18 ± 0.01 | 2.08 ± 0.03 | 0.21 ± 0.02 |
| Lateral | 2.01 ± 0.09 | 1.8 ± 0.02 | 0.63 ± 0.01 | 0.57 ± 0.01 | 2.13 ± 0.05 | 1.65 ± 0.07 |
In-vivo dose measurements in patients during MV portal imaging
In-vivo dose measurements were carried out to find the eye dose for ten patients with a MOSFET dosimeter during portal imaging for setup verification. For each patient in-vivo dose measurements were carried out for 3 consecutive days. When the eyes were within the portal field, the average doses measured for the right and left eyes of ten patients were found to be 2.75 ± 0.2 cGy and 2.56 ± 0.2 cGy for the anterior portal field, whereas for the lateral portal field the right and left eyes were found to be 0.31 ± 0.1 cGy and 0.36 ± 0.1 cGy. Table 2 represents the average dose to the right and left eye for ten patients when both eyes were within the portal field.
Table 2.
Dose measured when both eyes were inside portal fields during imaging
| Patient number | Right eye | Left eye | ||
|---|---|---|---|---|
| Anterior portal | Lateral portal | Anterior portal | Lateral portal | |
| 1 | 2.71 ± 0.02 | 0.21 ± 0.05 | 2.67 ± 0.05 | 0.25 ± 0.05 |
| 2 | 2.76 ± 0.12 | 0.09 ± 0.16 | 2.43 ± 0.26 | 0.04 ± 0.06 |
| 3 | 2.63 ± 0.21 | 0.11 ± 0.18 | 2.59 ± 0.05 | 0.22 ± 0.19 |
| 4 | 2.40 ± 0.06 | 0.80 ± 0.06 | 2.31 ± 0.12 | 0.68 ± 0.13 |
| 5 | 2.54 ± 0.14 | 0.32 ± 0.15 | 2.67 ± 0.13 | 0.66 ± 0.15 |
| 6 | 2.64 ± 0.25 | 0.24 ± 0.14 | 2.61 ± 0.08 | 0.18 ± 0.11 |
| 7 | 3.06 ± 0.31 | 0.08 ± 0.05 | 2.65 ± 0.31 | 0.14 ± 0.11 |
| 8 | 2.95 ± 0.15 | 0.12 ± 0.10 | 2.45 ± 0.11 | 0.15 ± 0.04 |
| 9 | 2.94 ± 0.17 | 0.66 ± 0.11 | 2.43 ± 0.21 | 0.64 ± 0.07 |
| 10 | 2.90 ± 0.28 | 0.40 ± 0.17 | 2.83 ± 0.20 | 0.63 ± 0.06 |
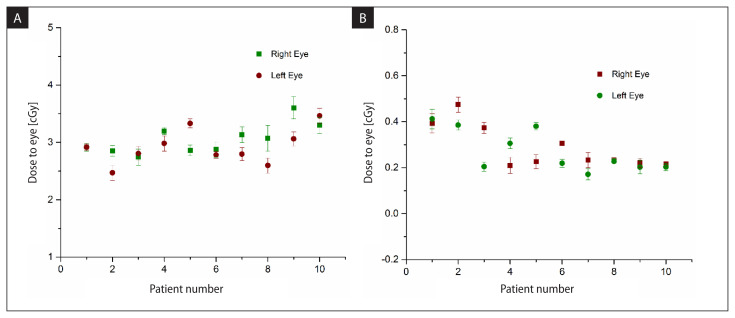
When both eyes were completely outside the portal fields, the average doses to the right and left eyes of 10 patients were 0.17 ± 0.02 cGy and 0.13 ± 0.02 cGy from the anterior portal field and for the lateral portal field, the doses to the right and left eyes were found to be 0.14 ± 0.02 cGy and 0.13 ± 0.02 cGy. Table 3 represents the average dose to the right and left eye for ten patients when both eyes were outside the portal field. Figure 9 (A, B) depicts the combined dose to the right eye and left eye from both the anterior and lateral portal fields.
Table 3.
Dose measured with both eyes away from the portal fields during imaging
| Patient number | Right eye | Left eye | ||
|---|---|---|---|---|
| Anterior portal | Lateral portal | Anterior portal | Lateral portal | |
| 1 | 0.37 ± 0.03 | 0.02 ± 0.01 | 0.30 ± 0.03 | 0.12 ± 0.02 |
| 2 | 0.49 ± 0.01 | 0.18 ± 0.02 | 0.27 ± 0.01 | 0.12 ± 0.02 |
| 3 | 0.27 ± 0.03 | 0.10 ± 0.01 | 0.03 ± 0.02 | 0.18 ± 0.03 |
| 4 | 0.20 ± 0.04 | 0.01 ± 0.01 | 0.01 ± 0.03 | 0.30 ± 0.01 |
| 5 | 0.01 ± 0.02 | 0.22 ± 0.02 | 0.20 ± 0.02 | 0.18 ± 0.02 |
| 6 | 0.11 ± 0.03 | 0.20 ± 0.02 | 0.20 ± 0.03 | 0.02 ± 0.01 |
| 7 | 0.20 ± 0.01 | 0.03 ± 0.03 | 0.11 ± 0.01 | 0.066 ± 0.03 |
| 8 | 0.01 ± 0.03 | 0.22 ± 0.02 | 0.11 ± 0.02 | 0.117 ± 0.01 |
| 9 | 0.02 ± 0.02 | 0.20 ± 0.02 | 0.01 ± 0.02 | 0.012 ± 0.00 |
| 10 | 0.02 ± 0.01 | 0.20 ± 0.02 | 0.02 ± 0.02 | 0.189 ± 0.01 |
Figure 9.
Eye dose from both anterior and lateral portal fields (A) when both eyes were inside the field (B) when both the eyes were outside the field
The average doses to the eyes for 10 patients in which one eye was inside the portal fields and the other eye was completely outside the portal fields were 3.28 ± 0.2 cGy (ipsilateral eye) and 0.36 ±0.1 cGy (contralateral eye), respectively, from the anterior portal field, whereas for the lateral portal field the average dose to the ipsilateral eye was 0.3 ± 0.1 cGy and contralateral eye was 0.24 ± 0.1 cGy. Table 4 represents the ipsilateral and contralateral average eye doses of ten patients when a single eye was within the portal field. The in-vivo dose measurements carried out at the central axis of the beam during portal imaging with the double exposure technique indicate that an average dose of 2.80 ± 0.12 cGy and 2.75 ± 0.11 cGy was delivered to each patient from the anterior and lateral portal fields, respectively.
Table 4.
Dose measured with one eye inside the portal field during imaging
| Patient Number | Ipsilateral eye | Contralateral eye | ||
|---|---|---|---|---|
| Anterior portal | Lateral portal | Anterior portal | Lateral portal | |
| 1 | 3.92 ± 0.22 | 0.10 ± 0.02 | 0.23 ± 0.05 | 0.65 ± 0.07 |
| 2 | 2.78 ± 0.13 | 0.53 ± 0.07 | 0.07 ± 0.03 | 0.09 ± 0.05 |
| 3 | 2.56 ± 0.25 | 0.35 ± 0.23 | 0.28 ± 0.06 | 0.35 ± 0.04 |
| 4 | 3.45 ± 0.28 | 0.19 ± 0.25 | 0.14 ± 0.06 | 0.21 ± 0.05 |
| 5 | 4.40 ± 0.14 | 0.43 ± 0.09 | 0.74 ± 0.07 | 0.20 ± 0.01 |
| 6 | 3.48 ± 0.13 | 0.33 ± 0.12 | 0.58 ± 0.08 | 0.27 ± 0.05 |
| 7 | 3.23 ± 0.20 | 0.30 ± 0.05 | 0.37 ± 0.07 | 0.24 ± 0.06 |
| 8 | 3.33 ± 0.12 | 0.04 ± 0.10 | 0.37 ± 0.05 | 0.01 ± 0.01 |
| 9 | 2.59 ± 0.26 | 0.13 ± 0.07 | 0.53 ± 0.07 | 0.01 ± 0.01 |
| 10 | 3.06 ± 0.11 | 0.63 ± 0.11 | 0.31 ± 0.03 | 0.43 ± 0.05 |
Discussion
Imaging using EPID during treatment enables accurate targeting of the lesion and proper positioning of the patient in precision radiotherapy. The EPID allows two-dimensional image guidance which has certain limitations on the image quality produced with megavoltage beams. The recent advanced technology in imaging systems with amorphous silicon flat panel devices allows performing cone beam computed tomography (CBCT) imaging during radiotherapy. Now, with the increasing use of imaging procedures for IGRT, this will increase additional dose to the patient undergoing radiation therapy.
To verify the position of the patient prior to the treatment orthogonal portal images are acquired with the megavoltage photon beam using square fields and low monitor units (MUs). Generally, the radiation dose due to imaging has been traditionally ignored due to its low magnitude when compared to the therapeutic dose used to treat patients. Though the portal dose due to MV imaging is small, repeated use of imaging could deliver a dose that may perhaps increase the probability of a stochastic effect [16–19].
Several authors reported on the dose strategies during portal imaging that used perpendicular MV imaging with regular treatment using low MU (5 MU) which leads to the additional dose to the organ at risk which was reported as 6.6 cGy to the rectum. For regular fractionation with 60 Gy in 30 # to the prostate leads to the additional dose to the rectum of 0.79 Gy. During EPID imaging to the pelvis with regular AP and Lateral imaging with 5 MU results in the total dose of 12 mGy in the pelvis which leads to the additional dose due to the rectum during imaging which could be taken into account during the planning process [20].
In this study, the average dose measured using Standard Sensitivity MOSFET dosimeters during the imaging procedure during setup verification received by the eyes was 3 cGy for 10 patients while both eyes were completely inside the portal fields which leads to an excess dose of 100 cGy for 33 fractions, whereas on the other hand, the average dose was 0.25 cGy for 10 patients while both eyes are completely out of the portal fields and doses to the eyes were nicely spared. Similarly, the average dose received by 10 patients for one eye which is inside the portal was found to be 3.6 cGy, which leads to an excess dose of 120 cGy to the ipsilateral eye while sparing the contralateral eye. Based on the dosimetric data, further investigations were made and the imaging method and frequency of imaging was standardized. However, an additional physical dose added during MV portal images to the eyes which could be considered during the planning process helps to optimize the dose limits to the organ at risk.
Conclusion
Image-guided radiotherapy is the new paradigm for external-beam treatment delivery. In-vivo dose measurements were carried out using Standard Sensitivity MOSFET dosimeters to measure the eye dose during 2D-MV portal imaging. The Standard Sensitivity MOSFET dosimeters have been found to be very suitable for assessing the dose during MV imaging and the dosimetric data helps to optimize the imaging procedure. It also helps to document the patient’s dose during imaging.
Footnotes
Conflicts of interest
None declared.
Funding
None declared.
Ethical standards
This study was approved by Ethical Committee, Christian Medical College, Vellore, India.
References
- 1.Murphy MJ. Tracking moving organs in real time. Semin Radiat Oncol. 2004;14(1):91–100. doi: 10.1053/j.semradonc.2003.10.005. [DOI] [PubMed] [Google Scholar]
- 2.Mageras G. Introduction Management of Target Localization Uncertainties in External-Beam Therapy. Semin Radiat Oncol. 2005;15(3):133–135. doi: 10.1016/j.semradonc.2005.01.008. [DOI] [PubMed] [Google Scholar]
- 3.Jaffray DA. Emergent technologies for 3-dimensional image-guided radiation delivery. Semin Radiat Oncol. 2005;15(3):208–216. doi: 10.1016/j.semradonc.2005.01.003. [DOI] [PubMed] [Google Scholar]
- 4.Xing L, Thorndyke B, Schreibmann E, et al. Overview of image-guided radiation therapy. Med Dosim. 2006;31(2):91–112. doi: 10.1016/j.meddos.2005.12.004. [DOI] [PubMed] [Google Scholar]
- 5.Baumann M, Petersen C. TCP and NTCP: a basic introduction. Rays. 2005;30(2):99–104. [PubMed] [Google Scholar]
- 6.Gay HA, Niemierko A. A free program for calculating EUD-based NTCP and TCP in external beam radiotherapy. Phys Med. 2007;23(3–4):115–125. doi: 10.1016/j.ejmp.2007.07.001. [DOI] [PubMed] [Google Scholar]
- 7.Keinj R, Bastogne T, Vallois P. Multinomial model-based formulations of TCP and NTCP for radiotherapy treatment planning. J Theor Biol. 2011;279(1):55–62. doi: 10.1016/j.jtbi.2011.03.025. [DOI] [PubMed] [Google Scholar]
- 8.Murphy MJ, Balter J, Balter S, et al. The management of imaging dose during image-guided radiotherapy: report of the AAP M Task Group 75. Med Phys. 2007;34(10):4041–4063. doi: 10.1118/1.2775667. [DOI] [PubMed] [Google Scholar]
- 9.Van Dyk J. The Modern Technology of Radiation Oncology. Vol. 3. Medical Physics Publishing; Madison: 2013. [Google Scholar]
- 10.Kutcher GJ, Coia L, Gillin M, et al. Comprehensive QA for radiation oncology: report of AAP M Radiation Therapy Committee Task Group 40. Med Phys. 1994;21(4):581–618. doi: 10.1118/1.597316. [DOI] [PubMed] [Google Scholar]
- 11.International Commission on Radiation Units and Measurements. Determination of absorbed dose in a patient irradiated by beams of X or gamma rays in radiotherapy procedures. Report 24. ICR U Publications; Washington: 1976. [Google Scholar]
- 12.Procedures in external radiation therapy dosimetry with electron and photon beams with maximum energies between 1 and 50 MeV. Recommendations by the Nordic Association of Clinical Physics (NACP ) Acta Radiol Oncol. 1980;19(1):55–79. doi: 10.3109/02841868009130136. [DOI] [PubMed] [Google Scholar]
- 13.Alecu R, Loomis T, Alecu J, et al. Guidelines on the implementation of diode in vivo dosimetry programs for photon and electron external beam therapy. Med Dosim. 1999;24(1):5–12. doi: 10.1016/s0958-3947(98)00045-4. [DOI] [PubMed] [Google Scholar]
- 14.Higgins PD, Alaei P, Gerbi BJ, et al. In vivo diode dosimetry for routine quality assurance in IMRT. Med Phys. 2003;30(12):3118–3123. doi: 10.1118/1.1626989. [DOI] [PubMed] [Google Scholar]
- 15.Heukelom S, Lanson JH, Mijnheer BJ. Comparison of entrance and exit dose measurements using ionization chambers and silicon diodes. Phys Med Biol. 1991;36(1):47–59. doi: 10.1088/0031-9155/36/1/005. [DOI] [PubMed] [Google Scholar]
- 16.Gilhuijs K, Drukker K, Touw A, et al. Interactive three dimensional inspection of patient setup in radiation therapy using digital portal images and computed tomography data. Int J Radiat Oncol Biol Phys. 1996;34(4):873–885. doi: 10.1016/0360-3016(95)02183-3. [DOI] [PubMed] [Google Scholar]
- 17.Walter C, Boda-Heggemann J, Wertz H, et al. Phantom and in-vivo measurements of dose exposure by image-guided radiotherapy (IGRT): MV portal images vs. kV portal images vs. cone-beam CT. Radiother Oncol. 2007;85(3):418–423. doi: 10.1016/j.radonc.2007.10.014. [DOI] [PubMed] [Google Scholar]
- 18.Herman MG. Clinical use of electronic portal imaging. Semin Radiat Oncol. 2005;15(3):157–167. doi: 10.1016/j.semradonc.2005.01.002. [DOI] [PubMed] [Google Scholar]


