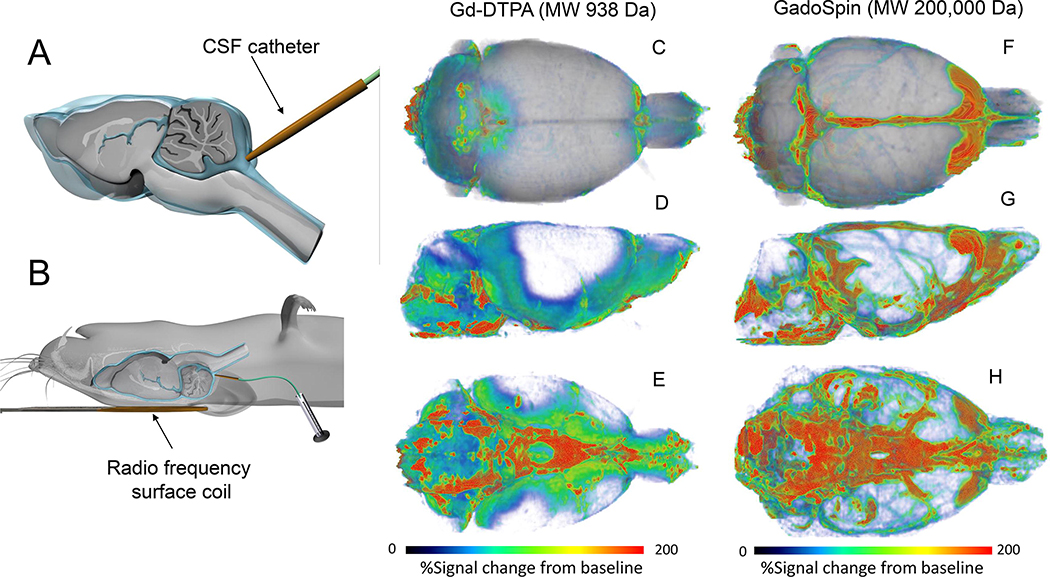
Fig. 1. Overview of dynamic contrast enhanced MRI with Gd-contrast into CSF.
A: Illustration of catheter position for Gd- contrast delivery into cerebrospinal fluid (CSF, blue liquid) via the cisterna magna of a rat brain. The rat brain is shown in a sagittal transverse cut to show the CSF compartment (blue) in relation to the brain tissue (grey color). B: In preparation for magnetic resonance imaging (MRI) and glymphatic transport, the anesthetized rat with the indwelling CSF catheter is positioned supine with the small radio frequency surface coil placed under the head. C-E: 3D volume rendered dynamic contrast enhanced MRI (DCE)-MRI) images of a rat brain in top (C), lateral decubitus (D) and caudal/ventral view (E) are shown ~ 90 min after CSF administration of Gd-DTPA (molecular weight, (MW) 938 Da). The DCE-MRI data has been processed so that the color-coded map represents ‘% signal change from baseline’. Red and blue colors represent high and low glymphatic transport of Gd-DTPA, respectively. There is high glymphatic uptake of Gd-DTPA into the cerebellum, ventral hippocampus, and olfactory bulb. F-H: 3D volume rendered DCE-MRI of another rat ~ 90 min after CSF administration of GadoSpin which is a large molecule (MW 200,000 Da) compared to Gd-DTPA. Again, the color-coded map represents %signal from baseline. The distribution pattern of GadoSpin is remarkably different from Gd-DTPA and the bulk of the signal remains in the CSF compartment and the perivascular space along large arteries on the ventral surface of the brain. There is almost no tissue uptake of GadoSpin over 90 min. DCE-MRI data are from Iliff et al., (Iliff, et al., 2013).

