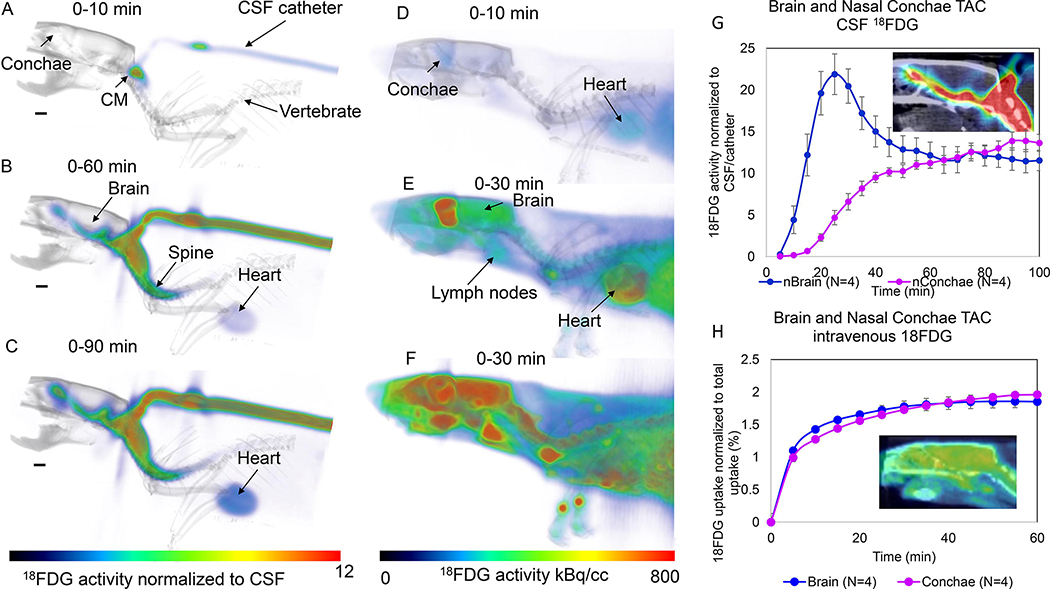
Fig. 6: Brain-wide glymphatic transport in rat brain of 18FDG evaluated by PET-CT.
A-C: Dynamic summed 18FDG PET images are shown (A = 0–10min), B = 0–60 min, C = 0–90min from the time of administration of 18FDG into the CSF via the cisterna magna (CM). The 3D volume rendered color-coded maps represent the summed 18FDG activity normalized to activity in the CSF (cisterna magna/catheter) which are overlaid on the corresponding 3D volume rendered image for anatomical landmarking. At the earliest time, 18FDG is presented in the CM only (A), and at later timepoints 18FDG is observed along the ventral surface of the brain/CSF, inside the brain proper as well as in the nasal conchae (B, C). Faint uptake in the heart can also be appreciated. D-F: Dynamic summed 18FDG PET images are shown from a rat receiving i.v. 18FDG. The 3D volume rendered color coded maps represent 18FDG activity summed over a given time interval to show the uptake pattern over time. At early time after i.v. administration 18FDG uptake is evident in the brain, heart, spine and lymph nodes. G: Time activity curves (TAC) from the whole brain and nasal conchae from four rats receiving 18FDG. The data are presented as mean ± SEM. The TAC from brain peaks at ~25 min after the 18FDG administration into the CSF, whereas the TAC from the nasal conchae steadily increase from 40–100min. The insert shows 18FDG activity at 90min overlaid on the CT image. H: Corresponding TACs from brain and nasal conchae from 4 rats receiving i.v. 18FDG. There is an immediate increase in activity over the first 10min and plateau is reached at ~35–40min after i.v. 18FDG. The insert shows 18FDG activity at 60min in the brain and nasal conchae overlaid on the corresponding CT image.

