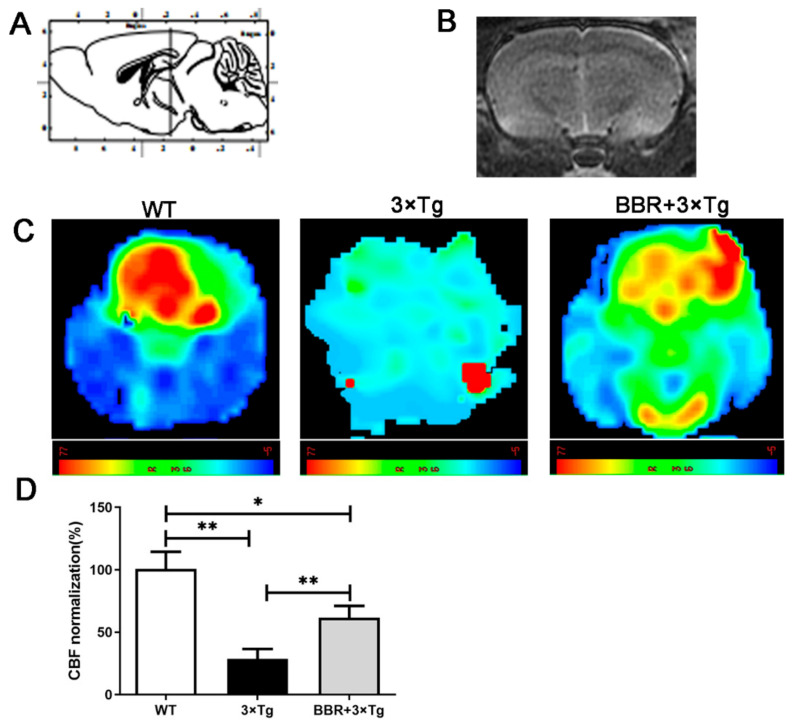
Figure 1.
Magnetic resonance imaging (MRI; 3D ASL) analysis showing changes in CBF in the brain of mice. (A) A cross-sectional image corresponding to the brain mapping of mice. (B) The gray-scale images are T2 imaging. (C) MRI images show the changes in CBF in the brain of mice, and color images are those with 3D ASL. The red label indicates a relatively higher CBF level, while the green indicates a relatively lower CBF level. (D) Quantitative analysis results of CBF in mice brains. WT, wild-type mice, 3×Tg, 3×Tg AD mice, BBR + 3×Tg; 3×Tg AD mice were given BBR at 100 mg/kg/day. One-way ANOVA and Dunnett’s post-hoc test were used to analyze all the data, expressed as mean ± SD; n = 12 animals/group. * p < 0.05, ** p < 0.01.

