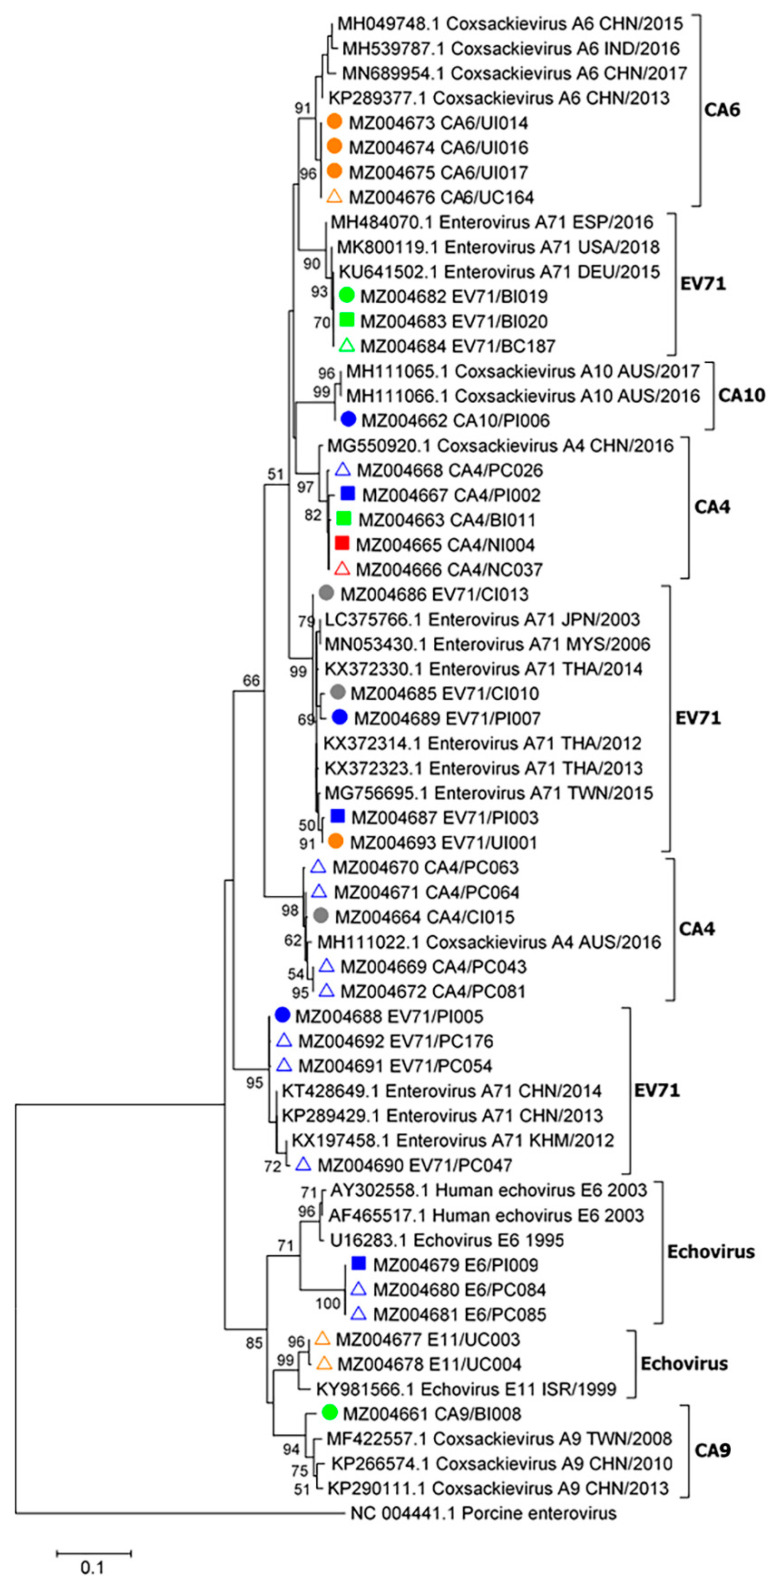
Figure 3.
Phylogenetic analysis of partial enteroviral 5′-UTR sequences (410 bp). The tree was constructed using enteroviral sequences obtained from children in five schools and nurseries as follows: school 1 (blue), school 2 (green), school 3 (yellow), school 4 (red), and school 5 (gray). The maximum likelihood method with a bootstrap value of 1000 was applied. Sample names and nucleotide sequence accession numbers are marked with symbols as follows: filled circles, sequences from HFMD cases; filled squares, sequences from cases with herpangina; open triangles, sequences from asymptomatic contact cases. Bootstrap values ≥ 50 are displayed at the nodes. The bar represents nucleotide substitutions per site. A porcine enterovirus sequence served as an out-group.

