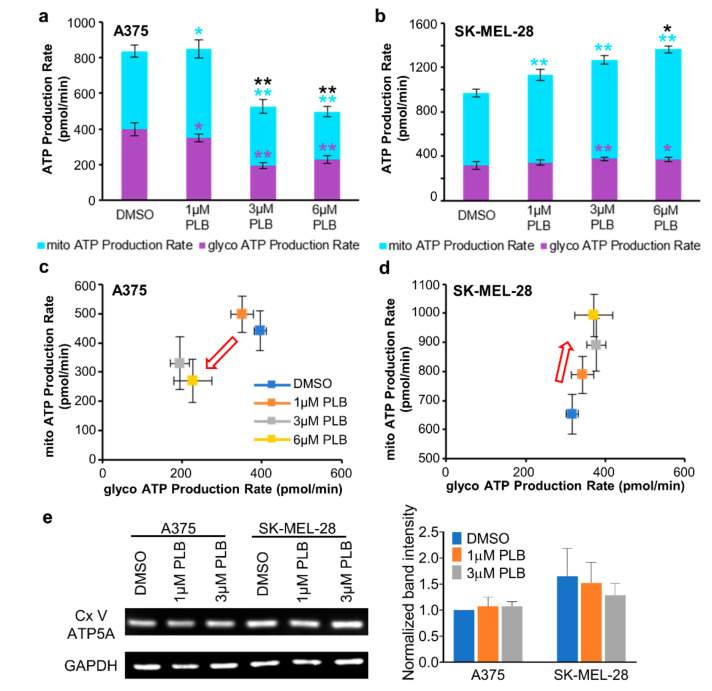
Figure 6.
PLB induced alternations of ATP production. Melanoma cells were seeded in the seahorse XF96 cell culture microplates at the density of 2 × 10⁴. DMSO and 1, 3, and 6 µM PLB were acutely applied in the Seahorse machine with the following injection of Oligo, ROT, and AA (n = 3–8). (a) The bar figure shows the absolute value of ATP production contributed by mitochondria and glycolysis in A375 cells. The significance for each experimental group was compared with the DMSO group. Asterisks in black, purple, and light blue represent total glycolysis and mitochondrial ATP production. (b) The bar figure shows the absolute value of ATP production contributed by mitochondria and glycolysis in SK-MEL-28 cells. The significance for each experimental group was compared with the DMSO group. Asterisks in black, purple, and light blue represent total glycolysis and mitochondrial ATP production. (c) ATP production map in A375 cells. The red arrow represents the trend of ATP production with the increasing concentrations of PLB. (d) ATP production map in SK-MEL-28 cells. The red arrow represents the trend of ATP production with the increasing concentrations of PLB. (e) Western blot result shows the expression of ATP5A, a subunit of mitochondrial Cx V in two cell lines with DMSO and 1 and 3 µM PLB treatment. The bar figure displays the normalized results compared with the expression of GAPDH (n = 3). Results are expressed as mean ± SD. * p < 0.05, ** p < 0.01. ATP5A, ATP synthase subunit alpha; Cx V, complex V.

