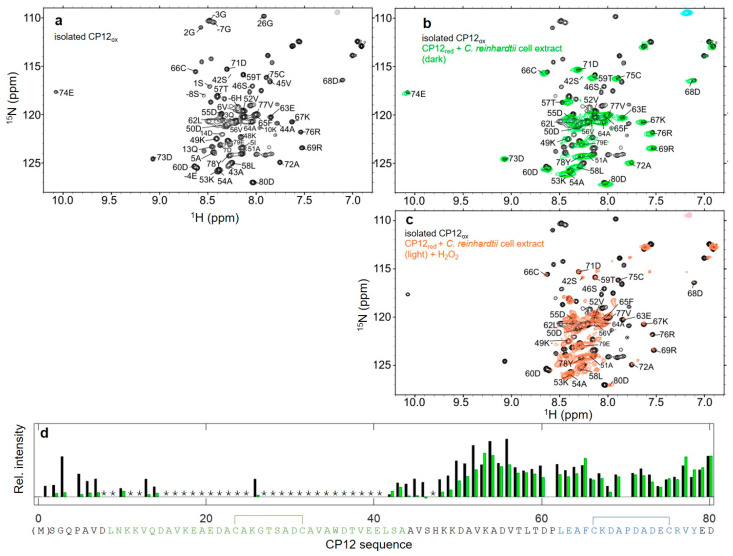
Figure 5.
CP12ox in isolation and in the presence of C. reinhardtii cell extract. (a) 1H-15N HSQC spectrum of isolated CP12ox. (b) Overlay of the 1H-15N HSQC spectra of isolated CP12ox (black) and that of CP12 in the presence of C. reinhardtii cell extract (green, molecular crowding corresponding to 19 mg mL−1 of protein). The data is recorded in the presence of 20 mM DTTox, and 0.1 mM DCMU. The assignments of the resonances that are observed in the presence of cell extract are indicated. (c) 1H-15N HSQC of CP12 in the presence of C. reinhardtii cell extract collected in the light (molecular crowding corresponding to 15 mg mL−1 of protein) and 20 mM H2O2 as a strong oxidizing agent. (d) Signal intensities for all residues in the 1H-15N HSQC spectrum of isolated CP12ox (black), and in the 1H-15N HSQC spectrum of CP12ox in presence of C. reinhardtii cell extract (green). The signal intensities are normalized against the mean of all intensities. The stars indicate residues for which the resonances are broadened beyond detection in isolated CP12ox [31], and the disulfide bridges are indicated above the sequence. The CP12 sequence is indicated below the graph with same color coding as in Figure 2.

