Abstract
A decline in stem cell function impairs tissue regeneration during aging, but the role of the stem cell supporting niche in aging is not well understood. The small intestine is maintained by actively cycling intestinal stem cells (ISCs) that are regulated by the Paneth cell niche1,2. Here we show that the regenerative potential of human and mouse intestinal epithelium diminishes with age due to defects in both stem cells and their niche. The functional decline was caused by decrease in stemness maintaining Wnt signalling due to production of an extracellular Wnt-inhibitor, Notum, in aged Paneth cells. Mechanistically, high mTORC1 activity in old Paneth cells inhibits PPARa activity3 and lowered PPARa increased Notum expression. Genetic targeting of Notum or Wnt-supplementation restored function of old intestinal organoids. Moreover, pharmacological inhibition of Notum in mice enhanced the regenerative capacity of old stem cells and promoted recovery from chemotherapy induced damage. Our results reveal an unappreciated role for the stem cell niche in aging and demonstrate that targeting of Notum can promote regeneration of old tissues.
Tissue turnover and regenerative capacity decrease upon aging in many tissue types4–6. The intestinal epithelium is one of the fastest renewing tissues in the human body and has been reported to regenerate without loss of self-renewal in long term in vitro organoid culture7. However, complications in the gastrointestinal system increase with age8–10, and intestines of old mice regenerate slower after radiation-induced damage11, suggesting reduced stem cell activity.
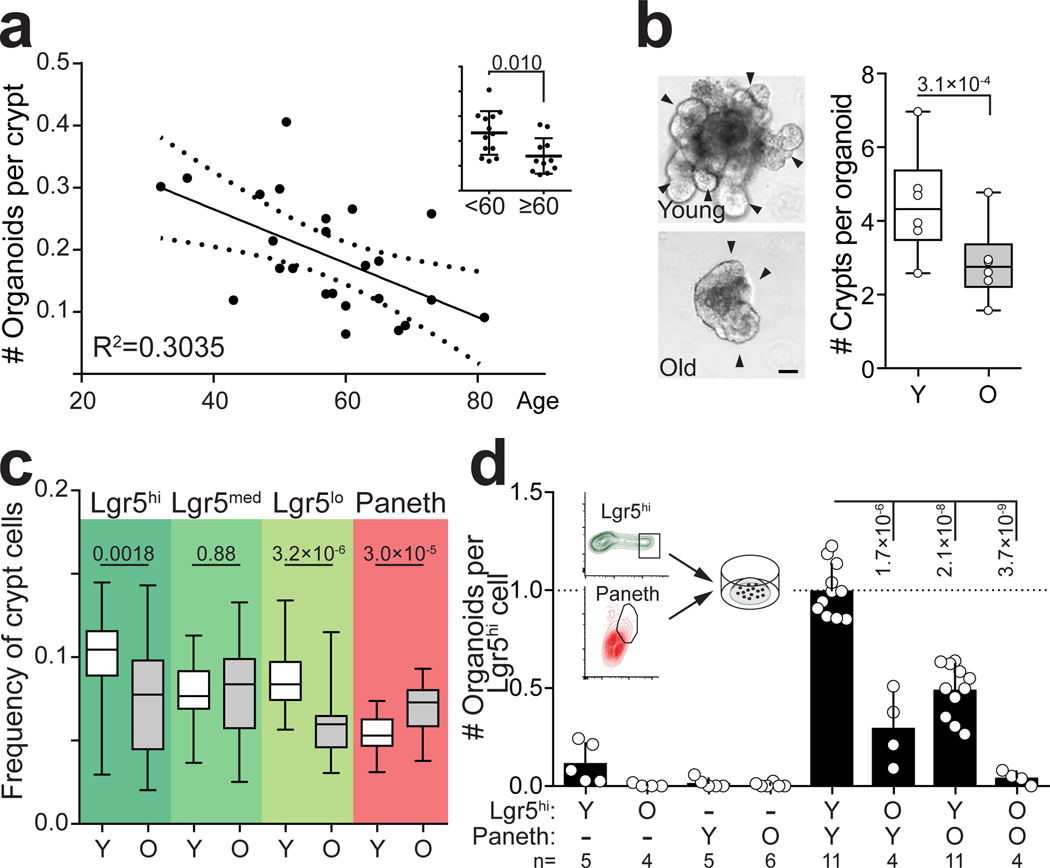
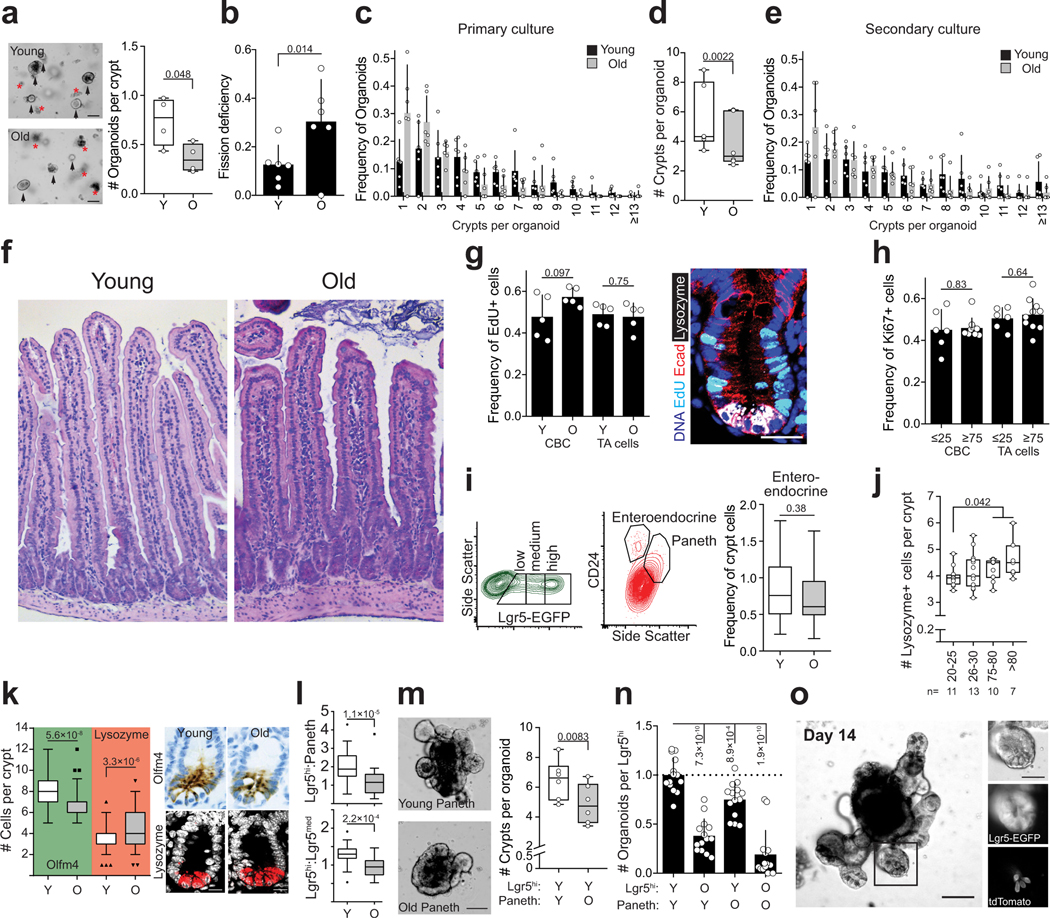
To assess possible aging-induced changes in the human intestinal epithelium, we used the capacity of ISC containing epithelial crypts to form clonogenic organoids7 as an in vitro assay of intestinal regenerative potential. We observed a significant age-induced reduction in the organoid forming capacity of colonic crypts biopsied from healthy human donors (Fig. 1a). As the heterogeneous human colon material does not allow downstream analysis of stem cell intrinsic and extrinsic effects, we next analysed the effects of age on mouse small intestinal epithelium. Crypts from old (>24 months) mice formed significantly fewer organoids than those isolated from young (3–9 months) animals (Extended Data Fig. 1a). Importantly, regenerative growth of de novo crypts was also diminished in the organoids formed by old crypts (Fig. 1b, Extended Data Fig. 1b,c), indicating a reduction in stem cell function. Furthermore, the reduced crypt formation observed during serial passage of secondary crypt domains demonstrated that the decline in epithelial regeneration was due to alterations intrinsic to the epithelium (Extended Data Fig. 1d,e).
Figure 1.
Age-associated reduction in intestinal regeneration is caused by decreased function of Lgr5+ stem cells and the Paneth cell niche
a, Organoid forming capacity of human colonic crypts (n=24). Linear regression +/− 95% CI. Over 60 years old donors show significantly lower organoid-forming capacity (inset). b, Regenerative growth of crypts from old and young mice. Organoids derived from young mice (n=6) generate more de novo crypt domains (arrowheads) in primary cultures (5–9 days after isolation). Representative images from Day 7, Scale bar 50μm. Student’s paired t-test. c, Cellular frequencies analyzed by flow cytometry (n=30 young, n=26 old). For FACS gating strategy, see Supplementary Fig. 1. d, Clonogenicity of young and old Lgr5hi stem cells co-cultured with young and old Paneth cells (n-values for analysed mice shown). Combinations compared to average of young Lgr5hi cells co-cultured with young and old Paneth cells. Y = mice between 3 and 9 months of age, O = mice over 24 months of age in all experiments. Unless otherwise indicated, line at Box-and-Whisker -plots represents median, box interquartile range and whiskers range. All other data are represented as mean +/− s.d. and conditions compared with two-tailed unpaired Student’s t-test, exact P-values shown in corresponding panels. P-values < 0.05 were considered significant.
Intestinal tissue renewal is largely maintained by the Lgr5 expressing ISCs, located between Paneth cells at the crypt base. ISCs divide regularly and produce transit-amplifying (TA) progenitor cells that divide several additional times and gradually differentiate. Paneth cells produce antimicrobial peptides and multiple signalling factors, such as EGF, Wnt3, Delta-like ligands, and cyclic ADP ribose (cADPR)2,12, which regulate stemness and function of the neighbouring ISCs. To more specifically address the separate roles of stem cells and their niche in age-associated intestinal decline, we used the Lgr5-EGFP-IRES-creERT2 reporter mice1, which allow the identification and isolation of Paneth cells, Lgr5–EGFPhi ISCs, and TA cells that can be further divided to immediate EGFPmed and late EGFPlo progenitors.
The aged mouse crypts did not present gross histological alterations, and the fraction of ISCs and TA cells that were EdU+ or Ki67+ was unchanged in old mouse and human samples (Extended Data Fig. 1f–h). However, flow cytometry of crypts from old mice revealed a significant drop in frequency of Lgr5hi ISCs (Fig. 1c), whereas Paneth cell frequency was significantly increased in old mice and humans (Fig. 1c, Extended Data Fig. 1i,j). As the Lgr5-EGFP-IRES-creERT2 mouse model exhibits mosaic expression of the EGFP containing construct1, the alterations in cellular frequencies were also validated by immunohistochemical analyses of Olfactomedin4 and Lysozyme to enumerate ISCs and Paneth cells, respectively (Extended Data Fig. 1k). Reduction in ISC number together with their unchanged EdU+ frequency suggested that old crypts may have a lower output of cells possibly contributing to the villus blunting and slower intestinal turnover during aging13. As Paneth cells positively regulate the number and function of Lgr5hi stem cells in young animals2,12, the decoupling of the Lgr5hi:Paneth cell ratio in old animals (Extended Data Fig. 1l) raised the possibility that interactions between these two cell types change during aging. To address this, we interrogated the organoid forming capacity of co-cultured Lgr5hi and Paneth cells isolated from young and old animals (Fig. 1d). Strikingly, old Paneth and Lgr5hi cells both showed cell-type specific age-induced effects, and initiated organoids with reduced efficiency. Consistent with previous work, neither cell type formed organoids efficiently alone2,12, but when co-cultured with Paneth cells, Lgr5hi cells from young animals formed organoids at higher rate than old Lgr5hi cells. Interestingly, the age-induced stem cell defect was partially rescued by co-culturing with young Paneth cells, whereas old Paneth cells failed to fully support organoid formation by young Lgr5hi cells. These data indicate that both stem cell intrinsic and extrinsic epithelial factors reduce the regenerative potential during intestinal aging.
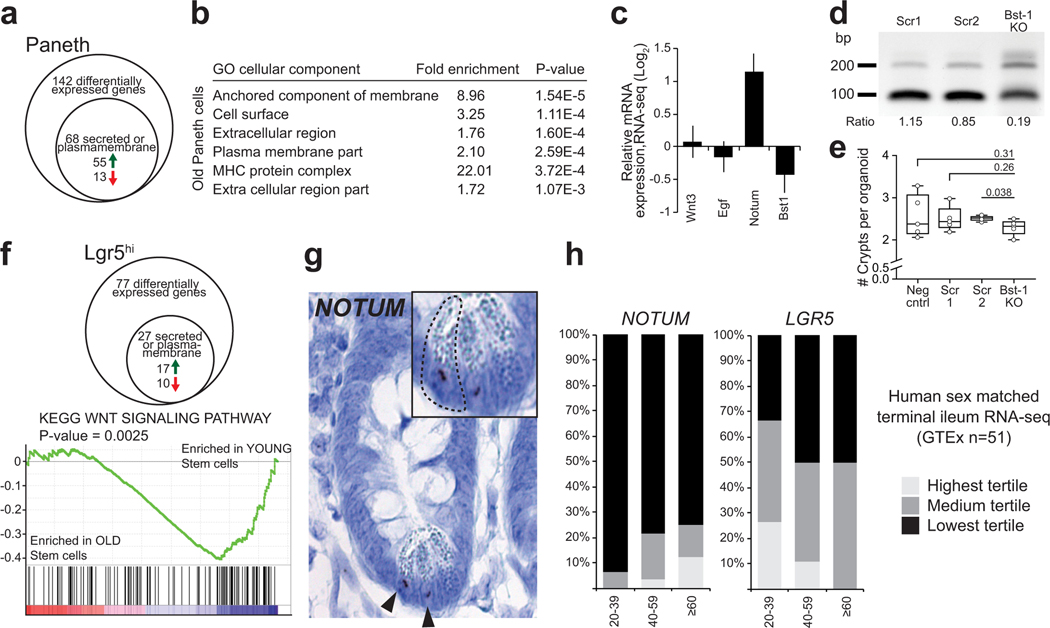
Decline in Fatty Acid Oxidation (FAO) was recently shown to intrinsically reduce the function of aged intestinal stem cells14. Surprisingly, we noted that old Paneth cells extrinsically decreased clonogenic growth of young Lgr5hi cells even in a long-term coculture (Extended Data Fig. 1m,n). While the original Paneth cells existed at least 14 days in such cocultures (Extended Data Fig. 1o), new Paneth cells are continuously produced by the stem cells, suggesting that exposure to old Paneth cells had long term effects on ISCs and their progeny. To mechanistically understand how age-induced changes in the niche-stem cell communication may influence stem cells, we performed RNA sequencing on both cell types (Supplemental Table 1). Interestingly, old Paneth cells showed particular deregulation of genes encoding secreted or plasma membrane-associated proteins (Extended Data Fig. 2a,b). Among the key stemness regulating factors, we noted no alterations in Wnt3 or Egf expression, whereas expression of cADPR producing Bst1 was reduced (Extended Data Fig. 2c However, targeting15 of Bst1 did not mimic the effects of aging on an ad libitum diet (Extended Data Fig. 2d,e).
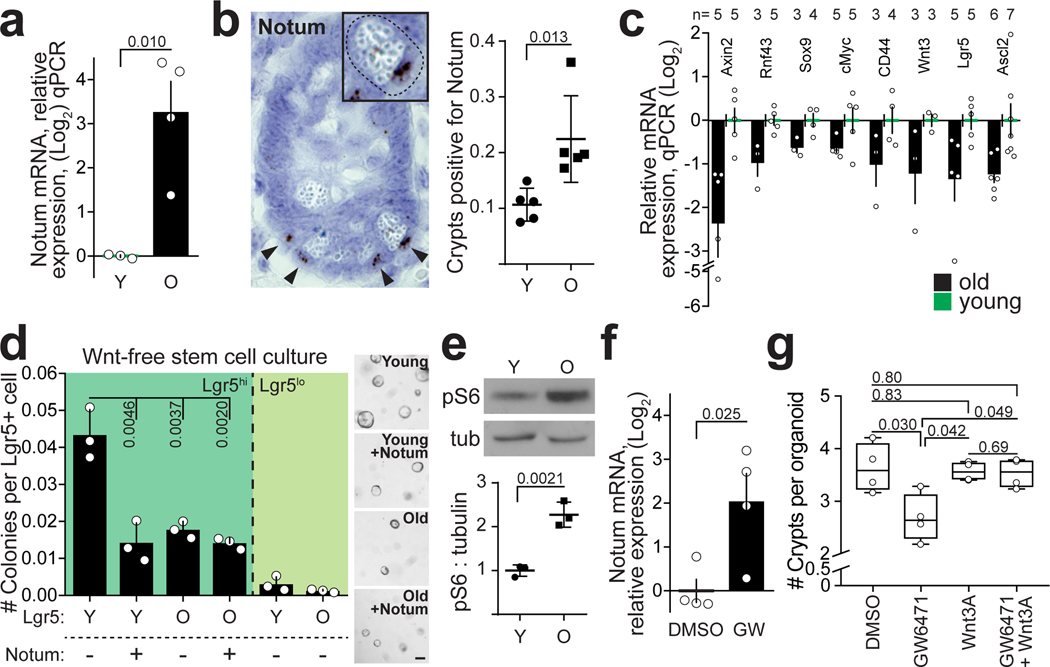
As the aged mouse intestine was also recently reported to harbour reduced Wnt activity13, we next focused on the extracellular Wnt inhibitor Notum that was significantly increased in old Paneth cells (Fig. 2a, Extended Data Fig. 2c). Notum is a secreted Wnt deacylase that disengages Wnt ligands from LRP5/6-Frizzled receptors, and reduces Wnt activity locally during development16,17. In the intestine, Wnts are produced by the mesenchymal cells aligning the crypt18,19, and by Paneth cells2,20. Wnt ligands produced by the niche adhere to ISC plasmamembrane, and form a reservoir of stemness maintaining factors until they become diluted due to divisions outside the Wnt producing niche21. Interestingly, increase in Notum expression was strictly restricted to old Paneth cells (Fig. 2b) where its secretion could counter the stemness-maintenance function of Wnt ligands. Correspondingly, expression of Wnt responsive genes was reduced in old Lgr5hi cells (Fig. 2c, Extended data Fig. 2f). NOTUM expression was restricted to Paneth cells also in the human intestine, and its expression correlated with age, whereas LGR5 expression and age correlated inversely (Extended Data Fig. 2g,h).
Figure 2.
Increased Notum expression from Paneth cells attenuates Wnt signals in the old stem cells
a, qPCR analysis of relative Notum expression from isolated Paneth cells (n=4 old, n=3 young animals). b, In situ analysis and quantification of Notum expression in mouse jejunum (n=5 animals in both age groups). Mean +/− s.d. c, Expression of Wnt responsive genes in isolated old Lgr5hi stem cells relative to young stem cell. Log2 fold change (n-values of mice analysed shown). d, Clonogenic capacity of isolated Lgr5+ from young and old mice cultured +/− recombinant Notum (1 μg/ml), (n=3 animals in both age groups). Representative images are from Day 7. Mean +/− s.d. Scale bar 100 μm e, Immunoblot and quantification of isolated young and old Paneth cells against pS6 and tubulin (n=3 animals in both age groups). Mean +/− s.d. f, Relative mRNA expression of Notum from small intestinal organoids of young mice treated 48h with 5 μM PPARa inhibitor GW6471 (n=4 biologically independent samples) g, Regenerative growth of small intestinal organoids at Day 6. Organoids were treated first 2 days with +/− GW6471 and +/− 100 ng/ml Wnt3A (n=4 biologically independent samples). Student’s paired t-test. Y = mice between 3 and 9 months of age, O = mice over 24 months of age in all experiments. Unless otherwise indicated, line at Box-and-Whisker -plots represents median, box interquartile range and whiskers range. All other data are represented as mean +/− s.e.m. and conditions compared with two-tailed unpaired Student’s t-test, exact P-values shown in corresponding panels. P-values < 0.05 were considered significant. For gel source data see Supplementary Fig. 3.
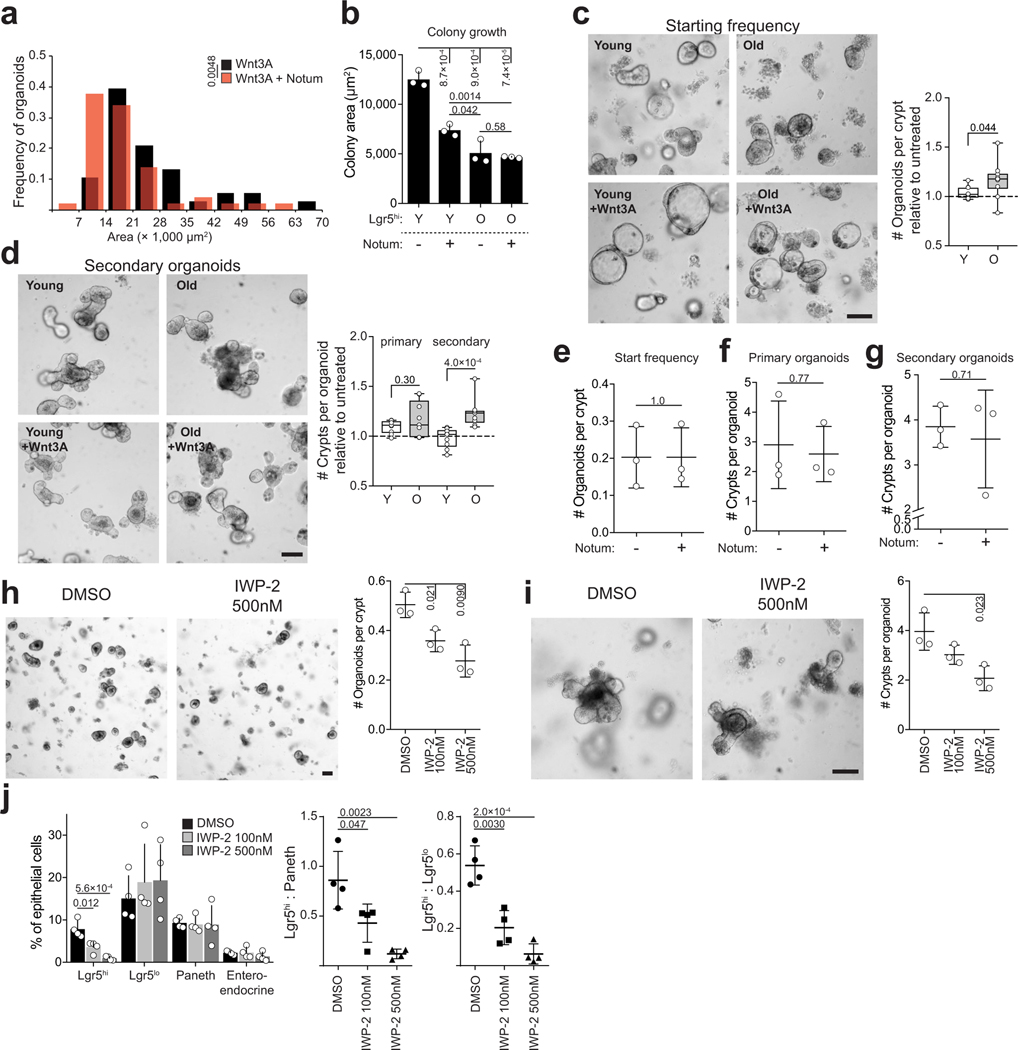
To test whether Notum indeed affects stemness, we cultured isolated Lgr5hi cells in the absence of Paneth cells and exogenous Wnt-ligands. Under these conditions single Lgr5hi cells form clonal spheroids, whereas more differentiated cells do not (Fig. 2d). When cells from young animals were treated immediately after isolation with biologically active recombinant Notum to inactivate the membrane bound Wnts that they were exposed to in vivo, their colony forming efficacy and the size of formed spheroids was dramatically reduced (Fig. 2d, Extended Data Fig. 3a,b). In contrast, colony formation of untreated cells from old mice was already reduced and Notum treatment did not have further effects. Correspondingly, exogenous Wnt-ligands increased organoid forming capacity and long-term regenerative growth specifically in the old crypts (Extended Data Fig. 3c,d). However, exogenously administered Notum had no effect on isolated crypts with tightly connected Paneth and stem cells (Extended Data Fig. 3e–g), suggesting that recombinant Notum had no access to the Wnt ligands produced by the Paneth cells. Demonstrating the role of epithelial Wnt secretion, inhibition of Porcupine21,22 reduced clonogenic growth and Lgr5hi:Paneth cell ratio of young organoids similarly to aging (Extended Data Fig.3 h–j). Taken together, these data highlight the consequences of reduced Wnt activity, and indicated Paneth cell expressed Notum as a candidate mechanism reducing Wnt activity in the old intestinal epithelium.
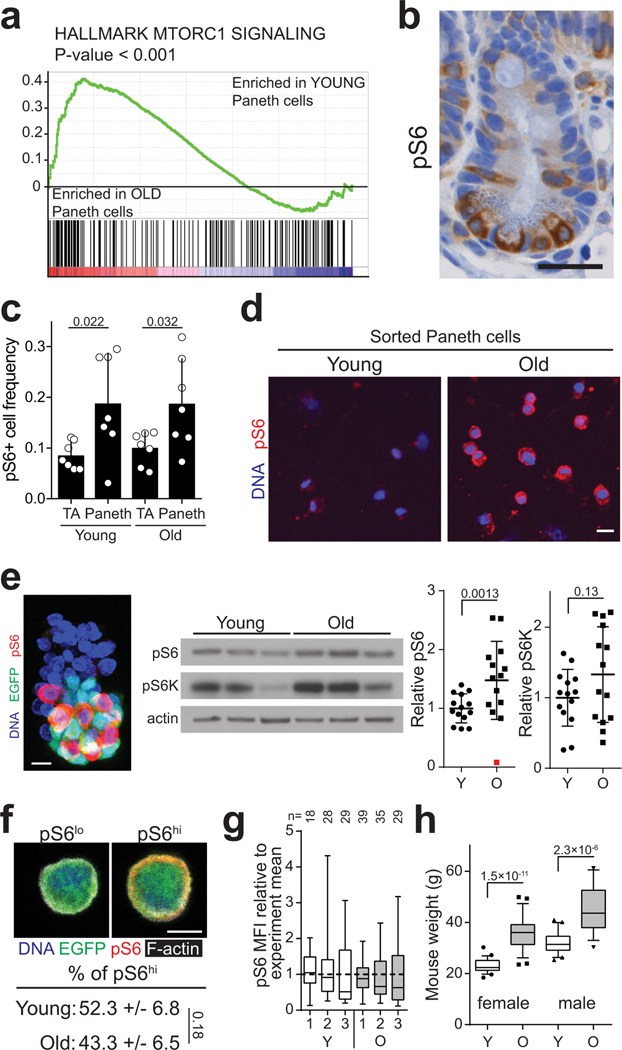
Notum is regulated by the canonical Wnt–pathway to form a negative feedback loop17. However, contrary to Lgr5hi ISCs, expression of Wnt-responsive genes was not significantly altered in old Paneth cells (Supplemental Table 1). To find other candidate pathways regulating Notum in Paneth cells, we performed Gene Set Enrichment Analysis (GSEA) and found that transcripts associated with activity of Mechanistic target of rapamycin complex 1 (mTORC1) were significantly increased in old Paneth cells (Extended Data Fig. 4a). mTOR signalling is linked with aging3 and in the intestine mTORC1 modulates ISC activity via the Paneth cell niche in response to calorie intake12. We detected higher levels of phosphorylation of ribosomal protein S6 (pS6), an mTORC1 downstream effector, in Paneth cells of old animals (Fig. 2e, Extended Data Fig. 4b–d), which was also reflected in whole crypt preparations (Extended Data Fig. 4e). However, frequency of pS6+ Paneth cells (Extended Data Fig. 4c) or pS6+ crypts (data not shown) was not changed, validating that mTORC1 activity was increased at the single Paneth cell level. In contrast, pS6 levels in ISCs were unchanged (Extended Data Fig. 4f,g), but as reported for the liver3, the age-induced mTORC1 activity in Paneth cells was associated with increased body mass (Extended Data Fig. 4h) potentially contributing to increased mTORC1 activity in old Paneths.
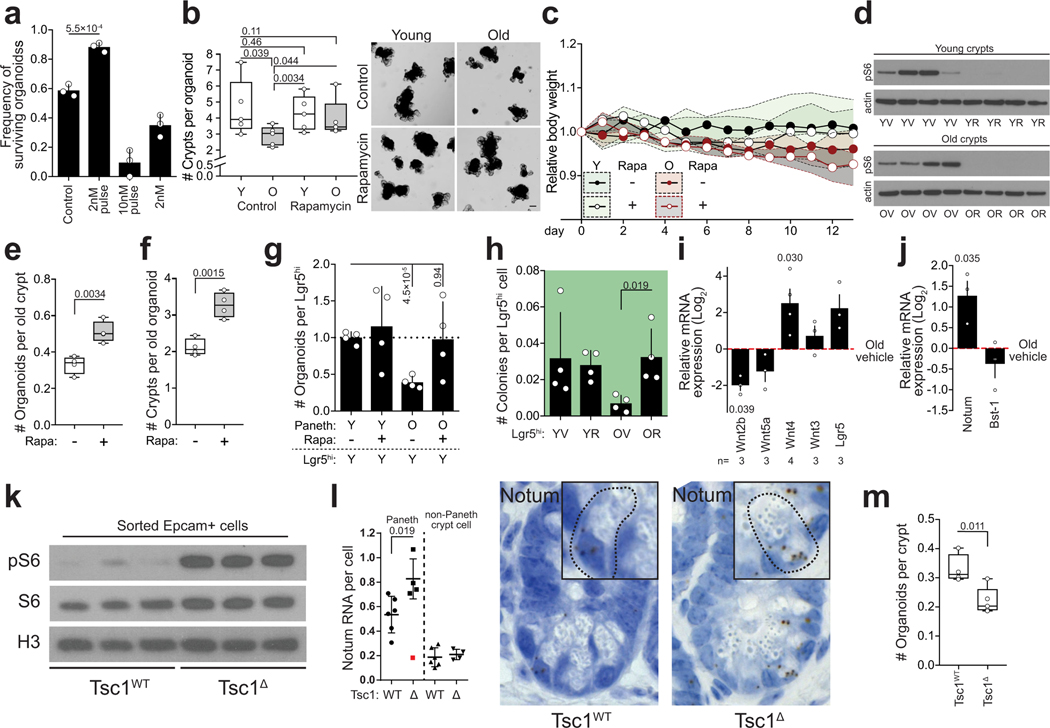
Inhibition of mTORC1 by Rapamycin or by calorie restriction extends life span by inducing multi-systemic effects23–26. When old crypts were transiently treated with Rapamycin, regenerative function was restored (Extended Data Fig. 5a,b). Moreover, two-week long in vivo treatment of old mice with Rapamycin resulted in a striking rejuvenation of intestinal regenerative capacity that was contributable to effects on both Paneth cells and ISCs (Extended Data Fig. 5c–h). However, in contrast to calorie restriction12, systemic Rapamycin induced broad changes in expression of intestinal Wnt-ligands, including the stromally produced Wnt4, which regulates Notum expression in the developing ovary27 (Extended Data Fig. 5i). Correspondingly, Notum expression was increased in the crypts from rapamycin treated mice (Extended Data Fig. 5j), possibly also reflecting increase in number of Paneth cells induced by Rapamycin12. To address the role of mTORC1 activity in the intestinal epithelium in vivo without the rapamycin induced systemic and stromal effects, we next activated mTORC1 specifically in the intestinal epithelium by Villin-Cre28 mediated deletion of Tuberculosis sclerosis complex 1 (Tsc1)29. Tsc1 deletion induced mTORC1 activation and Notum expression in Paneth cells, and reduced organoid forming capacity (Extended Data Fig. 5k–m). Taken together, these results indicate that increased cell-autonomous mTORC1 activity in Paneth cells contributes to the regenerative decline of the old intestinal epithelium.
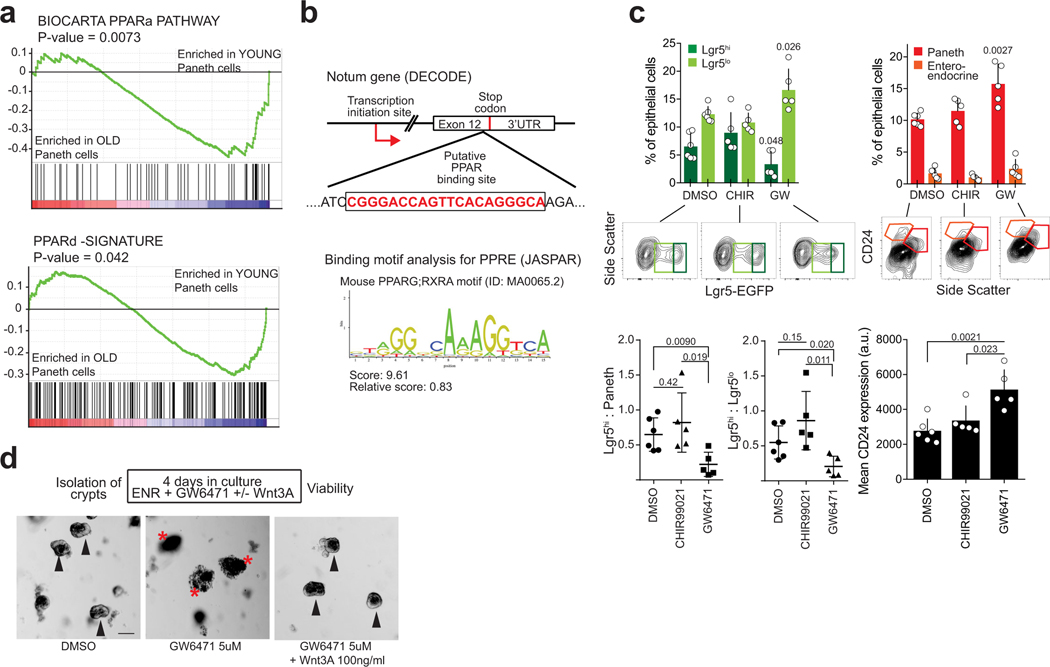
As mTORC1 does not directly regulate transcription, we next sought factors mediating Notum expression downstream of mTORC1 activation. To that end, GSEA analysis of old Paneth cells also indicated a significant reduction in expression of genes regulated by Peroxisome Proliferator Activated Receptor alpha and -delta (PPARa and PPARd respectively) (Extended Data Fig. 6a). mTORC1 activity inhibits PPARa3, and we found a putative binding site for PPARa in the Notum gene (Extended Data Fig. 6b). To test if downregulation of PPARa may contribute to the observed aging phenotypes, we treated young organoid cultures with PPARa antagonist (GW6471). Strikingly, GW6471 increased expression of Notum, reduced regenerative growth, and decreased the Lgr5hi:Paneth cell ratio (Fig. 2f,g, Extended Data Fig. 6c). Moreover, the aging mimicking effects of GW6471 were nullified by Wnt supplementation (Fig. 2g, Extended Data Fig. 6d). These data indicate that age-associated change in the mTOR-PPARa axis modifies Notum expression and the intestinal regenerative capacity in a Wnt dependent fashion.
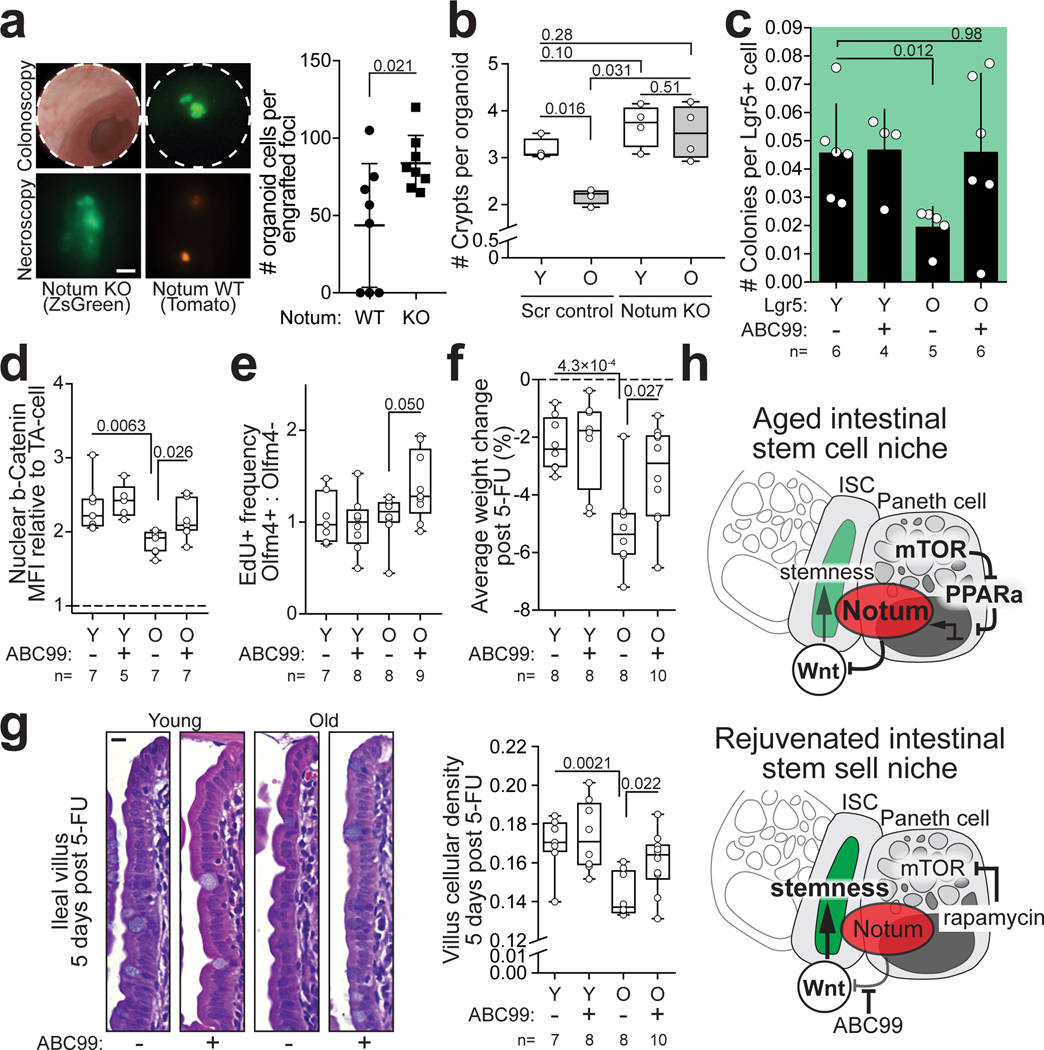
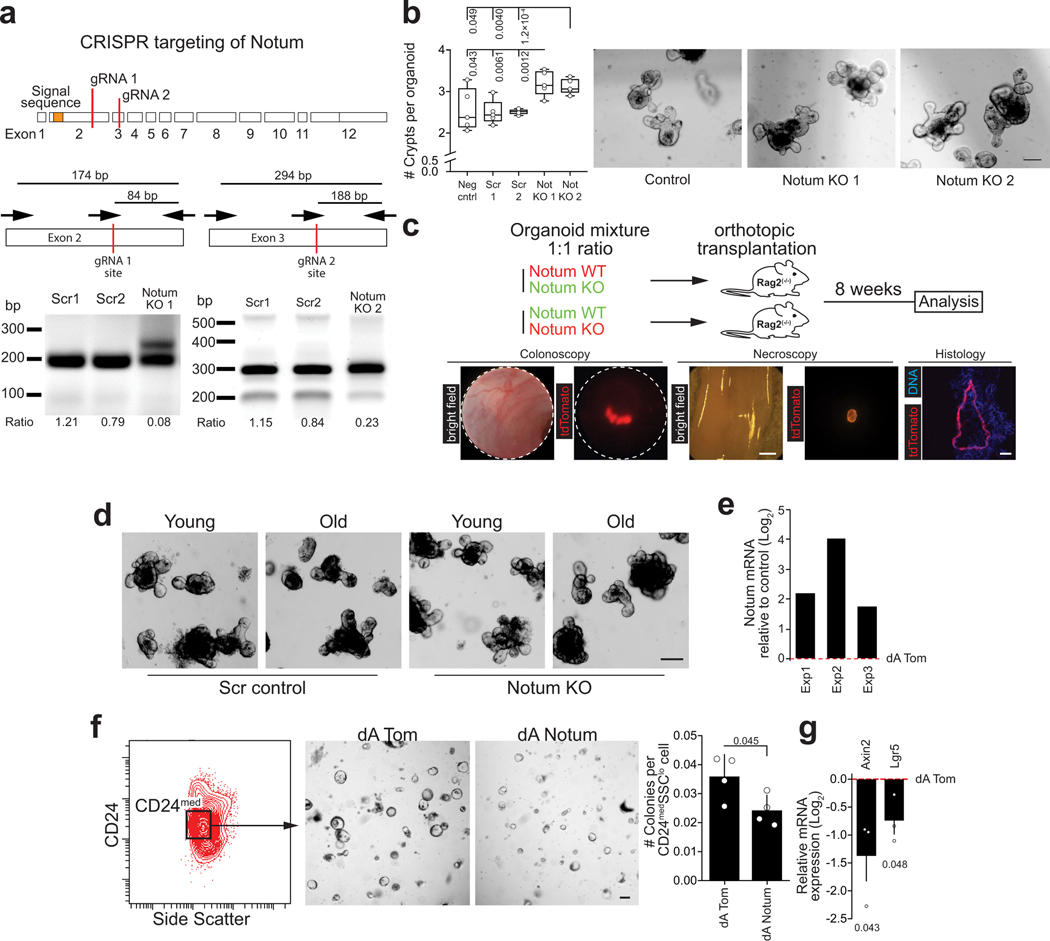
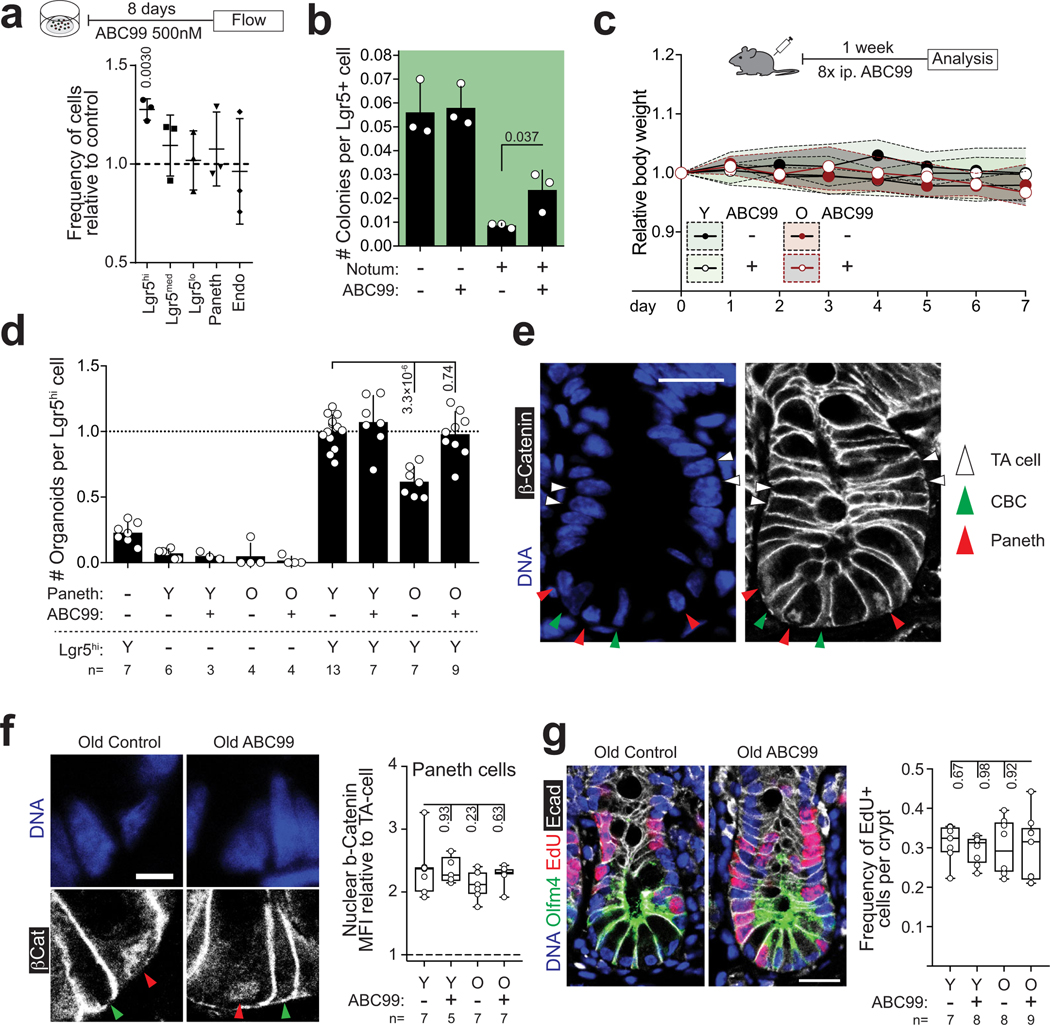
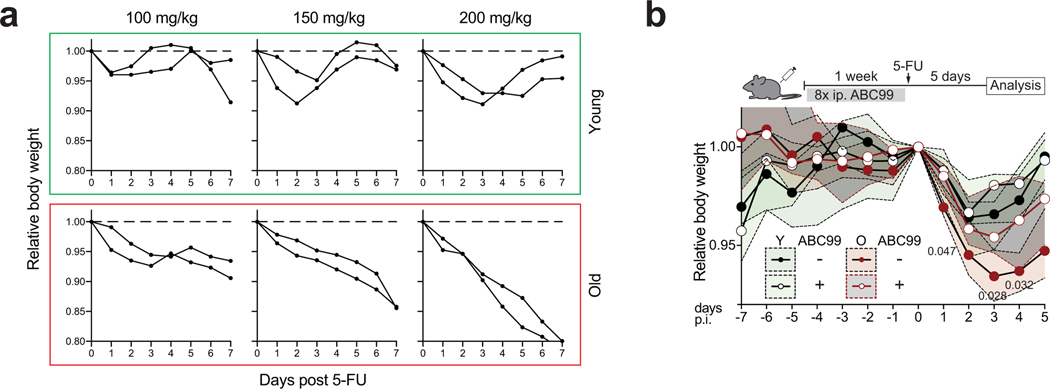
Finally, to investigate if endogenous Notum expression is functionally relevant for the regenerative function, we targeted Notum in organoids to knock-out gene function (Extended Data Fig. 7a). Notum knock-out organoids showed increased regenerative capacity in vitro and higher growth rate when orthotopically transplanted to recipient mouse submucosa (Fig. 3a, Extended Data Fig. 7b,c). Moreover, regenerative function of old organoids improved significantly after Notum deletion (Fig. 3b, Extended Data Fig. 7d). Conversely, activation of endogenous Notum expression by CRISPRa30 decreased Wnt signalling and colony forming capacity of CD24medSSClo cells containing the ISCs of the targeted organoids (Extended Data Fig. 7e–g). Finally, to test if the regenerative capacity of old intestines can be promoted via the intestinal stem cell niche, we used a novel small molecule inhibitor of Notum ABC9931. ABC99 blunted the effects of exogenous Notum and increased the frequency of Lgr5hi cells in vitro (Extended Data Fig. 8a,b), and in vivo treatment of mice with 10 mg/kg i.p. of ABC99 had no noticeable adverse effects (Extended Data Fig. 8c). Strikingly, the Lgr5hi cells that were isolated from old mice after 7 days of in vivo treatment with ABC99 demonstrated colony forming capacity comparable to the cells from untreated young animals (Fig 3c). Moreover, stem cell supporting function of Paneth cells was also restored suggesting autocrine regulation (Extended Data Fig. 8d). To address if Notum modulates Wnt activity of ISCs in vivo, we next compared the nuclear β-Catenin levels of ISCs between Paneth cells to those of more differentiated TA cells that are not in contact with Notum producing Paneth cells (Extended Data Fig. 8e). As expected, untreated old ISCs had reduced nuclear β-Catenin levels (Fig. 3d). ABC99 increased the nuclear β-Catenin levels of ISCs specifically in old animals (Fig. 3d, Extended Data Fig. 8f). This improved Wnt activity in old stem cells also translated to increased proliferation specifically in the Olfm4+ stem and progenitor cells in comparison to more differentiated TA cells (Fig. 3e). To formally test whether Notum inhibition promotes regeneration of old intestine, we analysed how advance Notum inhibition impacts recovery from chemotherapy (5-Fluorouracil, 5-FU) induced mucositis32,33 that results in loss of body weight due to compromised water retention and nutrient intake33. We treated mice with 100 mg/kg of 5-FU, as the weight of young mice recovered fully within 5 days from such dose, but old mice failed to recover (Extended Data Fig. 9a). Strikingly, when Notum activity was inhibited with ABC99 for 8 days prior to 5-FU, weight loss in old animals was significantly reduced (Fig. 3f, Extended Data Fig. 9b). Moreover, density of differentiated cells in the villi was restored to a youthful level, indicating enhanced regeneration by old stem cells (Fig. 3g). These data demonstrate that Paneth cell produced Notum attenuates regenerative capacity of aged intestinal epithelium in vivo by reducing Wnt activity specifically in stem cells.
Figure 3.
Inhibiting Notum activity in vivo restores Wnt mediated Paneth and stem cell function
a, Growth of CRISPR-targeted organoids after orthotopic transplantation. Notum KO organoids were co-transplanted with competing Scramble-targeted controls. (n=8 mice transplanted) Scale bar 1 mm b, Regenerative growth of CRISPR-targeted small intestinal organoids from young and old mice (n=4 animals per group). Student’s paired t-test c, Clonogenic growth of Lgr5hi stem cells from +/− ABC99 treated mice. Control animals received equal amount of inactive compound analogue (ABC101) or vehicle (n-values for analysed mice shown). d, Quantification of relative nuclear b-Catenin intestity of CBCs (n-values for analysed mice shown). e, Quantification of EdU+ cellular frequencies within the crypt (n-values for analysed mice shown). f, Average weight change post 5-FU (days 1–5) (n-values for mice per group shown) g, Representative images of H&E stained villi 5 days post 5-FU, scale bar 10 μm. Quantification of cellular density in ileal villi (cells per μm, n-values for analysed mice shown). h, Schematic model of stem cell maintenance by Paneth cells in aged niche. Y = mice between 3 and 9 months of age, O = mice over 21 months of age in all experiments. Unless otherwise indicated, line at Box-and-Whisker -plots represents median, box interquartile range and whiskers range. All other data are represented as mean +/− s.d. and conditions compared with two-tailed unpaired Student’s t-test, exact P-values shown in corresponding panels. P-values <0.05 were considered significant.
Appropriate Wnt levels are crucial for many stem cell compartments and alterations are seen in pathologies34. Stromal Wnt signals have been shown to maintain the epithelial stem cell pool in also in Paneth cell free conditions under normal tissue homeostasis18,19,35. However, recent data underlines the importance of epithelial Wnt signalling in regeneration following injury36. Here, we find that during aging, elevated Notum expression in Paneth cells of the intestinal stem cell niche in mouse and human inhibits Wnt signalling and reduces stem cell maintenance and regeneration. Simultaneously, reversing observed changes in mTORC1-PPARa signalling restored epithelial regeneration. Our findings underscore the importance of niche-regulated Wnt signals in promoting stemness and demonstrate a novel link between aging-associated metabolic changes and tissue maintenance. Such effects could be missed by studies demonstrating unaltered clonal dynamics of crypts during aging37. Since Wnt/β-catenin signalling can modulate FAO38, increasing Wnt activity in old stem cells could also help to restore the age-induced decline in FAO14. However, further experimentation is required to address whether the mechanisms described here also impact tumor risk in the old intestine39. Niche-stem cell interactions could anyway provide safer strategies to target tissue renewal and age-related decline than strategies directly targeting stem cells. Activation of PPAR alpha/delta signalling is not an attractive option in this regard, as PPARd was recently demonstrated to confer tumor-initiating capacity to non-stem cells in the intestine40. Notum inhibition with selective inhibitors, such as the ABC99 used here, may represent safer alternatives for targeting gastrointestinal complications and for reducing harmful side-effects of chemotherapeutic agents that pose a particular challenge for the elderly41.
METHODS
Isolation of mouse small intestinal crypts
Mouse small intestinal crypts were isolated as described previously12. Briefly, mouse small intestines were flushed with cold PBS, opened and mucus was removed. Intestine was cut to small fragments and incubated with several changes of 10 mM EDTA in PBS on ice for 2 h. Epithelium was detached by vigorous shaking. To enrich crypts, tissue suspension was filtered through 70 μm nylon mesh. Enriched crypts were washed once with cold PBS and plated into 60% Matrigel (BD Biosciences) with ENR media. 10 μM Y-27632 was added to the media for the first 2 days.
Isolation of human colonic crypts
Crypts from human colonic biopsies were isolated by vigorous shaking after one-hour incubation in ice cold PBS with 10 mM EDTA. To enrich crypts, tissue suspension was filtered through 70 μm nylon mesh. Enriched crypts were washed once with cold PBS and plated into 60% Matrigel (BD Biosciences) and cultured as described previously42.
Organoid culture
50–200 crypts were plated per 20 μl drop of 60% Matrigel and overlaid with ENR media (Advanced DMEM/F12 (Gibco), 1x Glutamax (Gibco), 100 U/ml of Penicillin and Streptomycin, 10 mM Hepes, 1x Β−27 (Gibco), 1x N-2 (Gibco), 50 ng/ml of mouse EGF (RnD), 100 ng/ml noggin (Peprotech), 500 ng/ml of RSpondin-1 (RnD), 1 μM N-Acetyl-L-cysteine (Sigma-Aldrich)). 10 μM Y-27632 was added for the first two days of culture. Organoid starting frequency was counted after 2 days of culture unless otherwise stated in the Figure legend. Primary organoids were cultured for 5–9 days, after which regenerative growth (number of de novo crypt domains per organoid) was quantified and organoids subcultured. Subculturing was performed by mechanically disrupting organoids to single crypt fragments, which were replated (1:3) to fresh Matrigel. Secondary cultures were confirmed to start from single crypt domain by inspection, and their survival and de novo crypt number was quantified 2 days after replating. When indicated ENR media was supplemented with Rapamycin (CST), GW6417 (Tocris), CHIR99021 (BioVision) or Wnt3A (RnD). Equal amount of vehicle (ethanol or DMSO) was used in controls. ENR supplemented with 10 nM Gastrin (Sigma-Aldrich), 100 ng/ml Wnt3A (RnD), 10 mM Nicotinamide (Sigma-Aldrich), 500 nM A-83–01 (Sigma-Aldrich) and 10 μM SB202190 (Sigma-Aldrich) was used for isolated human colonic crypts42. Colonic organoid starting frequency was counted at day 7.
Single cell sorting and analysis
To isolate single cells, isolated crypts or grown organoids were dissociated in TrypLE Express (Gibco) with 1000 U/ml of DnaseI (Roche) +32 °C (90seconds for crypts, 5min in +37 °C for cultured organoids). Cells were washed and stained with antibodies anti-CD31-PE (Biolegend, Mec13.3), anti-CD45-PE (eBioscience, 30-F11), anti-Ter119-PE (Biolegend, Ter119), anti-EpCAM-APC (eBioscience, G8.8) and anti-CD24-Pacific Blue (Biolegend, M1/69) all 1:500. Finally, cells were resuspended to SMEM media (Sigma) supplemented with 7-AAD (Life) (2 μg/ml) for live cell separation. Cells were sorted by using FACSAria II or FACSAria Fusion (BD Biosciences). Intestinal stem cells were isolated as Lgr5-EGFPhi; Epcam+; CD24med/−; CD31−; Ter119−; CD45−; 7-AAD−. Paneth cells as CD24hi; SideScatterhi; Lgr5-EGFP−; Epcam+; CD31−; Ter119-; CD45−; 7-AAD−. Enteroendocrine cells as CD24hi; SideScatterlo; Lgr5-EGFP−; Epcam+; CD31−; Ter119-; CD45−; 7-AAD−. When analysing organoids EGFP gates were applied directly on Epcam+; CD31−; Ter119−; CD45−; 7-AAD− population. Equal number of Lgr5hi and Paneth cells were co-cultured with ENR media supplemented with additional 500 μg/ml of Rspondin-1 (to yield final concentration of 1 μg/ml), 100 ng/ml Wnt3A and 10 μM of Jagged-1 peptide (Anaspec) for the first 6 days. 10 μM Y-27632 was added to the media for first 4 days. Single cell starting frequency and clonogenic growth of primary organoids were analysed at day 5–9. Long-term organoid forming capacity was quantified from twice suβ-cultured organoids 21 days after isolation. Culture of isolated Lgr5hi or CD24medSidescatterlo cells without Paneth cells and Wnt-ligands was performed in ENR supplemented with 10 μM Chir99021, 10 μM Y-27632 and 1 μg/ml of recombinant hNotum (RnD) and/or 50–500 nM ABC9931 when indicated for the first 5 days followed by culture in regular ENR media. Colony forming capacity was quantified on Day 5 or Day 7 as indicated in the Figure legends. Cross sectional area of colonies was quantified from bright field images taken with inverted cell culture microscope (Nikon TS100 Eclipse, DS-Qi1Mc camera) on Day 7. Paneth cells from mT/mG mouse derived organoids were isolated as CD24hi; SideScatterhi; Tomato+; Epcam+; 7-AAD- and cocultured with freshly isolated Lgr5hi stem cells. Cell population analysis was performed with FlowJo software (FlowJo, LLC).
CRISPR-Cas9 gene editing of intestinal organoids
Guide RNAs for the target gene knockout were designed with CRISPR design tool (http://crispr.mit.edu). Guides were cloned into lentiCRISPR v2 vector. Lentiviral vectors were produced in 293fT cells (ThermoFischer, R70007) and concentrated with Lenti-X concentrator (Clontech). 293fT cell line was not authenticated in the laboratory, but tested negative for mycoplasma. Cultured intestinal organoids were exposed to 1 mM Nicotinamide for 2 days before they were processed for transduction. Organoids were mechanically disrupted and dissociated to small fragments with TrypLE Express supplemented with 1000 U/ml of DnaseI 5 min at +32 °C. Fragments were washed once with SMEM media and resuspended to Transduction media (ENR media supplemented with 8 μg/ml of Polybrene (Sigma-Aldrich), 1 mM of Nicotinamide, 10 μM of Y-27632) and mixed with concentrated virus. Samples were spinoculated 1 h at 600 g +32 °C followed by 2–4 h incubation in +37 °C after they were collected and plated to 60% Matrigel overlaid with transduction media without polybrene. 2–3 days after transduction, infected clones were selected by adding 2 μg/ml of Puromycin (Sigma-Aldrich) to the media. 4 days after selection, clones that survived were expanded in normal ENR media and clonogenic growth was assessed. KO was confirmed by 3 primer PCR around the gRNA target site. In experiments comparing young and old gene-edited organoids, organoids were in culture at maximum 7 days before transduction. lentiCRISPR v2 was a gift from Feng Zhang (Addgene plasmid # 52961)43.
Oligos used for generation of gRNAs:
| Notum (1) | CACCGGGCGGGGCTGCCGTCATTGC |
| AAACGCAATGACGGCAGCCCCGCCC | |
| Notum (2) | CACCGTCGGCGGTGGTTACTCTTTC |
| AAACGAAAGAGTAACCACCGCCGAC | |
| Bst-1 | CACCGTTCTGGGGGCAAGAGCGCGG |
| AAACCCGCGCTCTTGCCCCCAGAAC | |
| Scramble (1) | CACCGCTAAAACTGCGGATACAATC |
| AAACGATTGTATCCGCAGTTTTAGC | |
| Scramble (2) | CACCGAAAACTGCGGATACAATCAG |
| AAACCTGATTGTATCCGCAGTTTTC |
Oligos used for confirming gene-editing:
| Notum (1) | TATGGCGCAAGTCAAGAGCC |
| CACGTCGGTGACCTGCAATG | |
| CAAGCCAGGTTGACGGCCT | |
| Notum (2) | CGGTTTGGGGATGAGGGTAG |
| GTCGGCGGTGGTTACTCTTT | |
| GCCAGTCTTTGGAGCTCAT | |
| Bst-1 | CCACGGGCTAGAGGAATCAA |
| GCAAGAGCGCGGTGGAC | |
| CTCAGCAGCGTGGTGTACT |
CRISPR-Cas9 gene activation of intestinal organoids
Lenti-SAM-Cre vector was constructed by assembling five DNA fragments with overlapping ends using Gibson Assembly. Briefly, fragments containing sequences corresponding to U6-sgRNA-MS2 (PCR amplified from lenti-sgRNA(MS2)-zeo, Addgene plasmid # 61427), the PGK promoter, MS2-p65-HSF1-T2A (PCR amplified from lenti-MS2-P65-HSF1-Hygro, Addgene plasmid # 61426), and T2A-Cre were Gibson assembled into a lentiviral backbone following manufacturer guidelines. For short guide RNAs (sgRNA) cloning, the Lenti-SAM-Cre vector was digested with BsmBI and ligated with BsmBI compatible annealed oligos. sgRNAs were designed using the Cas9 Activator Tool which is accessible online (sam.genome.engineering.org). At least five nucleotides were removed from the 5’ end of candidate sgRNAs to enable use of the SAM system with nuclease active Cas944. If the first nucleotide in the truncated sgRNA sequence was not a ‘G’, an additional nucleotide was removed and replaced with a ‘G’ to enable efficient expression of the sgRNA from the U6 promoter. Sequence against tdTomato was used as a control45. LSL-Cas9EGFP mouse derived small intestinal organoids were infected with Lenti-SAM-Cre derived virus. Cells with successfully integrated constructs were selected by sorting GFP+ cells from organoid cultures. Organoids were grown in ENR containing 3 μM CHIR99021 in order to avoid selection against Notum expression. Activation of Notum expression was confirmed by qPCR analysis from whole organoids cultured 2 days in ENR without CHIR99021. For assessing the effect of endogenous Notum on stem cells CD24medSidescatterlo cells were sorted from organoids cultured 4–5 days in ENR without CHIR99021.
sgRNA sequences used for generating Lenti-SAM-Cre vectors:
Notum (dANotum) GCTGGCCGCGGAGAA
tdTomato (dATom) CGAGTTCGAGATCGA
Real-time qPCR
RNA from crypts, single cells and cultured organoids was isolated by Trizol purification according to manufacturer’s instructions (Life) using Glycogen as coprecipitant (Life). Full tissue samples were shredded with ceramic beads (Precellys) in RLT buffer and RNA was isolated by RNAeasy+ kit (Qiagen) according to manufacturer’s instructions. Isolated RNA was transcribed with cDNA synthesis kit using OligodT primers (Molecular probes). qPCR amplification was detected by SYBRGreen (2xSYBRGreen mix, Applied biosciences) method. Samples were run as triplicates and genes of interest were normalized to GAPDH or beta-Actin. Primers used for qPCR:
| beta-Actin | CCTCTATGCCAACACAGTGC |
| CCTGCTTGCTGATCCACATC | |
| GAPDH | ATGGTGAAGGTCGGTGTGAA |
| TGGAAGATGGTGATGGGCTT | |
| Notum | CTGCGTGGTACACTCAAGGA |
| CCGTCCAATAGCTCCGTATG | |
| Bst-1 | ACCCCATTCCTAGGGACAAG |
| GCCTCCAATCTGTCTTCCAG | |
| CD44 | GCACTGTGACTCATGGATCC |
| TTCTGGAATCTGAGGTCTCC | |
| cMyc | CAAATCCTGTACCTCGTCCGATTC |
| CTTCTTGCTCTTCTTCAGAGTCGC | |
| Ascl2 | CTACTCGTCGGAGGAAAG |
| ACTAGACAGCATGGGTAAG | |
| Lgr5 | ACCCGCCAGTCTCCTACATC |
| GCATCTAGGCGCAGGGATTG | |
| Axin2 | AGTGCAAACTCTCACCCACC |
| TCGCTGGATAACTCGCTGTC | |
| Wnt2b | CGTGTAGACACGTCCTGGTG |
| GTAGCGTTGACACAACTGCC | |
| Wnt3 | TGGAACTGTACCACCATAGATGAC |
| ACACCAGCCGAGGCGATG | |
| Wnt4 | GTACCTGGCCAAGCTGTCAT |
| CTTGTCACTGCAAAGGCCAC | |
| Wnt5a | ATGAAGCAGGCCGTAGGAC |
| CTTCTCCTTGAGGGCATCG | |
| Rnf43 | CACCATAGCAGACCGGATCC |
| TATAGCCAGGGGTCCACACA | |
| Sox9 | GAGCCGGATCTGAAGAGGGA |
| GCTTGACGTGTGGCTTGTTC |
RNA sequencing and data processing
Total RNA from sorted Paneth (4 young and 5 old biological replicates) and Lgr5hi (3 young and 3 old biological replicates) cells were isolated by Trizol purification. Samples were first treated with HL-dsDNAse (ArticzymesP/N 80200–050) to remove residual DNA. An Ovation Universal RNA-Seq System kit was used for Illumina library preparations (NuGEN Technologies Inc., CA, USA). Purified total RNA (100 ng) was used and primers for ribosomal removal were designed and used as outlined in the kit manual. Libraries were purified with AMPure XP beads (Beckman Coulter Inc., MA, USA), quantified and run on a NextSeq 500 sequencer using 75b single read kits (Illumina, CA, USA). Adapter sequences and low quality reads were removed from the data using cutadapt46. The data was mapped to M. musculus genome GRCm38.p4 using STAR47. Count data was processed using GenomicFeatures and GenomicAlignments48, and the differential expression analysis carried out using DESeq249 in R. PreRanked GSEA analysis (http://software.broadinstitute.org/gsea/index.jsp) was performed for fold-change ranked genes with 1000 permutations50. Hallmark, Biocarta and Kegg gene sets are available via GSEA Molecular Signatures Database. PPARd gene set was adopted from Adhikary et al51. GO enrichment analysis was done for the significantly (adjusted p-value <0.1) altered genes with Gene Ontology Consortium Enrichment analysis (http://geneontology.org/page/go-enrichment-analysis), using Fisher’s exact test not corrected for multiple testing. Subcellular localization for significantly altered genes was taken from Uniprot database (http://www.uniprot.org/). Putative transcription factor binding sites for PPAR alpha on mouse and human Notum gene were found by using DECODE Transcription Factor binding portal (http://www.sabiosciences.com) and confirmed for mouse by JASPAR database using PPRE motif (PPARG;RXRA) (http://jaspar.genereg.net). RNA sequencing data from Human terminal ileal samples were obtained from: (http://proteinatlas.org) the GTEx Portal on 01/06/18. Sex matched samples (51 males) were divided into three age groups (20–39, 40–59, >60 years old) and proportions of expression presented. The data is publicly available through ArrayExpress (upon publication) (http://www.ebi.ac.uk/arrayexpress/experiments/E-MTAΒ−7916).
Immunoblotting
Isolated crypts and cells were lysed in RIPA buffer with 1xHalt Protease inhibitor cocktail (ThermoFisher Scientific) and 1xPhosStop (Roche) phosphatase inhibitors. Protein concentrations of cleared lysates were measured by BCA protein kit (ThermoFisher Scientific). For sorted cells equal loading was adjusted by sorting same number of cells. Samples were run on 4–12% Bis-Tris protein gels (Life) and blotted on nitrocellulose membranes. Membranes were incubated with primary antibodies: pS6 (Ser240/244, CST,5364 for Fig 2h and Extended Data Fig. 4e and 5d, 1:1000), pS6 (Ser235/236, CST, 4858, 1:500 for Extended Data Fig. 5k), S6 (CST, 2217, 1:500), H3 (CST, 4499, 1:1000), beta-Actin (CST, 4967, 1:2000), alpha-Tubulin (CST, 2144, 1:1000) and pS6K (ImmunoWay,YP0886, 1:500) +4 °C o/n and HRP conjugated anti-rabbit (Sigma-Aldrich, 1:5000) or anti-mouse (CST, 1:1000) 1 h RT. Signal was detected using ECL reagent Supersignal West Femto (ThermoFisher Scientific). Densitometry was performed with ImageJ normalizing to beta-actin or alpha-tubulin.
Immunohistochemistry/fluorescence
Tissues were fixed in 4% PFA, paraffin embedded, and sectioned. Antigen retrieval was performed boiling in pH6 Citrate buffer (Sigma-Aldrich) for 5 minutes. Antibodies: Lysozyme (DAKO, EC3.2.1.17, 1:750), Ki67 (abcam, ab15580, 1:300), pS6 (Ser240/244) (CST, 5364, 1:1000), Olfm4 (clone PP7, gift from CST in Extended Data Fig. 1k, CST, 39141 in Extended Data Fig. 8g, 1:300), beta-Catenin (BD, 610153, 1:300), E-cadherin (BD, 610181, 1:500). Antigen retrieval was followed by permeabilization with 0,5% Triton-X100 (Sigma) and in case of analysis of EdU incorporation was followed by EdU Click-IT chemistry according to manufacturer’s instructions (ThermoFisher Scientific). Primary antibodies were detected with biotin-conjugated secondary antibodies and DAB substrate on peroxidase based system (Vectastain Elite ABC, Vector Labs). For immunofluorescence Alexa-488, Alexa-594, Alexa-633 and Alexa-647 conjugated anti-rabbit or anti-mouse secondary (Life, all 1:500) were used. Nuclei were costained with DAPI (Life, 1 μg/ml) or Hoechst 33342 (Life, 1 μg/ml).
Immunocytochemistry
Sorted cell populations were treated as described in12. In brief, they were either cytospinned on charged microscope slides with Shandon Cytospin 4 (ThermoFisher) 3 min 800 rpm or let to settle on Poly-L-Lysine coated coverglass bottom MatTek-dishes for 15 min +37 °C followed by fixation with 4% PFA and immunostaining. Antibodies: Lysozyme (DAKO, EC3.2.1.17, 1:500), Muc2 (SantaCruz,H-300, 1:50), counterstains: Hoechst 33342 (Life, 1 μg/ml), Phalloidin-647 (Life, 1:50).
Quantification of nuclear beta-Catenin localization
3 μm thick confocal sections of beta-Catenin stained ileal segments were captured with Leica SP5IIHCS confocal microscope and 63x Water immersion objective and 12bit image color depth. Blinded investigator measured beta catenin mean fluorescent intensity from 3 nuclear ROIs of cells in Transit-Amplifying (TA) zone (cell position +6 and above relative to crypt bottom) followed by measurement of intensities in the nucleus of CBC and Paneth cells (identified by nuclear morphology and cellular shape). CBC and Paneth cells nuclear intensities were always normalized to TA-cells from the same image.
RNA in situ hybridization
RNA in situ hybridization was performed with RNAScope® 2.5HD Assay – Brown according to manufacturer’s protocol (RNAScope® ACDBio). Probes used:
Mouse Notum: Mm-Notum 428981
Mouse (positive control) Lgr5: Mm-Lgr5 312178
Human NOTUM: Hs-NOTUM 430311
Human UBC (positive control): Hs-UBC 310041
Dapb (negative control): Probe-DapB 310043
Of note, human NOTUM was only detected from samples freshly fixed in 4% PFA followed by paraffin embedding. Pathological samples fixed in 10% NBF did not work with this probe.
Statistical analysis
No statistical method was used to calculate the sample size. For analysis of in vitro organoid cultures investigators were blinded when possible, but due to features of co-culture experiments this was not always possible. Blinded investigator performed all histological quantification. Microsoft Excel 16.16.8 and Graphpad Prism 8.0.0 were used for statistical analysis and visualization of data. All data were analysed by two-tailed Student’s t-test, except RNA-sequencing data (see: RNA sequencing and data processing), exact P-values are represented in the corresponding figures. Paired t-test was applied if the day of organoid growth quantification varied between pairs (samples processed the same day were paired) or phenotype after treatment was compared to the control of the same animal (samples from the same animal were paired). Whether test was paired or unpaired is noted in the figure legends. P-values < 0.05 were considered significant.
Human biopsy samples
Normal human ileal and colon tissue biopsies were obtained from 24 healthy subjects that were undergoing a routine colonoscopy. Human jejunal samples were obtained from patients undergoing Roux en-Y gastric bypass surgery and fixed in 4% PFA before routine paraffin embedding protocol. The specimens used for organoid functional assay were stored in normal saline on ice until analysis. Exclusion criteria included any history of malignancy, chronic liver disease, history suggesting a malabsorption disorder, previous intestinal surgery, renal disease, bleeding disorder that would preclude biopsy, active infection, or systemic inflammatory disorder. The study regarding relevant samples and associated ethical regulations were approved by the institutional review board of Massachusetts General Hospital (Boston, Massachusetts) and Helsinki University Hospital. Written and informed consent was obtained prior to enrolment.
Animals
Lgr5-EGFP-IRES-creERT2 mice1 were held in C57BL/6J background. Rosa26(mTmG) (JAX 007576), Tsc1(fl/fl) (Tsc1tm1Djk/J, JAX 005680), Rosa26(LSL-ZsGreen) (JAX 007906), Rosa26(LSL-TdTomato) (JAX 007909), Rag2(−/−) (B6(Cg)-Rag2tm1.1Cgn/J, JAX 008449) and Rosa26(LSL-Cas9EGFP) (JAX 024857) mice were obtained from Jackson Laboratories and were mixed background. Villin-CreERT2 was a gift from Sylvie Robine and was previously described in28. All animal housing and experiments were done under local institutional regulations. Animals were allocated to experimental groups randomly, but without proper randomization. Investigators were not blinded due to apparent phenotype of aged animals. For in vivo proliferation analysis, 10 mg/kg of EdU (Sigma) in PBS was injected i.p. 2 hours prior sacrifice. For in vivo Tsc1 deletion, Villin-CreERT2;Tsc1(fl/fl) mice were given 5 i.p. injections of 100 mg/kg Tamoxifen (Sigma) on alternative days. Rapamycin treatment was performed as described previously12. ABC99 was produced as described previously31. 33,3 mg/ml stock solution in ethanol was prepared freshly and further mixed 1:1:1:17 into Tween-80 (Sigma), PEG-400 (HamiltonResearch) and 0,9% NaCl respectively. Mice were injected 10 mg/kg i.p. daily having the last dose 2h before sacrifice together with 10 mg/kg of EdU. Control mice were treated with vehicle or equal amount of inactive control compound ABC10131. 5-Fluorouracil (Sigma) was reconstituted in DMSO 100 mg/ml and single i.p. injection was given to mice with a dose of 100 – 200 mg/kg (as marked in figure legends). Mice over 24 months of age were considered old and between 3 to 9 months of age were young (denoted “O” and “Y” respectively throughout the figure legends). Except in Fig. 3f,g Extended Data Fig. 9a,b and Supplemental Data Figure 2, where old mice were 20–22 months of age. Both sexes were used in all experiments. All animal experiments were approved and carried out in accordance with the guidelines of the Finnish national animal experimentation board and the Committee on Animal Care at MIT
Organoid transplantation
Notum WT and Notum KO intestinal organoids were generated using Notum (2) guide RNAs, as described above, in Villin-CreERT2;Rosa26(LSL-ZsGreen) and Villin-CreERT2;Rosa26(LSL-tdTomato) intestinal organoids cultured with 4-OHT to generate zsGreen+ WT, zsGreen+ KO, tdTomato+ WT, and tdTomato+ KO organoids. Organoids were grown in Matrigel and cultured with crypt media. Prior to transplantation, ZsGreen+ KO and tdTomato+ WT (and, in parallel, ZsGreen+ WT and tdTomato+ KO) organoids were chemically dissociated using Cell Recovery Solution (Corning, catalogue # 354253), and then resuspended in a 1:1 ratio in 90% crypt media and 10% Matrigel at a concentration of 25 organoids / μl. Organoids were orthotopically transplanted into the colonic submucosa of Rag2(−/−) recipient mice, as previously described52,53. The average volume of each injection was 60 μl. Eight weeks later, engrafted organoids were assessed using fluorescence colonoscopy followed by fluorescence microscopy using GFP and tdTomato filters. Tissues were then fixed in 4% paraformaldehyde for 4–6 hours, cryopreserved with 30% sucrose in PBS overnight, and then frozen in OCT. Frozen tissue section were stained with DAPI to visualize nuclei, and then imaged for tdTomato and GFP. The total number of tdTomato+ and GFP+ cells per mouse was then counted using Fiji.
Extended Data
Extended Data Figure 1.
Characterization of aged intestine
a, Organoid forming capacity of crypts from young and old mice (n=4 animals per group). Student’s paired t-test. b, Frequency of organoids unable to form new crypts (fission deficiency) in young and old mice (n=6 animals per group) analysed 5–9 days after isolation. Student’s paired t-test. c, Distribution of regenerative growth capacity of primary organoids from young and old mice (n=6 animals per group). d, Regenerative growth of subcultured secondary mouse organoids (n=6 animals per group). Student’s paired t-test. e, Distribution of regenerative growth capacity of subcultured secondary organoids from old and young mice (n=6 animals per group). f, Representative Hematoxylin&Eosin staining of mouse jejunal sections from young and old animals (4 animals analysed per group). g, Quantification of EdU+ cells in jejunal crypts 2h post administration. Only cells next to Lysozyme+ Paneth cells were quantified as crypt base columnar (CBC) stem cells. Crypt cells that were not touching Lysozyme+ cells were quantified as transit-amplifying (TA) cells (n=5 animals per group). Representative image of crypt stained for EdU (cyan), DAPI (nuclei, blue), Lysozyme (white), and E-cadherin (red). Scale bar 20 μm. h, Quantification of Ki67+ cells in human ileal biopsies. Cells at the crypt bottom with elongated nuclei next to postmitotic Paneth cells were counted as CBCs. Cells not at the crypt base were considered TA-cells. (n=6 for 20–25 years old donors, n=10 for ≥75 years old donors). i, Representative gating of Lgr5hi, Lgr5med, Lgr5lo, Paneth and Enteroendocrine cells (in relation to Fig. 1c). Quantification of enteroendocrine cells (n=30 young, n=26 old). For FACS gating strategy, see Supplemental Data 1. j, Analysis of human ileal biopsy material for Lysozyme+ Paneth cells (n-values for analysed samples shown). k, Immunostaining and quantification of Olfm4+ stem and progenitor cells (green background, n=75 crypts from young and old. 5 individuals per age group) and Lysozyme+ Paneth cells in jejunal crypts (red background, n=115 crypts from young and n=117 crypts from old mice, 5 individuals per age group). Whiskers plotted according to Tuckey’s method. Scale bars 10μm. l, Ratio of Lgr5hi stem cells and Lgr5med progenitor cells and ratio of Lgr5hi stem cells and Paneth cells analyzed by flow cytometry from isolated crypts (n=30 young, n=26 old). Whiskers plotted according to Tuckey’s method. m, Regenerative growth of young Lgr5hi stem cells co-cultured with young or old Paneth cells. Quantification at Day 8–11. (n=6). Representative images are from day 8. Scale bar 100μm, Student’s paired t-test. n, Long-term clonogenicity of young and old Lgr5hi stem cells co-cultured with young and old Paneth cells. Serially passaged organoids were quantified 21 days after initial plating (n=14 animals per age group). Combinations compared to average of young Lgr5hi cells co-cultured with young and old Paneth cells. o, 14 day co-culture of Paneth cells from tdTomato expressing mouse (R26-mTmG) with Lgr5hi stem cells from Lgr5-EGFP-IRES-CreERT2 mouse show long term niche-interactions in organoid culture. Scale bar 100μm. Similar results seen in 3 replicate wells from cocultures of the same mice. Y = mice between 3 and 9 months of age, O = mice over 24 months of age in all experiments. Unless otherwise indicated, line at Box-and-Whisker -plots represents median, box interquartile range and whiskers range. All other data are represented as mean +/− s.d. and conditions compared with two-tailed unpaired Student’s t-test, exact P-values shown in corresponding panels. P-values < 0.05 were considered significant.
Extended Data Figure 2.
Characterization of gene expression in old Paneth and ISCs
a, Venn-diagram of gene expression changes in old Paneth cells. (n=5 animals in old, n=4 animals in young) b, List of Gene Ontology (GO) terms with the highest enrichment among genes deregulated in old Paneth cells, Fisher’s exact test, no correction for multiple testing. c, Expression of stem cell maintaining factors Wnt3, Egf, and of Notum and Bst-1 in old Paneth cells (RNA-seq). Values show fold change in comparison to young Paneth cells. (n=5 animals in old, n=4 animals in young). d, Gene editing of Bst-1 confirmed by PCR strategy with primers flanking the editing site (191bp product) and hitting the edited site (89bp product). Representative agarose gel image is shown. Experiment repeated once to validate the organoid line used in Extended Data Fig. 2e. e, Regenerative growth of Bst-1 KO intestinal organoids. Organoids were quantified 2 days after subculturing (n=5 repeated experiments with the same organoid line). f, Venn-diagram of gene expression changes in old Lgr5hi stem cells. GSEA preranked analysis of old versus young Lgr5hi stem cells for the gene list “KEGG WNT SIGNALING PATHWAY”. Nominal P-value is shown. (n=3 animals per age group). g, RNA-scope for NOTUM mRNA (brown) in human jejunal section. Expression seen exclusively in Paneth cells (arrowheads and inset). Experiment repeated twice with similar results in independent samples. h, Expression of human NOTUM and LGR5 from terminal ileal samples of GTEx Consortium (n=51 sex matched samples). Expression range is divided to three equal-sized tertiles. Unless otherwise indicated, line at Box-and-Whisker -plots represents median, box interquartile range and whiskers range. All other data are represented as mean +/− s.d. and conditions compared with two-tailed unpaired Student’s t-test, exact P-values shown in corresponding panels. P-values < 0.05 were considered significant. For gel source data see Supplementary Fig. 3.
Extended Data Figure 3.
Wnt -ligands increase ISCs regenerative capacity
a, Distribution of organoid size on Day 5 in ENR + 100 ng/ml Wnt3A +/− 1μg/ml recombinant Notum (n=50 organoids for Notum treated (red), n=38 organoids for untreated (black)). b, Area of colonies from sorted Lgr5hi stem cells from young and old animals (n=3 animals per age group). Area quantified at Day 7. c, Organoid forming capacity of crypts from young and old mice treated with +/− 100ng/ml Wnt3A. Starting frequency was quantified on Day 2 and is represented relative to untreated control (n=10 animals per age group). d, Primary and secondary regenerative growth of young and old organoids treated +/− 100ng/ml Wnt3A for the first 2 days of culture. Primary organoids were quantified at Day 6 and secondary organoids 2 days after subculturing. Data is represented relative to untreated control (n=9 animals per age group). e, Organoid forming capacity of isolated crypts from young mice treated with +/− 1 μg/ml of recombinant Notum (n=3 animals). f, Primary regenerative growth of organoids from young mice treated with +/− 1 μg/ml of recombinant Notum quantified on Day 6 (n=3 animals). g, Secondary regenerative growth of organoids from young mice treated with +/− 1 μg/ml of recombinant Notum, quantified on Day 2 after subculture (n=3 animals). h, Organoid forming capacity of isolated crypts at Day 2 from young mice treated with Porcupine inhibitor IWP-2 (n=3 animals). i, Primary regenerative growth of organoids treated with IWP-2 for the first 2 days of culture. Organoids were quantified on Day 6 (n=3 animals). j, Flow cytometry analysis of cellular frequencies from Lgr5-EGFP organoids 2 days after treatment with IWP-2 (n=4 animals). Y = mice between 3 and 9 months of age, O = mice over 24 months of age in all experiments. Unless otherwise indicated, line at Box-and-Whisker -plots represents median, box interquartile range and whiskers range. All other data are represented as mean +/− s.d. and conditions compared with two-tailed unpaired Student’s t-test, exact P-values shown in corresponding panels. P-values < 0.05 were considered significant.
Extended Data Figure 4.
Increased mTORC1 activity in old Paneth cells, but not in ISCs
a, GSEA analysis for gene list “HALLMARK MTORC1” (for statistics, see RNA sequencing and data processing). Nominal P-value is shown (n=5 animals in old, n=4 animals in young). b, Immunohistochemical staining of pS6 (ser240/244) at mouse jejunal crypt. pS6 positive Paneth cells at the crypt bottom are separated by pS6 negative CBCs. Scale bar 25 μm. Experiment was repeated in total for 14 animals with similar results c, Quantification of pS6+ cells in jejunal crypts (n=7 animals per age group). TA: transit-amplifying progenitor cell. d, Isolated Paneth cells from young and old animals stained with pS6 (red) antibody, DAPI (nuclei, blue). Scale bar 10 μm. Representative image from 2 independent experiments. e, Immunofluorescent image of isolated crypt stained with pS6 antibody (red), Lgr5-EGFP (green) and DAPI (nuclei,blue). Scale bar 10 μm. Representative of 2 independent experiments. Immunoblots of pS6 and pS6K from isolated crypts of young and old mice, and densitometric quantification (ratio to actin) (n=14 animals per age group). An outlier (red) deviating > 2 s.d. was removed from the analysis. Mean +/− s.d. f, Isolated Lgr5hi stem cells (EGFP,green) from young and old animals stained with pS6 (red) antibody, phalloidin (F-actin, white), DAPI (nuclei,blue). Cells were distributed to pS6hi (cells with higher than mean pS6 intensity) or pS6lo (lower than mean pS6 intensity) categories. (n=3 independent experiments), mean +/− s.d. g, Distribution of pS6 intensity in isolated Lgr5hi cells from young and old animals (n=3 animals per age group, number of cells analyzed shown above the corresponding box and whisker plots). h, Mouse weights (n=25 for young female, n=26 for old female, n=20 for young male, n=19 for old male). Whiskers plotted according to Tuckey’s method. Y = mice between 3 and 9 months of age, O = mice over 24 months of age in all experiments. Unless otherwise indicated, line at Box-and-Whisker -plots represents median, box interquartile range and whiskers range. All other data are represented as mean +/− s.d. and conditions compared with two-tailed unpaired Student’s t-test, exact P-values shown in corresponding panels. P-values < 0.05 were considered significant. For gel source data see Supplementary Fig. 3.
Extended Data Figure 5.
Inhibiting mTORC1 activity in old mice restores intestinal regenerative capacity
a, Organoid forming capacity and survival of subcultured intestinal organoids treated with rapamycin. Crypts were either treated continuously for 4 days (2nM), or with a 2 days pulse (2nM pulse, 10nM pulse) followed by 2 days in normal media before subculturing and quantification (n=3). b, Regenerative growth of organoids from young and old mice treated with 2nM rapamycin for 2 days ex vivo. Crypt number was scored 6–7 days after treatment from secondary subcultures (2 days after passage) (n=5 animals per age group). Student’s paired t-test. Representative images are from subcultures on Day 2. Scale bar 100 μm. c, Weight of animals receiving daily injections of rapamycin (4 mg/kg) or vehicle (n=5 animals per group). Daily data points represent median (circles) and interquartile range (dashed line). d, Immunoblots of pS6 from isolated crypts of vehicle (V) or rapamycin (R) treated young and old mice t (n=4 animals per group). e, Organoid forming capacity of isolated crypts from old mice treated with vehicle or rapamycin (n=4 animals per group) f, Primary regenerative growth of organoids from old mice treated with vehicle or rapamycin (n=4 animals per group) g, Organoid forming capacity of young Lgr5hi stem cells co-cultured with Paneth cells isolated from young or old mice treated with vehicle or rapamycin (n=4 animals per group). Combinations compared to average of co-cultures with young vehicle and old rapamycin treated Paneth cells. h, Clonogenic growth of Lgr5hi stem cells from young or old mice treated with vehicle or rapamycin (n=4 animals per group), colonies quantified at Day7. i, qPCR analysis of relative Wnt2b, Wnt5a, Wnt4, Wnt3 and Lgr5 expression from full jejunal samples of old mice treated with rapamycin. Values show Log2 fold change in comparison to old vehicle treated (n-values of mice analysed shown). Mean +/− s.e.m. j, qPCR analysis of relative Notum and Bst-1 expression from crypts of old mice treated with rapamycin. Values show Log2 fold change in comparison to old vehicle treated (n=3 animals per group). Mean +/− s.e.m. k, Immunoblots of pS6, S6 and H3 from isolated Epcam+ cells of wild type (Tsc1WT) and Tsc1 knockout (Tsc1Δ) epithelium (n=3 animals per group). l, Quantification of RNA-scope for Notum mRNA in wild type (Tsc1WT) and Tsc1 knockout (Tsc1Δ) ileal crypts (n=6 animals for Tsc1WT and 5 animals for Tsc1Δ). An outlier (red) deviating > 2 s.d was removed from the analysis. Representative images of crypts used in quantifications with Notum mRNA (brown) in Paneth cells (inset). m, Organoid forming capacity of isolated crypts from wild type (Tsc1WT) and Tsc1 knockout (Tsc1Δ) epithelium, quantification was done on Day 8. Y = mice between 3 and 9 months of age, O = mice over 24 months of age in all experiments. Unless otherwise indicated, line at Box-and-Whisker -plots represents median, box interquartile range and whiskers range. All other data are represented as mean +/− s.d. and conditions compared with two-tailed unpaired Student’s t-test, exact P-values shown in corresponding panels. P-values < 0.05 were considered significant. For gel source data see Supplementary Fig. 3.
Extended Data Figure 6.
Decreased PPAR-activity in aged intestine
a, GSEA analysis for “BIOCARTA PPARa” and “PPARd” gene sets (for statistics, see RNA sequencing and data processing). Nominal P-value is shown (n=5 animals in old, n=4 animals in young). b, Schematic image of the putative PPARa binding site on the mouse and human Notum genes found with DECODE. Mouse sequence shown. Lower panel, score for the discovered site using JASPAR matrix models for mouse PPAR Response element (PPRE). PPARG;RXRA -motif was used. c, FACS analysis of cell populations in primary organoids treated for 3 days with DMSO, CHIR99021 or GW6471 (n=6 animals for DMSO, n=5 animals for CHIR99021 and GW6471). Ratios of Lgr5hi to Paneth cells, and Lgr5hi to Lgr5lo cells from the same analysis. Mean CD24 expression of live Epcam+ cells are also shown. d, Representative images of mouse intestinal organoids treated for 4 days with DMSO, 5 μM GW6471 or with 5 μM GW6471 + 100 ng/ml Wnt3A. Arrowheads indicate surviving and red asterisks collapsed organoids. Scale bar 100 μm. Experiment was repeated 4 times with similar results. Unless otherwise indicated, all data are represented as mean +/− s.d. and conditions are compared with two-tailed unpaired Student’s t-test, exact P-values shown in corresponding panels. P-values < 0.05 were considered significant.
Extended Data Figure 7.
Notum regulates intestinal stem cell function
a, Notum gene targeting. Schematic represents sites of genome editing. Gene editing was confirmed by PCR strategy with primers flanking the editing site (174bp product for Notum KO1 and 294bp product for Notum KO2) and hitting the edited site (84bp product for Notum KO1 and 188bp product for Notum KO2). Representative agarose gel images from two independent experiments with similar results are shown. b, Regenerative growth of Notum KO organoids. De novo crypt domains were quantified 2 days after subculture (n=5 repeated experiments with the same organoid lines). Representative images of organoids 2 days after subculture are shown, scale bar 100 μm. c, Schematic presenting in vivo competition assay of gene-edited organoid growth by orthotopic transplantation to immunodeficient Rag2(−/−) mice. Representative colonoscopy, necroscopy and histology images used for assay quantification (n=8 mice transplanted). Scale bars 1mm for necroscopy and 200μm for histology images. d, Representative images of CRISPR-targeted young and old organoids 2 days after subculturing (n=4 animals per group) Scale bar 100 μm. e, Relative Notum expression in organoids with SAM complex targeted to Notum promoter (dA Notum) grown 2 days in ENR media. Three independent experiments relative to control (dA Tom). f, Quantification and representative images of Day 5 colonies formed by isolated CD24medSSClo cells from Notum activator (dA Notum) and control (dA Tom) organoids, scale bar 100 μm (n=4 repeated experiments with the same organoid line). g, qPCR analysis of relative Axin2 and Lgr5 expression in CD24medSSClo cells sorted from Notum activator (dA Notum) organoids. Values show Log2 fold change in comparison to control (dATom) (n=3 replicate wells per organoid line). Unless otherwise indicated, line at Box-and-Whisker -plots represents median, box interquartile range and whiskers range. All other data are represented as mean +/− s.e.m. and conditions compared with two-tailed unpaired Student’s t-test, exact P-values shown in corresponding panels. P-values < 0.05 were considered significant. For gel source data see Supplementary Fig. 3.
Extended Data Figure 8.
Notum inhibitor ABC99 prevents Wnt-inactivation
a, Flow cytometry analysis of cell populations in primary organoids treated for 8 days with 500nM ABC99 (n=3 mice) Relative to DMSO control. Student’s paired t-test. b, Clonogenic growth of Lgr5hi stem cells on Day 5 treated with +/− 50nM ABC99 and +/− 500ng/ml recombinant Notum (2 independent experiments with similar results, one experiment with 3 replicate wells shown). c, Relative weight of animals treated with daily injections of ABC99 (10mg/kg) or control (vehicle or ABC101 10mg/kg) (n=10 mice for young control and young ABC99, n=8 mice for old control and n=9 mice for old ABC99). Daily data points represent median (circles) and interquartile range (dashed line). d, Clonogenic growth of young Lgr5hi stem cells co-cultured with young or old Paneth cells from +/− ABC99 treated mice (n-values for analysed mice shown). Combinations compared to average of co-cultures with young control (−) and old ABC treated (+) Paneth cells. e, Representative image of immunofluorescent staining of ileal crypts used for quantification of nuclear β-Catenin (white) intensity. Paneth cells (red arrowheads) and CBC (green arrowheads) were identified by cellular and nuclear (DAPI,blue) morphology. Their nuclear beta-catenin levels were compared to transit-amplifying (TA) cells (white arrowheads). Scale bar 20μm. (Experiment was repeated twice with total of 26 mice all showing strongest nuclear beta-catenin at the crypt bottom) f, Immunofluorescent staining of histological sections from old ileum. β-Catenin (white), Lysozyme (red) and DAPI (nuclei, blue). Scale bar 10μm. Quantification of relative nuclear β-Catenin intensity of Paneth cells (red arrowhead) (n-values for analysed mice shown). For quantification of CBCs (green arrowhead) see Fig. 3d. g, Immunofluorescent staining of histological sections from old ileum. Olfm4 (green), EdU (red) and DAPI (nuclei, blue). Scale bar 20μm. Quantification of EdU+ cellular frequencies within the crypt (n-values for analysed mice shown). Y = mice between 3 and 9 months of age, O = mice over 24 months of age in all experiments. Unless otherwise indicated, line at Box-and-Whisker -plots represents median, box interquartile range and whiskers range. All other data are represented as mean +/− s.d. and conditions compared with two-tailed unpaired Student’s t-test, exact P-values shown in corresponding panels. P-values < 0.05 were considered significant.
Extended Data Figure 9.
Old intestine recovers poorly from 5-FU induced damage
a, Body weights of young and old mice following single injection of 5-Fluorouracil (5-FU, 100–200mg/kg). Two mice per group, body weight relative to day of injection (Day 0). b, Relative body weight of young and old mice treated 1 week with +/− ABC99 followed by single 5-Fluorouracil (5-FU, 100mg/kg) injection (n=8 mice for young vehicle, old vehicle and young ABC99 treated, n=10 mice for old ABC99 treated). Daily data points represent median (circles) and interquartile range (dashed line). Daily weight of Old ABC99 treated animals were compared to Old controls with two-tailed unpaired Student’s t-test, exact P-values shown under the corresponding daily weight. P-values < 0.05 were considered significant. Young mice between 3 and 4 months of age, Old mice over 20 months of age.
Supplementary Material
ACKNOWLEDGEMENTS
This study was supported by the Academy of Finland (Research Fellow, and Centre of Excellence, MetaStem), Marie Curie CIG (618774), Sigrid Juselius Foundation, Center for Innovative Medicine, and Wallenberg Academy Fellows program to P.K.. N.P. was supported by the Integrative Life Science Doctoral program and by the Research foundation of University of Helsinki. We thank the personnel of the DNA sequencing and genomics laboratory for performing the RNA sequencing assays. We thank Jenny Bärlund, Agustin Sola-Carvajal, Maija Simula and Andreas Kegel for technical assistance.
Footnotes
DATA AVAILABILITY
RNA sequencing data is publicly available through ArrayExpress (http://www.ebi.ac.uk/arrayexpress/experiments/E-MTAΒ−7916). Source Data for Figs. 1–3 and Extended Data Figs. 1–9 are available with the online version of the paper. All other data are available from the corresponding author upon reasonable request.
COMPETING FINANCIAL INTERESTS
The authors declare no competing financial interests.
REFERENCES
- 1.Barker N. et al. Identification of stem cells in small intestine and colon by marker gene Lgr5. Nature 449, 1003–1007 (2007). [DOI] [PubMed] [Google Scholar]
- 2.Sato T. et al. Paneth cells constitute the niche for Lgr5 stem cells in intestinal crypts. Nature 469, 415–418, doi: 10.1038/nature09637 (2011). [DOI] [PMC free article] [PubMed] [Google Scholar]
- 3.Sengupta S, Peterson TR, Laplante M, Oh S. & Sabatini DM mTORC1 controls fasting-induced ketogenesis and its modulation by ageing. Nature 468, 1100–1104, doi:nature09584 [pii] 10.1038/nature09584 (2010). [DOI] [PubMed] [Google Scholar]
- 4.Molofsky AV et al. Increasing p16INK4a expression decreases forebrain progenitors and neurogenesis during ageing. Nature 443, 448–452, doi:nature05091 [pii] 10.1038/nature05091 (2006). [DOI] [PMC free article] [PubMed] [Google Scholar]
- 5.Rossi DJ et al. Deficiencies in DNA damage repair limit the function of haematopoietic stem cells with age. Nature 447, 725–729, doi:nature05862 [pii] 10.1038/nature05862 (2007). [DOI] [PubMed] [Google Scholar]
- 6.Conboy IM & Rando TA Heterochronic parabiosis for the study of the effects of aging on stem cells and their niches. Cell Cycle 11, 2260–2267, doi: 10.4161/cc.20437 (2012). [DOI] [PMC free article] [PubMed] [Google Scholar]
- 7.Sato T. et al. Single Lgr5 stem cells build crypt-villus structures in vitro without a mesenchymal niche. Nature 459, 262–265, doi: 10.1038/nature07935 (2009). [DOI] [PubMed] [Google Scholar]
- 8.Warren PM, Pepperman MA & Montgomery RD Age changes in small-intestinal mucosa. Lancet 2, 849–850 (1978). [DOI] [PubMed] [Google Scholar]
- 9.Feibusch JM & Holt PR Impaired absorptive capacity for carbohydrate in the aging human. Dig Dis Sci 27, 1095–1100 (1982). [DOI] [PubMed] [Google Scholar]
- 10.Feldman M, Cryer B, McArthur KE, Huet BA & Lee E. Effects of aging and gastritis on gastric acid and pepsin secretion in humans: a prospective study. Gastroenterology 110, 1043–1052 (1996). [DOI] [PubMed] [Google Scholar]
- 11.Potten CS, Martin K. & Kirkwood TB Ageing of murine small intestinal stem cells. Novartis Found Symp 235, 66–79; discussion 79–84, 101–104 (2001). [DOI] [PubMed] [Google Scholar]
- 12.Yilmaz OH et al. mTORC1 in the Paneth cell niche couples intestinal stem-cell function to calorie intake. Nature 486, 490–495, doi: 10.1038/nature11163 (2012). [DOI] [PMC free article] [PubMed] [Google Scholar]
- 13.Nalapareddy K. et al. Canonical Wnt Signaling Ameliorates Aging of Intestinal Stem Cells. Cell reports 18, 2608–2621, doi: 10.1016/j.celrep.2017.02.056 (2017). [DOI] [PMC free article] [PubMed] [Google Scholar]
- 14.Mihaylova MM et al. Fasting Activates Fatty Acid Oxidation to Enhance Intestinal Stem Cell Function during Homeostasis and Aging. Cell Stem Cell 22, 769–778 e764, doi: 10.1016/j.stem.2018.04.001 (2018). [DOI] [PMC free article] [PubMed] [Google Scholar]
- 15.Shalem O. et al. Genome-scale CRISPR-Cas9 knockout screening in human cells. Science 343, 84–87, doi: 10.1126/science.1247005 (2014). [DOI] [PMC free article] [PubMed] [Google Scholar]
- 16.Giraldez AJ, Copley RR & Cohen SM HSPG modification by the secreted enzyme Notum shapes the Wingless morphogen gradient. Dev Cell 2, 667–676 (2002). [DOI] [PubMed] [Google Scholar]
- 17.Kakugawa S. et al. Notum deacylates Wnt proteins to suppress signalling activity. Nature 519, 187–192, doi: 10.1038/nature14259 (2015). [DOI] [PMC free article] [PubMed] [Google Scholar]
- 18.Shoshkes-Carmel M. et al. Subepithelial telocytes are an important source of Wnts that supports intestinal crypts. Nature 557, 242–246, doi: 10.1038/s41586-018-0084-4 (2018). [DOI] [PMC free article] [PubMed] [Google Scholar]
- 19.Degirmenci B, Valenta T, Dimitrieva S, Hausmann G. & Basler K. GLI1-expressing mesenchymal cells form the essential Wnt-secreting niche for colon stem cells. Nature 558, 449–453, doi: 10.1038/s41586-018-0190-3 (2018). [DOI] [PubMed] [Google Scholar]
- 20.Farin HF, Van Es JH & Clevers H. Redundant sources of Wnt regulate intestinal stem cells and promote formation of Paneth cells. Gastroenterology 143, 1518–1529 e1517, doi: 10.1053/j.gastro.2012.08.031 (2012). [DOI] [PubMed] [Google Scholar]
- 21.Farin HF et al. Visualization of a short-range Wnt gradient in the intestinal stem-cell niche. Nature 530, 340–343, doi: 10.1038/nature16937 (2016). [DOI] [PubMed] [Google Scholar]
- 22.Chen B. et al. Small molecule-mediated disruption of Wnt-dependent signaling in tissue regeneration and cancer. Nat Chem Biol 5, 100–107, doi: 10.1038/nchembio.137 (2009). [DOI] [PMC free article] [PubMed] [Google Scholar]
- 23.McCay CM, Maynard LA, Sperling G. & Barnes LL The Journal of Nutrition. Volume 18 July--December, 1939. Pages 1−−13. Retarded growth, life span, ultimate body size and age changes in the albino rat after feeding diets restricted in calories. Nutr Rev 33, 241–243 (1975). [DOI] [PubMed] [Google Scholar]
- 24.Harrison DE et al. Rapamycin fed late in life extends lifespan in genetically heterogeneous mice. Nature 460, 392–395, doi:nature08221 [pii] 10.1038/nature08221 (2009). [DOI] [PMC free article] [PubMed] [Google Scholar]
- 25.Lamming DW et al. Rapamycin-induced insulin resistance is mediated by mTORC2 loss and uncoupled from longevity. Science 335, 1638–1643, doi: 10.1126/science.1215135 (2012). [DOI] [PMC free article] [PubMed] [Google Scholar]
- 26.Wilkinson JE et al. Rapamycin Slows Aging in Mice. Aging Cell, doi: 10.1111/j.14749726.2012.00832.x (2012). [DOI] [PMC free article] [PubMed] [Google Scholar]
- 27.Naillat F. et al. Identification of the genes regulated by Wnt-4, a critical signal for commitment of the ovary. Exp Cell Res 332, 163–178, doi: 10.1016/j.yexcr.2015.01.010 (2015). [DOI] [PubMed] [Google Scholar]
- 28.el Marjou F. et al. Tissue-specific and inducible Cre-mediated recombination in the gut epithelium. Genesis 39, 186–193, doi: 10.1002/gene.20042 (2004). [DOI] [PubMed] [Google Scholar]
- 29.Kwiatkowski DJ et al. A mouse model of TSC1 reveals sex-dependent lethality from liver hemangiomas, and up-regulation of p70S6 kinase activity in Tsc1 null cells. Hum Mol Genet 11, 525–534 (2002). [DOI] [PubMed] [Google Scholar]
- 30.Konermann S. et al. Genome-scale transcriptional activation by an engineered CRISPR-Cas9 complex. Nature 517, 583–588, doi: 10.1038/nature14136 (2015). [DOI] [PMC free article] [PubMed] [Google Scholar]
- 31.Suciu RM, Cognetta AB, Potter ZE & Cravatt BF Selective Irreversible Inhibitors of the Wnt-Deacylating Enzyme NOTUM Developed by Activity-Based Protein Profiling. ACS Medicinal Chemistry Letters, doi: 10.1021/acsmedchemlett.8b00191 (2018). [DOI] [PMC free article] [PubMed] [Google Scholar]
- 32.Longley DB, Harkin DP & Johnston PG 5-fluorouracil: mechanisms of action and clinical strategies. Nat Rev Cancer 3, 330–338, doi: 10.1038/nrc1074 (2003). [DOI] [PubMed] [Google Scholar]
- 33.Song MK, Park MY & Sung MK 5-Fluorouracil-induced changes of intestinal integrity biomarkers in BALB/c mice. J Cancer Prev 18, 322–329 (2013). [DOI] [PMC free article] [PubMed] [Google Scholar]
- 34.Nusse R. & Clevers H. Wnt/beta-Catenin Signaling, Disease, and Emerging Therapeutic Modalities. Cell 169, 985–999, doi: 10.1016/j.cell.2017.05.016 (2017). [DOI] [PubMed] [Google Scholar]
- 35.Kim TH, Escudero S. & Shivdasani RA Intact function of Lgr5 receptor-expressing intestinal stem cells in the absence of Paneth cells. Proc Natl Acad Sci U S A 109, 3932–3937, doi:1113890109 [pii] 10.1073/pnas.1113890109 (2012). [DOI] [PMC free article] [PubMed] [Google Scholar]
- 36.Zou WY et al. Epithelial WNT Ligands Are Essential Drivers of Intestinal Stem Cell Activation. Cell reports 22, 1003–1015, doi: 10.1016/j.celrep.2017.12.093 (2018). [DOI] [PMC free article] [PubMed] [Google Scholar]
- 37.Kozar S. et al. Continuous clonal labeling reveals small numbers of functional stem cells in intestinal crypts and adenomas. Cell Stem Cell 13, 626–633, doi: 10.1016/j.stem.2013.08.001 (2013). [DOI] [PubMed] [Google Scholar]
- 38.Frey JL et al. Wnt-Lrp5 signaling regulates fatty acid metabolism in the osteoblast. Mol Cell Biol 35, 1979–1991, doi: 10.1128/MCB.01343-14 (2015). [DOI] [PMC free article] [PubMed] [Google Scholar]
- 39.Huels DJ et al. Wnt ligands influence tumour initiation by controlling the number of intestinal stem cells. Nat Commun 9, 1132, doi: 10.1038/s41467-018-03426-2 (2018). [DOI] [PMC free article] [PubMed] [Google Scholar]
- 40.Beyaz S. et al. High-fat diet enhances stemness and tumorigenicity of intestinal progenitors. Nature 531, 53–58, doi: 10.1038/nature17173 (2016). [DOI] [PMC free article] [PubMed] [Google Scholar]
- 41.Chang S, Goldstein NE & Dharmarajan KV Managing an Older Adult with Cancer: Considerations for Radiation Oncologists. Biomed Res Int 2017, 1695101, doi: 10.1155/2017/1695101 (2017). [DOI] [PMC free article] [PubMed] [Google Scholar]
REFERENCES FOR METHODS
- 42.Sato T. et al. Long-term expansion of epithelial organoids from human colon, adenoma, adenocarcinoma, and Barrett’s epithelium. Gastroenterology 141, 1762–1772, doi: 10.1053/j.gastro.2011.07.050 (2011). [DOI] [PubMed] [Google Scholar]
- 43.Sanjana NE, Shalem O. & Zhang F. Improved vectors and genome-wide libraries for CRISPR screening. Nat Methods 11, 783–784, doi: 10.1038/nmeth.3047 (2014). [DOI] [PMC free article] [PubMed] [Google Scholar]
- 44.Dahlman JE et al. Orthogonal gene knockout and activation with a catalytically active Cas9 nuclease. Nat Biotechnol 33, 1159–1161, doi: 10.1038/nbt.3390 (2015). [DOI] [PMC free article] [PubMed] [Google Scholar]
- 45.Sanchez-Rivera FJ et al. Rapid modelling of cooperating genetic events in cancer through somatic genome editing. Nature 516, 428–431, doi: 10.1038/nature13906 (2014). [DOI] [PMC free article] [PubMed] [Google Scholar]
- 46.Martin M. Cutadapt removes adapter sequences from high-throughput sequencing reads. 2011 17, doi: 10.14806/ej.17.1.200 pp. 10–12 (2011). [DOI] [Google Scholar]
- 47.Dobin A. et al. STAR: ultrafast universal RNA-seq aligner. Bioinformatics 29, 15–21, doi: 10.1093/bioinformatics/bts635 (2013). [DOI] [PMC free article] [PubMed] [Google Scholar]
- 48.Lawrence M. et al. Software for computing and annotating genomic ranges. PLoS Comput Biol 9, e1003118, doi: 10.1371/journal.pcbi.1003118 (2013). [DOI] [PMC free article] [PubMed] [Google Scholar]
- 49.Love MI, Huber W. & Anders S. Moderated estimation of fold change and dispersion for RNA-seq data with DESeq2. Genome Biol 15, 550, doi: 10.1186/s13059-014-0550-8 (2014). [DOI] [PMC free article] [PubMed] [Google Scholar]
- 50.Subramanian A. et al. Gene set enrichment analysis: a knowledge-based approach for interpreting genome-wide expression profiles. Proc Natl Acad Sci U S A 102, 15545–15550, doi: 10.1073/pnas.0506580102 (2005). [DOI] [PMC free article] [PubMed] [Google Scholar]
- 51.Adhikary T. et al. Genomewide analyses define different modes of transcriptional regulation by peroxisome proliferator-activated receptor-beta/delta (PPARbeta/delta). PLoS One 6, e16344, doi: 10.1371/journal.pone.0016344 (2011). [DOI] [PMC free article] [PubMed] [Google Scholar]
- 52.Roper J. et al. Colonoscopy-based colorectal cancer modeling in mice with CRISPR-Cas9 genome editing and organoid transplantation. Nat Protoc 13, 217–234, doi: 10.1038/nprot.2017.136 (2018). [DOI] [PMC free article] [PubMed] [Google Scholar]
- 53.Roper J. et al. In vivo genome editing and organoid transplantation models of colorectal cancer and metastasis. Nat Biotechnol 35, 569–576, doi: 10.1038/nbt.3836 (2017). [DOI] [PMC free article] [PubMed] [Google Scholar]
Associated Data
This section collects any data citations, data availability statements, or supplementary materials included in this article.


