Abstract
Hyperspectral imaging was originally developed for use in remote sensing applications. More recently, it has been applied to biological imaging systems, such as fluorescence microscopes. The ability to distinguish molecules based on spectral differences has been especially advantageous for identifying fluorophores in highly autofluorescent tissues. A key component of hyperspectral imaging systems is wavelength filtering. Each filtering technology used for hyperspectral imaging has corresponding advantages and disadvantages. Recently, a new optical filtering technology has been developed that uses multi-layered thin-film optical filters that can be rotated, with respect to incident light, to control the center wavelength of the pass-band. Compared to the majority of tunable filter technologies, these filters have superior optical performance including greater than 90% transmission, steep spectral edges and high out-of-band blocking. Hence, tunable thin-film optical filters present optical characteristics that may make them well-suited for many biological spectral imaging applications.
An array of tunable thin-film filters was implemented on an inverted fluorescence microscope (TE 2000, Nikon Instruments) to cover the full visible wavelength range. Images of a previously published model, GFP-expressing endothelial cells in the lung, were acquired using a charge-coupled device camera (Rolera EM-C2, Q-Imaging). This model sample presents fluorescently-labeled cells in a highly autofluorescent environment.
Linear unmixing of hyperspectral images indicates that thin-film tunable filters provide equivalent spectral discrimination to our previous acousto-optic tunable filter–based approach, with increased signal-to-noise characteristics. Hence, tunable multi-layered thin film optical filters may provide greatly improved spectral filtering characteristics and therefore enable wider acceptance of hyperspectral widefield microscopy.
Keywords: Hyperspectral imaging, spectral imaging, microscopy, AOTF, acousto-optic tunable filter, TFTF, thin-film tunable filter, VersaChrome
1. INTRODUCTION
Hyperspectral imaging techniques from the remote sensing field have recently been applied fluorescence microscopy.[1] Hyperspectral fluorescence microscopy allows collection of signal from many spectral bands, producing a contiguous spectrum. A key component of hyperspectral imaging is spectral filtering. Recently, tunable filter systems, such as the acousto-optic tunable filter (AOTF)[2,3] and liquid crystal tunable filter (LCTF)[4,5], have been used to collect fluorescence over a wide wavelength range. Percent transmission, wavelength tuning range, out-of-band blocking power, and tuning speed are important considerations for spectral filter technologies. A tunable filter technology that has high percent transmission, high out-of-band blocking power, and a wide wavelength-tuning range would present an ideal filter system for hyperspectral imaging.
Recently, thin-film tunable filters (TFTF) have been developed for hyperspectral imaging with many ideal characteristics for spectral filtering. Thin-film tunable filters have high optical transmission (greater than 90%), sharp edge cut-offs, and high out-of-band optical densities (greater than 6). Wavelength tuning is achieved by varying the angle of incidence.
We have previously reported that AOTF-based hyperspectral microscopy is capable of identifying GFP-expressing cells in highly autofluorescent lung tissue with high sensitivity and high specificity.[2] In this work, we present a comparative study of a TFTF-based system with an AOTF-based system using the GFP-expressing PMVEC model. Our results indicate improved out-of-band rejection and improved identification of GFP-expressing PMVECs in surrounding autofluorescence.
2. MATERIALS AND METHODS
2.1. Cell, animal, and sample preparation
Pulmonary microvascular endothelial cells (PMVECs) were transduced with a lentivirus encoding green fluorescent protein (GFP), as described previously.[2,6] Adult rats were infected intratracheally with P. aeruginosa, then injected intravenously with GFP-positive PMVECs. One week after infection, animals were sacrificed and the most injured lungs removed. Injured lungs were embedded in paraffin, cut into 10-μm slices, and then placed on microscope slides. Select slides were stained with Hoechst-3342 (Invitrogen) to identify nuclei. A slide without GFP or Hoechst was prepared as a tissue control. Confluent monolayers of GFP-positive PMVECs were prepared on round coverslips as controls. PMVECs without GFP and stained with Hoechst were also prepared on round coverslips as controls.
2.2. Hyperspectral microscope set-up, calibration, and spectral correction
Fluorescence imaging was performed on an inverted widefield microscope (TE2000-U, Nikon Instruments) with a 40X-oil immersion objective (S Fluor, 40X/1.30 Oil DIC H/N2, Nikon Instruments). Excitation light was provided by a Xe arc lamp (Lambda DG-4, Sutter Instruments). A 360/40 nm interference filter (D360/40X, Chroma Technology Corp) was used for Hoechst excitation, and a 430/24 nm filter (ET430/24X, Chroma Technology Corp.) was used for GFP and autofluorescence excitation. A long-pass dichroic beamsplitter (FF-458-Di02, Semrock, Inc.) and long-pass fluorescence emission filter (BLP01-458R, Semrock, Inc.) were also utilized to separate emission from the excitation light. Hyperspectral imaging was performed by acquiring an image stack over a wavelength range of 470-700 nm in 5 nm increments. A previously tested[2] acousto-optic tunable filter, or AOTF (His-300, Chromodynamics, Inc.) was connected to the right camera port for spectral filtering, and a charge-couple device (CCD) camera was used for image acquisition (Cascade 512B, Photometrics). A CCD camera (Rolera EM-C2, QImaging) was used for image acquisition for the TFTF system. All spectral measurements were performed over 470-700 nm.
2.3. Thin-Film Tunable Filters
A TFTF system (Fresco™ Semrock Inc.), loaded with five VersaChrome® thin-film tunable filters, was placed in collimated space on the left camera port of the microscope. FilterPalette™ software (Semrock Inc.) was used to select the desired wavelength. Note that each VersaChrome filter has a tuning range of greater than 12% of the normal-incidence wavelength. By varying the angle of incidence from 0 to 60° for each of the five VersaChrome filters, the TFTF system was able to cover the full visible range (400 to 700 nm).
2.4. Filter characterization
A USB spectrometer (QE6500, Ocean Optics, Inc.) was used to characterize the AOTF and TFTF systems. Transmitted light from the brightfield lamp was used as a light source for measuring optical density. A background spectrum was collected and subtracted from all images to correct for stray light. Measurements were taken from 470-700 nm in 5 nm increments for both filter systems.
2.5. Spectral Correction and Image Acquisition
Wavelength-dependent attenuation through the filter systems was measured using a NIST-traceable lamp source. A background spectrum was also measured. Lamp and background spectra were measured from 470-700 nm in 5-nm increments for both tunable filter systems. Images were acquired from confluent monolayers and tissue slides over a wavelength range of 470-700 nm in 5-nm increments. Two spectral scans were performed for each field-of-view, one with 430-nm excitation (autofluorescence and GFP), and one with 360-nm excitation (Hoechst). A background spectrum for each slide was measured and used to subtract stray light from images.
3. RESULTS AND DISCUSSION
3.1. Filter characterization of TFTF and AOTF systems
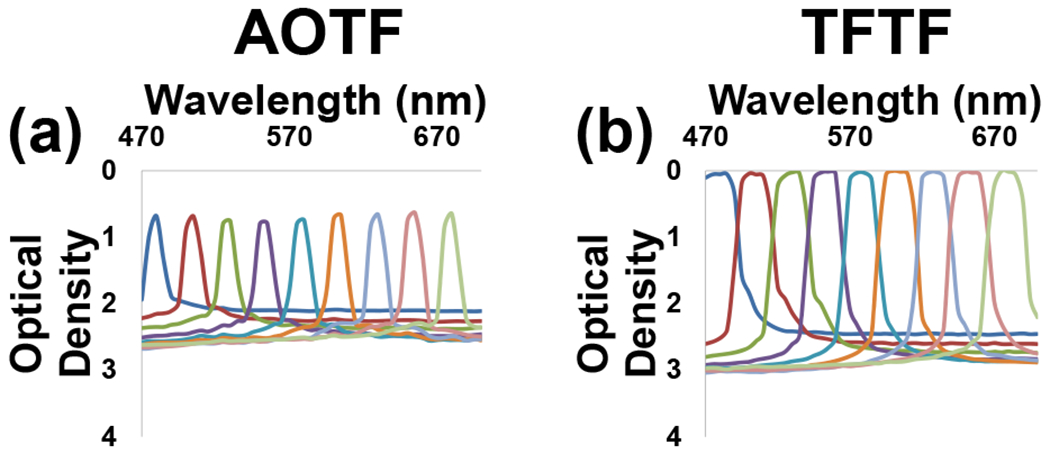
The optical density of the AOTF and TFTF systems were measured using the wide-field fluorescence microscope lamp and a USB spectrometer. Light was collected from 470-700 nm in 5-nm incremented (Figure 1, a–b, selected tuning wavelengths displayed). Lower light transmission was detected by the AOTF system at peak wavelengths (0.8 OD) compared to the TFTF system (0.03 OD). These measurements correspond to about 16% peak transmission for the AOTF system and about 93% peak transmission for the TFTF system. (Transmission = 10−OD). Therefore, the TFTF system may provide better light transmission for applications featuring less available light. The TFTF system also had a higher out-of-band blocking power (2.5-3.0 OD) than the AOTF system (2.00-2.75 OD). The TFTF system actually achieves out-of-band blocking density of 6 or greater, however, limitations in the dynamic range of the USB spectrometer prohibited accurate measurements of the optical density. Additionally, in both of these measurements the long-pass emission/blocking filter (BLP01-458R) is placed in the primary filter cube of the microscope, which already provides very high blocking of unwanted excitation light.
Figure 1:

Optical density plots for the AOTF (a) and TFTF (b) systems. The peaks represent center tuning wavelengths for a particular filter. The AOTF has lower light transmission at the center wavelengths (0.8 OD), and lower optical density for out-of-band wavelengths (2-2.75 OD) than the TFTF. The TFTF has an optical density of 0.03 OD at center wavelengths, and 2.5-3.0 OD for out-of-band wavelengths. Hence, the in-band-to-out-of-band optical density difference for the AOTF is 1.7-2.2 OD, while the TFTF is 2.5-3.0 OD.
3.2. Spectral Correction
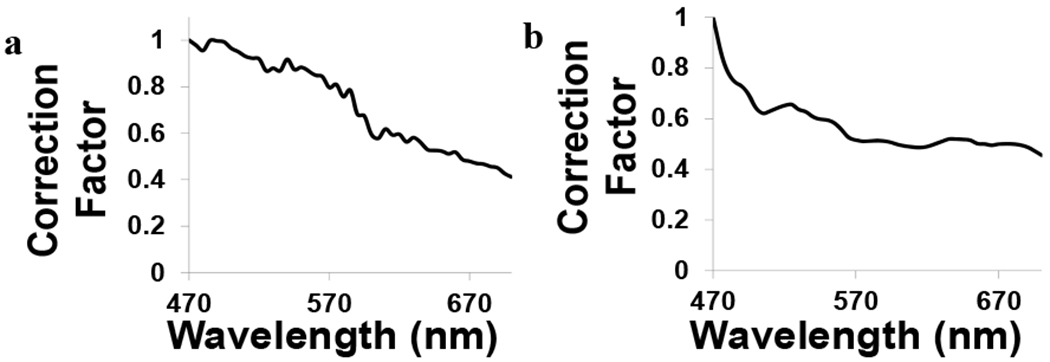
The details of spectral correction are presented in an earlier publication2, and in this section we briefly capture the highlights of this procedure. Images were corrected to account for wavelength-dependent attenuation and sensitivity. A NIST-traceable lamp was measured using the AOTF and TFTF systems. The background spectrum was also measured for the AOTF and TFTF systems. A spectral transfer function was then calculated for both the AOTF and TFTF systems. Light transmission was more efficient at higher wavelengths for both systems, possibly a result of differences in filter bandwidths and the quantum efficiencies of each camera. A correction coefficient was calculated from the inverse of the transfer function to measure how light is attenuated through the AOTF (Figure 2a) and TFTF (Figure 2b) systems. Both systems measured higher light attenuation at lower wavelengths, and lower attenuation at higher wavelengths.
Figure 2:

Correction coefficients for the acousto-optic tunable filter (a) and thin-film tunable filter (b).
3.3. Linear Spectrum Unmixing and Merged Images
GFP-expressing PMVECs, Hoechst-labeled PMVECs, and autofluorescence slides were imaged with both tunable filter systems. Each image was corrected using a correction coefficient2. Using spectral libraries containing emission spectra for GFP, Hoechst, and autofluorescence, each image was linearly unmixed. Each unmixed and corrected image was then false-colored and merged into one image using NIS Elements (NIS Elements 3.2, Nikon Instruments, Inc.) software.
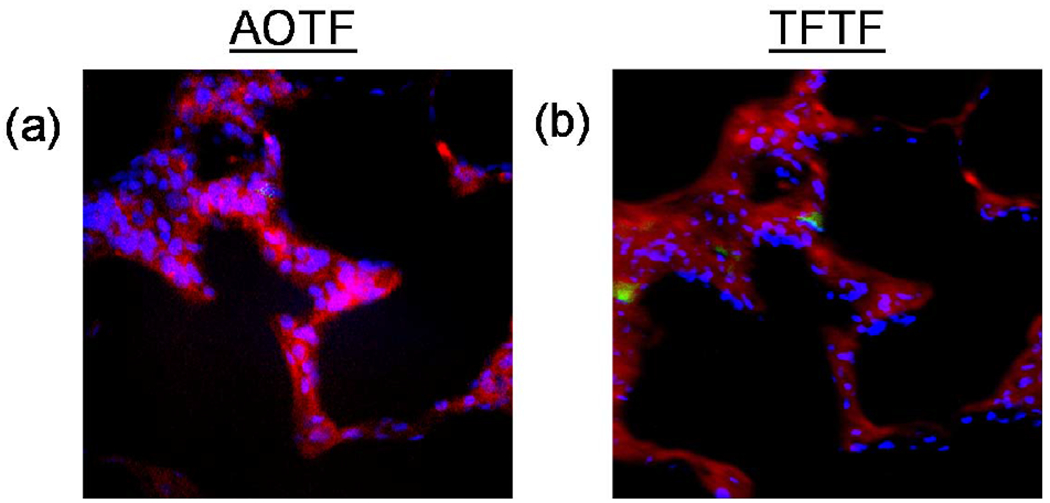
Merged images from the AOTF (Figure 3a) and the TFTF (Figure 3b) show distinct qualitative differences in the filtering systems. Notably, very little GFP was measured with the AOTF system, while the TFTF system easily identified [please note that the AOTF camera does not capture the image of the second cell, along the left edge, due to a smaller field of view] GFP-positive cells. Additionally, the AOTF system did not reproduce the structural features of the lung (autofluorescence) as well as the TFTF system. It should be noted that the AOTF channel utilizes a much higher quantum efficiency EMCCD camera compared to the TFTF channel; however, increased throughput of the TFTF system provides better signal-to-noise characteristics.
Figure 3:

Unmixed images from the AOTF (a) and TFTF (b) were false-colored and merged using Nikon Elements software. Hoechst-stained nuclei were colored blue, GFP-expressing pulmonary microvascular endothelial cells were colored green, and tissue autofluorescence was colored red.
4. FURTHER WORK
Abrupt changes in the overall transmission were observed when switching between adjacent VersaChrome filters of the TFTF system. The presented mathematical model of the system does account for this behavior, enabling desired spectral discrimination in the sample. However, further work with this system will focus on approaches to minimizing the bandwidth variability. Additionally, the thin-film tunable filter system will be utilized to test the efficacy of excitation-scanning with a tunable filter system using the GFP-expressing PMVEC model.
5. ACKNOWLEDGEMENTS
The authors would like to acknowledge support from NIH grant P01 HL066299, the Alabama Space Grant Consortium, and the ISAC Scholar’s Program.
REFERENCES
- [1].Harris AT, “Spectral mapping tools from the earth sciences applied to spectral microscopy data,” Cytometry Part A 69A, 872–879 (2006). [DOI] [PubMed] [Google Scholar]
- [2].Leavesley SJ, Annamdevula N, Boni J, Stocker S, Grant K, Troyanovsky B, Rich TC, and Alvarez DF, “Hyperspectral imaging microscopy for identification and quantitative analysis of fluorescently-labeled cells in highly autofluorescent tissue,” Journal of Biophotonics 5, 67–84(2012). [DOI] [PMC free article] [PubMed] [Google Scholar]
- [3].Gupta N, “Acousto-optic-tunable-filter-based spectropolarimetric imagers for medical diagnostic applications—instrument design point of view,” J. Biomed. Opt 10, 051802–051802 (2005). [DOI] [PubMed] [Google Scholar]
- [4].Lansford R, Bearman G, and Fraser SE, “Resolution of multiple green fluorescent protein color variants and dyes using two-photon microscopy and imaging spectroscopy,” J. Biomed. Opt 6, 311–318 (2001). [DOI] [PubMed] [Google Scholar]
- [5].Stratis DN, Eland KL, Carter JC, Tomlinson SJ, and Angel SM, “Comparison of Acousto-optic and Liquid Crystal Tunable Filters for Laser-Induced Breakdown Spectroscopy,” Appl. Spectrosc. 55, 999–1004 (2001). [Google Scholar]
- [6].King J, Hamil T, Creighton J, Wu S, Bhat P, McDonald F, and Stevens T, “Structural and functional characteristics of lung macro- and microvascular endothelial cell phenotypes,” Microvascular Research 67, 139–151 (2004). [DOI] [PubMed] [Google Scholar]


