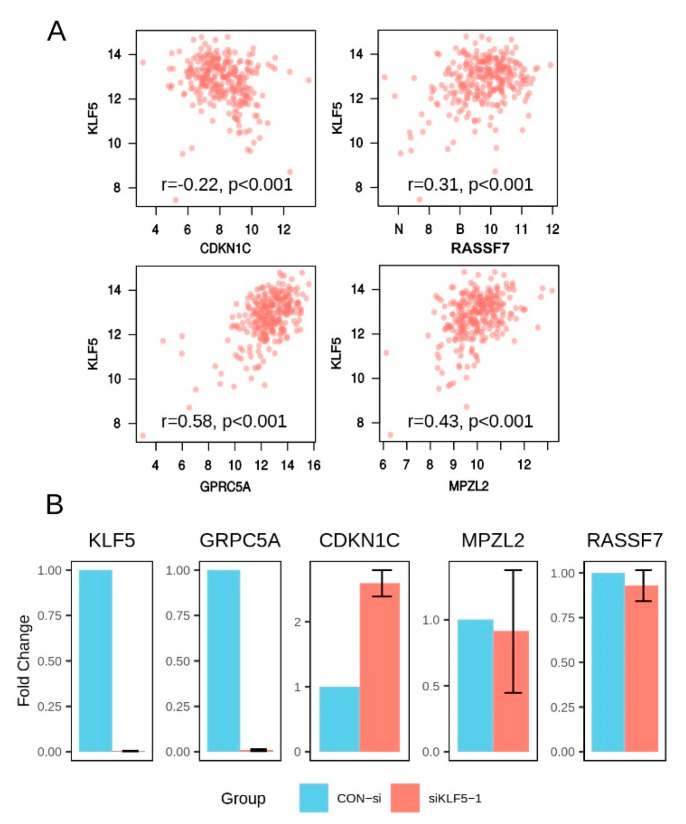
Figure 7.
Screening and validation of potentially KLF5 regulated genes. (A) Scatter plots showing the correlation between the expression of KLF5 and selected genes in TCGA dataset. (B) qualitative PCR analysis of gene expression after transient downregulation of KLF5 using siRNA in SGC7901. KLF5, GRPC5A, and CDKN1C showed statistically different expressions between siKLF5-1 and control treatment groups (T-test: p < 0.05 for all three genes). The assay was repeated three times and one of the typical results was shown here.

