

Abstract
Background
Poststroke depression (PSD) is a common neuropsychiatric disorder after stroke. The neuroinflammatory response exerts a vital effect in the development of PSD. Lymphocyte-to-monocyte ratio (LMR), a systemic inflammation biomarker, is associated with poor prognosis of acute ischemic stroke (AIS). The purpose of this study was to determine the association between LMR and PSD at 3 months.
Material/Methods
AIS patients (507) were included in this study. Patients were categorized into 3 tertiles and each tertile contains 169 patients: tertile1 (>4.85), tertile 2 (2.96 to 4.85), and tertile 3 (<2.96), based on LMR values and the numbers of patients. PSD was diagnosed with a 17-item Hamilton Depression Scale score of 8 or higher.
Results
Patients (141; 27.8%) were diagnosed with PSD at 3-month follow-up. Patients in the PSD group presented with more severe stroke and lower LMR values (P<0.001). Decreased LMRs were independently associated with occurrence of PSD (middle tertile: odds ratio [OR] 1.823, P=0.037; lowest tertile: OR 3.024, P<0.001). A significant association of a lower LMR value with PSD severity was found (middle tertile: OR 1.883, P=0.031; lowest tertile: OR 2.633, P=0.001). The receiver operating characteristic curve indicates that the optimal threshold of LMR as a predictor for PSD was 3.14, which yielded a sensitivity of 72.4% and a specificity of 68.1%.
Conclusions
Decreased LMR is independently associated with PSD and increased PSD severity.
Keywords: Depression, Lymphocyte Count, Monocytes, Stroke
Background
Stroke, the major contributor to the global burden of neurological diseases, is the second leading cause of mortality and has been associated with the development of physical and neuropsychological disorders [1]. Poststroke depression (PSD) is the most common emotional disorder, affecting a third of survivors after stroke [2]. A recent meta-analysis has concluded that PSD predicts poor prognoses such as reduced quality of life, cognitive disorders, neurological function impairment, and worse rehabilitation outcomes, and is closely related to increased mortality among individuals who have had a stroke [3,4]. Consequently, early recognition and identification of PSD is vital for the recovery of stroke patients.
However, the specific pathophysiological mechanism of PSD has not been fully elucidated and may involve biological, behavioral, and social factors [5]. Previous findings suggest that PSD is associated with biological factors, including the interruption of monoamine pathways, dysregulation of the hypothalamus-pituitary-adrenal (HPA) axis, inflammation response, and alterations in neuroplasticity [6–8]. Elevated levels of proinflammatory cytokines, playing an important role in the neuroinflammatory response, have been reported to be involved both in the pathophysiologic changes of stroke and the development of PSD [9]. Previous studies regarding PSD indicated that elevated tumor necrosis factor α (TNF-α), interleukin-6 (IL-6), IL-10, and interferon-γ were associated with PSD at 1 year [10]. Higher TNF-α and IL-1β levels were reported to be key risk factors of PSD at 2 weeks [11].
Lymphocytes and monocytes are crucial cells of the immune system and lead to poststroke injury and depression due to the dysregulation of their actions in the inflammatory response with decreasing anti-inflammatory cytokines and increasing proinflammatory cytokines [12]. As a simple marker reflecting systemic inflammation, the lymphocyte-to-monocyte ratio (LMR) is linked to a poor prognosis of hematologic and solid malignancies [13,14]. Currently, a low LMR value independently predicts moderate to severe stroke and has been proved to be an independent factor for predicting poor functional outcome of stroke patients treated with thrombolysis or routine therapy [15,16]. Furthermore, LMR also is considered to be significantly associated with neurological deterioration and 3-month mortality in patients with spontaneous intracerebral hemorrhage [17].
Since PSD is susceptible to the inflammatory process after stroke onset, we hypothesized that the LMR may be a predictor for PSD. Thus, this study aimed to assess the predictive value of LMR for PSD at 3 months after a stroke.
Material and Methods
Study Subjects
Hospitalized patients with acute ischemic stroke (AIS) from July 2016 to July 2019 were recruited in the Department of Neurology, Harrison International Peace Hospital. Patients with AIS admitted to the hospital within 72 h of the onset of focal neurological deficit symptoms were confirmed by brain computed tomography or magnetic resonance imaging. The exclusion criteria were the following: (1) infection within 2 weeks before admission; (2) hematologic or solid malignancies or autoimmune diseases; (3) taking immunosuppressants, antidepressants, or steroids; (4) a history of major depression or other psychiatric diseases; (5) having severe renal or liver dysfunction; (6) any central nervous system disorders such as dementia, Parkinson disease, severe cognitive impairment, or hydrocephalus; (7) severe aphasia or dysarthria, visual or auditory impairment leading to failure of assessment; (8) dying or having infections during hospital admission; (9) having infections or anti-inflammatory treatments during the 3-month follow-up period; (10) receiving intravenous thrombolytic therapy or thrombectomy treatment.
This study was carried out in accordance with the Declaration of Helsinki. The approval of this study was obtained from the Medical Ethics Committee of Harrison International Peace Hospital. Informed consent was obtained from all patients or their relatives.
Data Collection
The demographic data and clinical characteristic of subjects were collected and included the following: age, sex, years of education, marital status, lesion locations, C-reactive protein (CRP), erythrocyte sedimentation rate (ESR), procalcitonin (PCT), vascular risk factors (hypertension, coronary heart disease [CHD]), diabetes mellitus, previous stroke, atrial fibrillation (AF), hyperlipidemia, smoking, and alcohol drinking. The LMR was evaluated by dividing the lymphocyte count by the monocyte count on admission. According to the distribution of the LMR value and the number of eligible subjects, LMR was divided into tertiles to explore the association with PSD.
Assessment
Neurological impairment was assessed using the National Institutes of Health Stroke Scale (NIHSS) [18]. A NIHSS score ≥6 represented a diagnosis of moderate to severe stroke. Three months after stroke onset, depressive symptoms were screened using the 17-item Hamilton Depression Scale (HAMD-17). The depression evaluation was performed by experienced psychiatrists who were blinded to the baseline characteristics of the patients. A patient with a HAMD score higher than 7 was diagnosed with PSD using the Diagnostic and Statistical Manual of Mental Disorders, 4th edition. Mild PSD was defined as a HAMD score of 8–17. A patient with a HAMD score higher than 17 was diagnosed with moderate to severe PSD.
Statistical Analysis
Continuous variables are presented as median (interquartile range) or mean ± standard deviation according to the normality of distribution. Comparisons among groups were made using the Mann-Whitney U test. Categorical variables were shown as frequency and percentage. The chi-square test or Fisher’s exact test was used for comparing qualitative data among groups. Spearman rank correlation was used for exploring the correlation between occurrence of PSD and LMR. For exploring the potential risk factors of PSD, we performed binary logistic regression analysis. Ordinal multinomial logistic regression was used for examining the effect of LMR on PSD severity. The predictive value of LMR for PSD was evaluated by receiver operating characteristic (ROC) curve analysis. Statistical significance was defined as a 2-tailed P value <0.05. The scatter diagram was created using Excel 2007. All statistical analysis was performed with SPSS 22.0.
Results
Clinical and Demographic Characteristics of Patients with AIS According to LMR Tertiles
A total of 838 patients was hospitalized between July 2016 and July 2019 in the Department of Neurology. Among them, 299 patients were excluded because of the exclusion criteria. In addition, 32 patients failed to finish the 3-month follow-up and among them 8 patients (25%) died. Finally, a total of 507 eligible patients (Figure 1), consisting of 338 men (66.7%) and 169 (33.3%) women, was included. On the basis of tertiles of LMR values (tertile 1 >4.85; tertile 2 2.96–4.85; tertile 3 <2.96) on admission and the number of patients enrolled in the study, all the eligible patients were divided into 3 subgroups, each containing 169 patients. Baseline characteristics of the study population are presented in Table 1. The patients in the lowest tertile were more likely to be elderly and had higher NIHSS and HAMD scores (P<0.001 for all, Table 1). No statistically significant difference among the 3 tertiles was found in the remaining data (P>0.05 for all, Table 1).
Figure 1.
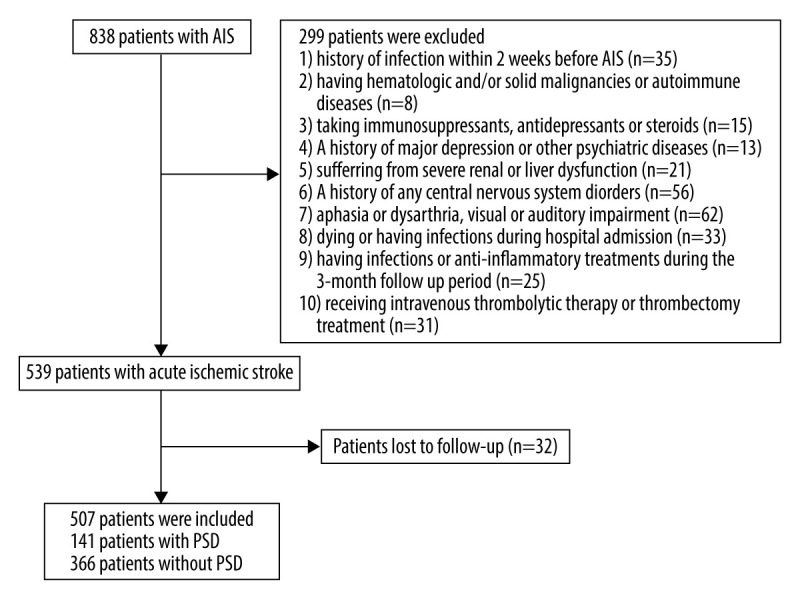
Flow chart of study population selection.
Table 1.
Clinical and demographic characteristics of patients with acute ischemic stroke (AIS) according to lymphocyte-to-monocyte ratio (LMR) tertiles.
| Variables | Total | LMR values on admission | p-Value | ||
|---|---|---|---|---|---|
| Tertile 1 (n=169) LMR >4.85 |
Tertile 2 (n=169) LMR 2.96–4.85 |
Tertile 3 (n=169) LMR <2.96 |
|||
| Demographic data | |||||
| Age(years), median (IQR) | 61.0 (55.0–74.0) | 59.0 (54.0–66.0) | 60.0 (52.5–70.0) | 71.0 (60.0–78.5) | <0.001 |
| Gender (Male), n (%) | 338 (66.7) | 107 (63.3) | 122 (72.2) | 109 (64.5) | 0.171 |
| Marital status (married), n(%) | 500 (98.6) | 165 (97.6) | 167 (98.8) | 168 (99.4) | 0.363 |
| Admission to hospital (hours), median (IQR) | 15.0 (5.0–39.0) | 16.0 (6.0–24.0) | 13.0 (5.0–35.0) | 18.0 (5.0–48.0) | 0.336 |
| Education (years), median (IQR) | 8.0 (7.0–11.0) | 8.0 (6.5–11.0) | 8.0 (7.0–11.0) | 8.0 (7.0–11.0) | 0.965 |
| Smoking, n (%) | 252 (49.7) | 84 (49.7) | 82 (48.5) | 86 (50.9) | 0.910 |
| Alcohol drinking, n (%) | 224 (44.2) | 78 (46.2) | 71 (42.0) | 75 (44.4) | 0.744 |
| Comorbidities | |||||
| Hypertension, n (%) | 391 (77.1) | 129 (76.3) | 132 (78.1) | 130 (76.9) | 0.925 |
| Diabetes, n (%) | 125 (24.7) | 40 (23.7) | 41 (24.3) | 44 (26.0) | 0.871 |
| Hyperlipidemia, n (%) | 186 (36.7) | 66 (39.1) | 65 (38.5) | 55 (32.5) | 0.390 |
| AF, n (%) | 46 (9.1) | 13 (7.7) | 12 (7.1) | 21 (12.4) | 0.175 |
| CHD, n (%) | 126 (24.9) | 37 (21.9) | 37 (21.9) | 52 (30.8) | 0.093 |
| Stroke history, n (%) | 173 (34.1) | 50 (29.6) | 55 (32.5) | 68 (40.2) | 0.103 |
| Lesion location | |||||
| Frontal lobe, n (%) | 89 (17.6) | 30 (17.8) | 28 (16.6) | 31 (18.3) | 0.909 |
| Parietal lobe, n (%) | 44 (8.7) | 15 (8.9) | 13 (7.7) | 16 (9.5) | 0.840 |
| Temporal lobe, n (%) | 34 (6.7) | 10 (5.9) | 11 (6.5) | 13 (7.7) | 0.802 |
| Occipital lobe, n (%) | 26 (5.1) | 9 (5.3) | 10 (5.9) | 7 (4.1) | 0.753 |
| Basal ganglia, n (%) | 211 (41.6) | 70 (41.4) | 68 (40.2) | 73 (43.2) | 0.857 |
| Midbrain, n (%) | 40 (7.9) | 11 (6.5) | 13 (7.7) | 16 (9.5) | 0.597 |
| Pons, n (%) | 50 (9.9) | 17 (10.1) | 15 (8.9) | 18 (10.7) | 0.856 |
| Medulla, n (%) | 44 (8.7) | 15 (8.9) | 13 (7.7) | 16 (9.5) | 0.840 |
| Cerebellum, n (%) | 51 (10.1) | 20 (11.8) | 16 (9.5) | 15 (8.9) | 0.633 |
| Clinical characteristics | |||||
| CRP (mg/L) | 10.45±2.26 | 10.02±1.35 | 10.55±2.10 | 10.78±1.63 | 0.865 |
| ESR (mm/h) | 12.66±3.25 | 12.39±2.56 | 12.86±3.51 | 13.43±2.28 | 0.129 |
| PCT (ng/ml) | 1.35±0.31 | 1.21±0.16 | 1.46±0.11 | 1.52±0.41 | 0.086 |
| NIHSS score, median (IQR) | 4.0 (2.0–8.0) | 2.0 (1.0–4.5) | 3.0 (2.0–6.0) | 8.0 (4.0–10.0) | <0.001 |
| HAMD score, median (IQR) | 2 (1.0–8.0) | 2.0 (1.0–4.5) | 1.0 (0–7.5) | 5.0 (1.0–12.0) | <0.001 |
n – number of patients; AF – atrial fibrillation; CHD – coronary heart disease; CRP – C-reactive protein; ESR – erythrocyte sedimentation rate; PCT – procalcitonin; NIHSS – National Institutes of Health Stroke Scale; HAMD – Hamilton Depression Scale; LMR – lymphocyte-to-monocyte ratio.
Neurology Data of Patients in Each Tertile
A total of 185 AIS patients had moderate to severe stroke, whereas 141 patients experienced PSD (Table 2). We observed that patients with lower LMR more often presented with moderate to severe stroke and PSD (P<0.001 for both). Furthermore, the proportion of patients with moderate to severe stroke developing PSD in tertile 3 was higher than that in the 2 higher tertiles (28.6% vs 40.9% vs 54.0%, P=0.035, Table 2). Meanwhile, the proportion of patients with mild stroke developing PSD in tertile 3 also was higher than that in the 2 higher tertiles (11.3% vs 19.2% vs 25.0%, P=0.045, Table 2).
Table 2.
Comparison of neurology data of the patients in each tertile.
| Variables | Total | LMR values on admission | p-Value | ||
|---|---|---|---|---|---|
| Tertile 1 (n=169) LMR >4.85 |
Tertile 2 (n=169) LMR 2.96–4.85 |
Tertile 3 (n=169) LMR <2.96 |
|||
| Moderate to severe stroke (NIHSS score >5), n (%) | 185 (36.5) | 28 (16.6) | 44 (26.0) | 113 (66.9) | <0.001 |
| PSD (HAMD score >7), n (%) | 141 (27.8) | 24 (14.2) | 42 (24.9) | 75 (54.6) | <0.001 |
| Moderate to severe stroke with PSD, n (%) | 87 (47.0) | 8 (28.6) | 18 (40.9) | 61 (54.0) | 0.035 |
| Mild stroke with PSD, n (%) | 54 (16.8) | 16 (11.3) | 24 (19.2) | 14 (25.0) | 0.045 |
n – number of patients; NIHSS – National Institutes of Health Stroke Scale; PSD – post-stroke depression; LMR – lymphocyte-to-monocyte ratio.
Clinical and Demographic Characteristics of Patients with PSD and without PSD
A total of 141 patients (27.8%) with AIS developed PSD at 3-month follow-up (Table 3). Among them, 117 patients had mild PSD and 24 patients developed moderate to severe PSD. Compared with the non-PSD group, patients with PSD presented with higher NIHSS and HAMD scores and lower LMR values (P<0.001 for all). PSD patients were more likely to be women (P=0.040). The incidence of frontal lobe, temporal lobe, and basal ganglia infarctions was higher in PSD patients compared with non-PSD subjects (P<0.05 for all, Table 3).
Table 3.
Clinical and demographic characteristics of patients with poststroke depression (PSD) and without PSD.
| Variables | Non-PSD patients (n=366) | Mild PSD patients (n=117) | Moderate to severe PSD patients (n=24) | p-Value |
|---|---|---|---|---|
| Demographic data | ||||
| Age(years), median (IQR) | 60.0 (54.0–70.3) | 68.0 (56.0–77.0) | 71.0 (60.0–80.3) | 0.285 |
| Gender (Male), n (%) | 255 (69.7) | 71 (60.7) | 12 (50.0) | 0.040 |
| Marital status (married), n(%) | 363 (99.2) | 115 (98.3) | 22 (91.7) | 0.134 |
| Admission to hospital (hours), median (IQR) | 15.8 (5.0–41.0) | 14.0 (6.0–42.5) | 12.0 (4.5–24.8) | 0.763 |
| Education (years), median (IQR) | 8.0 (6.0–11.0) | 8.0 (7.0–11.0) | 8.5 (6.3–10.8) | 0.973 |
| LMR, median (IQR) | 4.46 (2.90–5.68) | 2.65 (1.43–4.04) | 1.07 (0.92–2.98) | <0.001 |
| Tertile 1 (>4.85), n (%) | 145 (39.6) | 22 (18.8) | 2 (8.3) | <0.001 |
| Tertile 2 (2.96–4.85), n (%) | 127 (34.7) | 35 (29.9) | 7 (29.2) | 0.574 |
| Tertile 3 (<2.96), n (%) | 94 (25.7) | 60 (51.3) | 15 (62.5) | <0.001 |
| Smoking, n (%) | 190 (51.9) | 56 (47.9) | 6 (25.0) | 0.035 |
| Alcohol drinking, n (%) | 168 (45.9) | 48 (41.0) | 8 (33.3) | 0.358 |
| Comorbidities | ||||
| Hypertension, n (%) | 289 (79.0) | 83 (70.9) | 19 (79.2) | 0.193 |
| Diabetes, n (%) | 95 (26.0) | 27 (23.1) | 3 (12.5) | 0.301 |
| Hyperlipidemia, n (%) | 135 (36.9) | 43 (36.8) | 8 (33.3) | 0.941 |
| AF, n (%) | 31 (8.5) | 13 (11.1) | 2 (8.3) | 0.693 |
| CHD, n (%) | 86 (23.5) | 34 (29.1) | 6 (25.0) | 0.480 |
| Stroke history, n (%) | 117 (32.0) | 46 (39.3) | 10 (41.7) | 0.251 |
| Lesion location | ||||
| Frontal lobe, n (%) | 39 (10.7) | 43 (36.8) | 7 (29.2) | <0.001 |
| Parietal lobe, n (%) | 34 (9.3) | 7 (6.0) | 3 (12.5) | 0.430 |
| Temporal lobe, n (%) | 15 (4.1) | 11 (9.4) | 8 (33.3) | <0.001 |
| Occipital lobe, n (%) | 19 (5.2) | 5 (4.3) | 2 (8.3) | 0.710 |
| Basal ganglia, n (%) | 135 (36.9) | 66 (56.4) | 10 (41.7) | 0.001 |
| Midbrain, n (%) | 29 (7.9) | 8 (6.8) | 3 (12.5) | 0.584 |
| Pons, n (%) | 37 (10.1) | 9 (7.7) | 4 (16.7) | 0.366 |
| Medulla, n (%) | 31 (8.5) | 10 (8.5) | 3 (12.5) | 0.671 |
| Cerebellum, n (%) | 34 (9.3) | 12 (10.3) | 5 (20.8) | 0.170 |
| Clinical characteristics | ||||
| CRP (mg/L) | 10.21±2.12 | 10.52±1.86 | 10.83±3.10 | 0.510 |
| ESR (mm/h) | 12.51±1.98 | 12.76±3.28 | 13.66±2.95 | 0.189 |
| PCT (ng/ml) | 1.26±0.36 | 1.42±0.41 | 1.66±0.33 | 0.141 |
| NIHSS score, median (IQR) | 3.0 (1.0–5.0) | 8.0 (5.0–11.5) | 10.0 (7.5–12.8) | <0.001 |
| HAMD score, median (IQR) | 1.0 (0–3.0) | 12.0 (9.0–15.0) | 19.0 (18.0–20.0) | <0.001 |
PSD – post-stroke depression; n – number of patients; AF – atrial fibrillation; CHD – coronary heart disease; CRP – C-reactive protein; ESR – erythrocyte sedimentation rate; PCT – procalcitonin; NIHSS – National Institutes of Health Stroke Scale; HAMD – Hamilton Depression Scale; LMR – lymphocyte-to-monocyte ratio.
Association of LMR Value and PSD
As shown in Table 3, the proportion of patients in tertile 1 (>4.85) was significantly lower in the moderate to severe PSD group (P<0.001), whereas the proportion of the patients in tertile 3 (<2.96) was significantly higher in the moderate to severe PSD group (P<0.001). In addition, there existed a negative correlation between LMR value and HAMD score at 3 months (r=−0.358, P<0.001; Figure 2). Moreover, taking the incidence of PSD as the dependent variable and the highest tertile (>4.85) as the reference, binary logistic regression analysis without adjustment showed that the middle tertile of LMR (odds ratio [OR]=1.998, 95% confidence interval [CI]=1.147–3.481, P=0.015) and the lowest tertile of LMR (OR=4.820, 95% CI=2.843–6.172, P<0.001) were the independent risk factors for PSD. After adjusting for variables, including sex, marital status, time of admission to hospital, education years, smoking, alcohol drinking, CRP, ESR, PCT, comorbidities (hypertension, diabetes, hyperlipidemia, AF, CHD, stroke history), age, and NIHSS score on admission, the middle tertile of LMR (OR=1.823, 95% CI=1.037–3.207, P=0.037) and the lowest tertile of LMR (OR=3.024, 95% CI=1.822–5.632, P<0.001) remained independently associated with the occurrence of PSD (Table 4). The ROC curve analysis of LMR showed that the area under the curve (AUC) was 0.800 and the critical threshold value was 3.14, with sensitivity of 72.4% and specificity of 68.1% (95% CI=0.756–0.844, P<0.001) (Figure 3).
Figure 2.
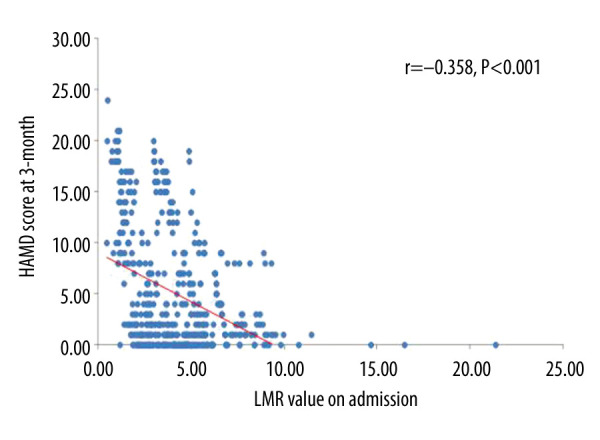
Correlation between lymphocyte-to-monocyte ratio (LMR) value on admission and Hamilton Depression Scale (HAMD) score at 3 months.
Table 4.
Binary logistic regression analysis for the association between lymphocyte-to-monocyte ratio (LMR) and poststroke depression (PSD).
| Tertile | OR* | 95% CI | p-Value | |
|---|---|---|---|---|
| Unadjusted | Middle | 1.998 | 1.147–3.481 | 0.015 |
| Lowest | 4.820 | 2.843–6.172 | <0.001 | |
| Model 1a | Middle | 1.946 | 1.083–3.499 | 0.026 |
| Lowest | 3.105 | 1.689–5.709 | <0.001 | |
| Model 2b | Middle | 1.791 | 1.016–3.156 | 0.044 |
| Lowest | 2.738 | 1.531–4.896 | 0.001 | |
| Model 3c | Middle | 1.823 | 1.037–3.207 | 0.037 |
| Lowest | 3.024 | 1.822–5.632 | <0.001 |
OR – odds radio; CI – confidence interval; LMR – lymphocyte-to-monocyte ratio; PSD – post-stroke depression.
Reference OR (1.000) is the highest tertile of LMR for PSD;
Model 1: adjusted for gender, marital status, admission to hospital, education years, smoking, alcohol drinking, C-reactive protein, erythrocyte sedimentation rate, procalcitonin and comorbidities (hypertension, diabetes, hyperlipidemia, atrial fibrillation, cornary heart disease, stroke history);
Model 2: adjusted for covariates from Model 1 and further adjusted for age;
Model 3: adjusted for covariates from Model 2 and further adjusted for NIHSS score on admission.
Figure 3.
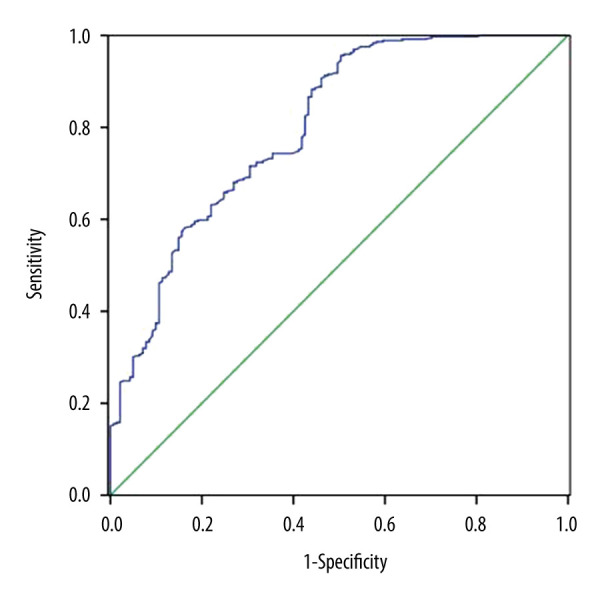
0Diagnostic characteristics of lymphocyte-to-monocyte ratio (LMR) for predicting poststroke depression (PSD) at 3 months.
Association between LMR Value and PSD Severity
Considering the severity of PSD as the dependent variable and highest tertile (>4.85) as the reference, ordinal multinomial logistic regression without adjustment showed that the middle tertile of LMR (OR=2.026, 95% CI=1.164–3.525, P=0.013) and the lowest tertile of LMR (OR=4.899, 95% CI=2.899–8.265, P<0.001) were both independent risk factors of PSD severity. After adjusting for variables, including age, sex, marital status, time of admission to hospital, education years, smoking, alcohol drinking, CRP, ESR, PCT, comorbidities (hyperlipidemia, AF, CHD, stroke history), hypertension, diabetes, and NIHSS score on admission, the middle tertile of LMR (OR=1.883, 95% CI=1.059–3.350, P=0.031) and the lowest tertile of LMR (OR=2.633, 95% CI=1.484–4.655, P=0.001) were still independently associated with PSD severity (Table 5).
Table 5.
Ordinal multinomial logistic regression analysis for the association between lymphocyte-to-monocyte ratio (LMR) values and poststroke depression (PSD) severity.
| Tertile | OR* | 95% CI | p-Value | |
|---|---|---|---|---|
| Unadjusted | Middle | 2.026 | 1.164–3.525 | 0.013 |
| Lowest | 4.899 | 2.899–8.265 | <0.001 | |
| Model 1a | Middle | 2.030 | 1.127–3.658 | 0.018 |
| Lowest | 2.782 | 1.514–5.109 | 0.001 | |
| Model 2b | Middle | 1.944 | 1.089–3.473 | 0.025 |
| Lowest | 2.620 | 1.468–4.674 | 0.001 | |
| Model 3c | Middle | 1.883 | 1.059–3.350 | 0.031 |
| Lowest | 2.633 | 1.484–4.665 | 0.001 |
OR – odds radio; CI – confidence interval; LMR – lymphocyte-to-monocyte ratio; PSD – post-stroke depression.
Reference OR (1.000) is the highest tertile of LMR for PSD severity;
Model 1: adjusted for age, gender, marital status, admission to hospital, education years, smoking, alcohol drinking, hyperlipidemia, atrial fibrillation, cornary heart disease, C-reactive protein, erythrocyte sedimentation rate, procalcitonin and stroke history;
Model 2: adjusted for covariates from Model 1 and further adjusted for hypertension and diabetes;
Model 3: adjusted for covariates from Model 2 and further adjusted for NIHSS score on admission.
Discussion
To our best knowledge this is the first research to explore the relationship of LMR value on admission in patients with AIS to the development of depressive impairment after stroke at 3 months. This study indicated that decreased LMR values were independently associated with occurrence of PSD and PSD severity. Thus, our results showed that the LMR value might be considered as a simple and available biomarker for predicting PSD and be helpful for clinical practice.
PSD has been widely considered to be related to adverse stroke recovery and increased disability and mortality [19,20]. In this study, we observed that 27.8% of patients with AIS developed to PSD, which is in agreement with the frequency in previous findings [2,21]. The relationship between stroke severity and PSD has been well identified [22], and the present study suggested that patients with PSD had more serious stroke severity compared with non-PSD patients. Meanwhile, univariate analysis showed that increased stroke severity was strongly associated with PSD severity. Age has been well identified as a risk for PSD [23], and the present study also clarified this association by using univariate analysis. Numerous studies have demonstrated that PSD was associated with infarct lesions in the frontal lobe, temporal lobe, and basal ganglia, which was in accordance with our results [24–26]. Subsequently, some studies further clarified the association between the damage of the limbic-cortical-striatal-pallidal-thalamic circuit and depression, which could explain the relationship between infarct lesions and the presence of PSD [27,28].
Global brain inflammation has been reported to be involved in the pathophysiology after stroke onset and affects the occurrence and development of additional clinical sequelae, such as subsequent PSD [29,30]. Recent studies found that higher neutrophil-to-lymphocyte ratios (NLRs) could predict the mortality and poor functional outcome of AIS and hemorrhagic stroke, and also was related to health problems such as pneumonia [31,32]. LMR is an easily estimated systemic inflammation biomarker, as is NLR, and appears to be associated with the occurrence of depression. After a stroke, lymphocytes infiltrate the ischemic locations, which participate in the pathophysiological process of secondary brain injury via production of proinflammatory or anti-inflammatory cytokines [33]. Lymphocytes, representing the pathophysiological stress of individuals, play a significant role in protective and regulating effects during the course of inflammation. Some subtypes of lymphocytes, such as regulatory T cells and CD4+ TH2 cells, have a positive effect through synthesizing and secreting anti-inflammatory cytokines, including IL-4, IL-5, IL-10, and IL-13, and transforming growth factor β, which help improve the prognosis of AIS and exert beneficial effects on major depressive disorder (MDD) [34–37]. Earlier studies have revealed a phenomenon after stroke onset, namely, stroke-induced immunodepression, related to decreased lymphocyte numbers, which contributes to an adverse prognosis [38,39]. The possible mechanism of lymphopenia might be activation of the HPA axis, accompanied by elevated values of cortisol, inducing lymphocyte apoptosis [40]. The vast majority of studies revealed that the presence of MDD is attributed to the dysregulation of the HPA axis with higher cortisol levels [40,41]. We also found that PSD was more frequent in female patients, consistent with a systematic review of PSD [42], the possible mechanism of which was ascribed to the elevated cortisol levels of female subjects [43]. A meta-analytic review demonstrates that MDD patients tend to exhibit lymphopenia [44].
Monocytes, another major inflammatory regulator, play a pivotal role in stimulating the development of postischemia injury [45]. Classical monocytes exacerbate ischemic lesions by producing IL-1β, IL-6, and TNF-α, which are related to the presence of depression [46–48]. Similarly, intermediate monocytes also play a proinflammatory role in the development of MDD by secreting IL-1β and IL-6 [49]. More intriguing, nonclassical monocytes play a dual role in the inflammatory process in MDD, releasing IL-10 to promote recovery of MDD patients and by secreting IL-6 and IL-12 to aggravate the progression of depression [50,51]. It has been well established that the 3 subpopulations of monocytes circulate in dynamic equilibrium and only 1% of the classical subset become intermediate monocytes and then mature to the nonclassical subset under stable conditions [52]. Furthermore, different types of disease affect the frequency of each subset. Previous studies have reported that monocytes are increased at 48–72 h after AIS, and the proportions of classical and intermediate monocytes were higher than that of nonclassical monocytes, which mainly produce anti-inflammatory cytokine IL-10 during the acute stage of stroke [53]. Nevertheless, an increased proportion of nonclassical monocytes, accompanied by higher levels of IL-12 and IL-6, was associated with chronic progressive disease such as MDD [51]. Additionally, a recent study has indicated that increased immune cell counts, especially monocytes, are related to depression [54]. Considering the previous findings, we hypothesized that monocyte subpopulations shift over time after stroke and are fully engaged in the onset and progression of depression.
Given the crucial roles of lymphocytes and monocytes, LMR, a systemic inflammation index, may be considered as an easily available predictor for the occurrence of PSD. Since decreased lymphocyte and increased monocyte counts are both found in AIS patients and MDD subjects, this study clarified that AIS patients with lower LMR values were inclined to have PSD. Moreover, decreased LMR was independently associated with PSD and PSD severity. The LMR AUC showed that LMR was a good prognostic marker for PSD, with sensitivity of 72.4% and specificity of 68.1%. Consequently, LMR could be used to predict the development and aggravation of PSD.
However, several limitations existed in this study. First, we merely collected the LMR at admission, and it is necessary to determine the possible relationship of the dynamic changes of LMR over time to PSD. Second, previous studies showed that depression symptoms start in the first month [20,25]. In the present study, the depression scale was screened at 3-month follow-up. When the depression evaluation period is extended, it may lead to increase in the number of losses of follow-ups or deaths, which can affect the PSD rates. Third, since it is a single-center study based on the native population, multiregional and multiethnic studies are required to assess what was found. Finally, we did not measure the cortisol level and inflammatory cytokines, and further studies will be required to detect changes in the acute phase of inflammation after AIS.
Conclusions
Low LMR value was independently associated with the development of PSD, and also was related to increased PSD severity. In summary, LMR could help clinicians to recognize and take measures for treatment in the early stage.
Acknowledgments
Hao Ren and Lin Han especially thank Yunxi Ren, who was their study design assistant and emotional anchor.
Footnotes
Source of support: Departmental sources
Conflict of Interest
None.
References
- 1.Bartoli F, Di Brita C, Crocamo C, et al. Early post-stroke depression and mortality: Meta-analysis and meta-regression. Front Psychiatry. 2018;9:530. doi: 10.3389/fpsyt.2018.00530. [DOI] [PMC free article] [PubMed] [Google Scholar]
- 2.Hackett ML, Pickles K. Part I: Frequency of depression after stroke: An updated systematic review and meta-analysis of observational studies. Int J Stroke. 2014;9:1017–25. doi: 10.1111/ijs.12357. [DOI] [PubMed] [Google Scholar]
- 3.Cai W, Mueller C, Li YJ, et al. Post stroke depression and risk of stroke recurrence and mortality: A systematic review and meta-analysis. Ageing Res Rev. 2019;50:102–9. doi: 10.1016/j.arr.2019.01.013. [DOI] [PubMed] [Google Scholar]
- 4.Razmara A, Valle N, Markovic D, et al. Depression is associated with a higher risk of death among stroke survivors. J Stroke Cerebrovasc Dis. 2017;26:2870–79. doi: 10.1016/j.jstrokecerebrovasdis.2017.07.006. [DOI] [PubMed] [Google Scholar]
- 5.Wang Z, Shi Y, Liu F, et al. Diversiform etiologies for post-stroke depression. Front Psychiatry. 2018;9:761. doi: 10.3389/fpsyt.2018.00761. [DOI] [PMC free article] [PubMed] [Google Scholar]
- 6.Narushima K, Kosier JT, Robinson RG. A reappraisal of poststroke depression, intra- and inter-hemispheric lesion location using meta-analysis. J Neuropsychiatry Clin Neurosci. 2003;15:422–30. doi: 10.1176/jnp.15.4.422. [DOI] [PubMed] [Google Scholar]
- 7.Ferrari F, Villa RF. The neurobiology of depression: An integrated overview from biological theories to clinical evidence. Mol Neurobiol. 2017;54:4847–65. doi: 10.1007/s12035-016-0032-y. [DOI] [PubMed] [Google Scholar]
- 8.Masi G, Brovedani P. The hippocampus, neurotrophic factors and depression: Possible implications for the pharmacotherapy of depression. CNS Drugs. 2011;25:913–31. doi: 10.2165/11595900-000000000-00000. [DOI] [PubMed] [Google Scholar]
- 9.Spalletta G, Bossu P, Ciaramella A, et al. The etiology of poststroke depression: A review of the literature and a new hypothesis involving inflammatory cytokines. Mol Psychiatry. 2006;11:984–91. doi: 10.1038/sj.mp.4001879. [DOI] [PubMed] [Google Scholar]
- 10.Su JA, Chou SY, Tsai CS, et al. Cytokine changes in the pathophysiology of poststroke depression. Gen Hosp Psychiatry. 2012;34:35–39. doi: 10.1016/j.genhosppsych.2011.09.020. [DOI] [PubMed] [Google Scholar]
- 11.Kim J-M, Kang H-J, Kim J-W, et al. Associations of tumor necrosis factor-α and interleukin-1β levels and polymorphisms with post-stroke depression. Am J Geriatr Psychiatry. 2017;25:1300–308. doi: 10.1016/j.jagp.2017.07.012. [DOI] [PubMed] [Google Scholar]
- 12.Halaris A. Inflammation and depression but where does the inflammation come from? Curr Opin Psychiatry. 2019;32:422–28. doi: 10.1097/YCO.0000000000000531. [DOI] [PubMed] [Google Scholar]
- 13.Nishijima TF, Muss HB, Shachar SS, et al. Prognostic value of lymphocyte-to-monocyte ratio in patients with solid tumors: A systematic review and meta-analysis. Cancer Treat Rev. 2015;41:971–78. doi: 10.1016/j.ctrv.2015.10.003. [DOI] [PubMed] [Google Scholar]
- 14.Chen H, Luan X, Zhao K, et al. The association between neutrophil-to-lymphocyte ratio and post-stroke depression. Clin Chim Acta. 2018;486:298–302. doi: 10.1016/j.cca.2018.08.026. [DOI] [PubMed] [Google Scholar]
- 15.Ren H, Han L, Liu H, et al. Decreased lymphocyte-to-monocyte ratio predicts poor prognosis of acute ischemic stroke treated with thrombolysis. Med Sci Monit. 2017;23:5826–33. doi: 10.12659/MSM.907919. [DOI] [PMC free article] [PubMed] [Google Scholar]
- 16.Ren H, Liu X, Wang L, et al. Lymphocyte-to-monocyte ratio: A novel predictor of the prognosis of acute ischemic stroke. J Stroke Cerebrovasc Dis. 2017;26:2595–602. doi: 10.1016/j.jstrokecerebrovasdis.2017.06.019. [DOI] [PubMed] [Google Scholar]
- 17.Qi H, Wang D, Deng X, et al. Lymphocyte-to-monocyte ratio is an independent predictor for neurological deterioration and 90-day mortality in spontaneous intracerebral hemorrhage. Med Sci Monit. 2018;24:9282–91. doi: 10.12659/MSM.911645. [DOI] [PMC free article] [PubMed] [Google Scholar]
- 18.Brott T, Adams HP, Olinger CP, et al. Measurements of acute cerebral infarction: A clinical examination scale. Stroke. 1989;20:864–70. doi: 10.1161/01.str.20.7.864. [DOI] [PubMed] [Google Scholar]
- 19.Bilge C, Kocer E, Kocer A, et al. Depression and functional outcome after stroke: The effect of antidepressant therapy on functional recovery. Eur J Phys Rehab Med. 2008;44:13–18. [PubMed] [Google Scholar]
- 20.House A, Knapp P, Bamford J, et al. Mortality at 12 and 24 months after stroke may be associated with depressive symptoms at 1 month. Stroke. 2001;32:696–701. doi: 10.1161/01.str.32.3.696. [DOI] [PubMed] [Google Scholar]
- 21.Ayerbe L, Ayis S, Wolfe CD, et al. Natural history, predictors and outcomes of depression after stroke: Systematic review and meta-analysis. Br J Psychiatry. 2013;202:14–21. doi: 10.1192/bjp.bp.111.107664. [DOI] [PubMed] [Google Scholar]
- 22.Kutlubaev MA, Hackett ML. Part II: Predictors of depression after stroke and impact of depression on stroke outcome: An updated systematic review of observational studies. Int J Stroke. 2014;9:1026–36. doi: 10.1111/ijs.12356. [DOI] [PubMed] [Google Scholar]
- 23.Shi Y, Yang D, Zeng Y, et al. Risk factors for post-stroke depression: A meta-analysis. Front Aging Neurosci. 2017;9:218. doi: 10.3389/fnagi.2017.00218. [DOI] [PMC free article] [PubMed] [Google Scholar]
- 24.Shimoda K, Robinson RG. The relationship between poststroke depression and lesion location in long-term follow-up. Biol Psychiatry. 1999;45:187–92. doi: 10.1016/s0006-3223(98)00178-4. [DOI] [PubMed] [Google Scholar]
- 25.Nishiyama Y, Komaba Y, Ueda M, et al. Early depressive symptoms after ischemic stroke are associated with a left lenticulocapsular area lesion. J Stroke Cerebrovasc Dis. 2010;19:184–89. doi: 10.1016/j.jstrokecerebrovasdis.2009.04.002. [DOI] [PubMed] [Google Scholar]
- 26.Yang SR, Hua P, Shang XY, et al. Predictors of early post ischemic stroke apathy and depression: A cross-sectional study. BMC Psychiatry. 2013;13:164. doi: 10.1186/1471-244X-13-164. [DOI] [PMC free article] [PubMed] [Google Scholar]
- 27.Drevets WC, Price JL, Furey ML. Brain structural and functional abnormalities in mood disorders: Implications for neurocircuitry models of depression. Brain Struct Funct. 2008;213:93–118. doi: 10.1007/s00429-008-0189-x. [DOI] [PMC free article] [PubMed] [Google Scholar]
- 28.Hasler G, Fromm S, Carlson PJ, et al. Neural response to catecholamine depletion in unmedicated subjects with major depressive disorder in remission and healthy subjects. Arch Gen Psychiatry. 2008;65:521–31. doi: 10.1001/archpsyc.65.5.521. [DOI] [PMC free article] [PubMed] [Google Scholar]
- 29.Fu Y, Liu Q, Anrather J, et al. Immune interventions in stroke. Nat Rev Neurol. 2015;11:524–35. doi: 10.1038/nrneurol.2015.144. [DOI] [PMC free article] [PubMed] [Google Scholar]
- 30.Ormstad H, Aass HC, Amthor KF, et al. Serum levels of cytokines, glucose, and hemoglobin as possible predictors of poststroke depression, and association with poststroke fatigue. Int J Neurosci. 2012;122:682–90. doi: 10.3109/00207454.2012.709892. [DOI] [PubMed] [Google Scholar]
- 31.Kakhki RD, Dehghanei M, ArefNezhad R, et al. The predicting role of neutrophil-lymphocyte ratio in patients with acute ischemic and hemorrhagic stroke. J Stroke Cerebrovasc Dis. 2020;29:105233. doi: 10.1016/j.jstrokecerebrovasdis.2020.105233. [DOI] [PubMed] [Google Scholar]
- 32.Song S-Y, Zhao X-X, Rajah G, et al. Clinical significance of baseline neutrophil-to-lymphocyte ratio in patients with ischemic stroke or hemorrhagic stroke: An updated meta-analysis. Front Neurol. 2019;10:1032. doi: 10.3389/fneur.2019.01032. [DOI] [PMC free article] [PubMed] [Google Scholar]
- 33.Shichita T, Sakaguchi R, Suzuki M, et al. Post-ischemic inflammation in the brain. Front Immunol. 2012;3:132. doi: 10.3389/fimmu.2012.00132. [DOI] [PMC free article] [PubMed] [Google Scholar]
- 34.Arumugam TV, Granger DN, Mattson MP. Stroke and T-cells. Neuromol Med. 2005;7:229–42. doi: 10.1385/NMM:7:3:229. [DOI] [PubMed] [Google Scholar]
- 35.Hu Y, Zheng Y, Wu Y, et al. Imbalance between IL-17A-producing cells and regulatory T cells during ischemic stroke. Mediators Inflamm. 2014;2014:813045. doi: 10.1155/2014/813045. [DOI] [PMC free article] [PubMed] [Google Scholar]
- 36.Schwartz M, Moalem G. Beneficial immune activity after CNS injury: Prospects for vaccination. J Neuroimmunol. 2001;113:185–92. doi: 10.1016/s0165-5728(00)00447-1. [DOI] [PubMed] [Google Scholar]
- 37.Perez-Sanchez G, Becerril-Villanueva E, Arreola R, et al. Inflammatory profiles in depressed adolescents treated with fluoxetine: An 8-week follow-up open study. Mediators Inflamm. 2018;2018:4074051. doi: 10.1155/2018/4074051. [DOI] [PMC free article] [PubMed] [Google Scholar]
- 38.Offner H, Vandenbark AA, Hurn PD. Effect of experimental stroke on peripheral immunity: CNS ischemia induces profound immunosuppression. Neuroscience. 2009;158:1098–111. doi: 10.1016/j.neuroscience.2008.05.033. [DOI] [PMC free article] [PubMed] [Google Scholar]
- 39.Kim JM, Stewart R, Kim SW, et al. Associations of cytokine gene polymorphisms with post-stroke depression. World J Biol Psychiatry. 2012;13:579–87. doi: 10.3109/15622975.2011.588247. [DOI] [PubMed] [Google Scholar]
- 40.Holsboer F. The corticosteroid receptor hypothesis of depression. Neuropsychopharmacology. 2000;23:477–501. doi: 10.1016/S0893-133X(00)00159-7. [DOI] [PubMed] [Google Scholar]
- 41.Horstmann S, Dose T, Lucae S, et al. Suppressive effect of mirtazapine on the HPA system in acutely depressed women seems to be transient and not related to antidepressant action. Psychoneuroendocrinology. 2009;34:238–48. doi: 10.1016/j.psyneuen.2008.09.004. [DOI] [PubMed] [Google Scholar]
- 42.De Ryck A, Brouns R, Geurden M, et al. Risk factors for poststroke depression: Identification of inconsistencies based on a systematic review. J Geriatr Psychiatry Neurol. 2014;27:147–58. doi: 10.1177/0891988714527514. [DOI] [PubMed] [Google Scholar]
- 43.Kunzel HE, Binder EB, Nickel T, et al. Pharmacological and nonpharmacological factors influencing hypothalamic-pituitary-adrenocortical axis reactivity in acutely depressed psychiatric in-patients, measured by the Dex-CRH test. Neuropsychopharmacology. 2003;28:2169–78. doi: 10.1038/sj.npp.1300280. [DOI] [PubMed] [Google Scholar]
- 44.Zorrilla EP, Luborsky L, McKay JR, et al. The relationship of depression and stressors to immunological assays: A meta-analytic review. Brain Behav Immun. 2001;15:199–226. doi: 10.1006/brbi.2000.0597. [DOI] [PubMed] [Google Scholar]
- 45.Jin R, Yang G, Li G. Inflammatory mechanisms in ischemic stroke: Role of inflammatory cells. J Leukoc Biol. 2010;87:779–89. doi: 10.1189/jlb.1109766. [DOI] [PMC free article] [PubMed] [Google Scholar]
- 46.Villa RF, Ferrari F, Moretti A. Post-stroke depression: Mechanisms and pharmacological treatment. Pharmacol Ther. 2018;184:131–44. doi: 10.1016/j.pharmthera.2017.11.005. [DOI] [PubMed] [Google Scholar]
- 47.Levada OA, Troyan AS. Poststroke depression biomarkers: A narrative review. Front Neurol. 2018;9:577. doi: 10.3389/fneur.2018.00577. [DOI] [PMC free article] [PubMed] [Google Scholar]
- 48.Boyette LB, Macedo C, Hadi K, et al. Phenotype, function, and differentiation potential of human monocyte subsets. PLoS One. 2017;12:e0176460. doi: 10.1371/journal.pone.0176460. [DOI] [PMC free article] [PubMed] [Google Scholar]
- 49.Alvarez-Mon MA, Gomez AM, Orozco A, et al. Abnormal distribution and function of circulating monocytes and enhanced bacterial translocation in major depressive disorder. Front Psychiatry. 2019;10:812. doi: 10.3389/fpsyt.2019.00812. [DOI] [PMC free article] [PubMed] [Google Scholar]
- 50.Laumet G, Edralin JD, Chiang AC, et al. Resolution of inflammation-induced depression requires T lymphocytes and endogenous brain interleukin-10 signaling. Neuropsychopharmacology. 2018;43:2597–605. doi: 10.1038/s41386-018-0154-1. [DOI] [PMC free article] [PubMed] [Google Scholar]
- 51.Hasselmann H, Gamradt S, Taenzer A, et al. Pro-inflammatory monocyte phenotype and cell-specific steroid signaling alterations in unmedicated patients with major depressive disorder. Front Immunol. 2018;9:2693. doi: 10.3389/fimmu.2018.02693. [DOI] [PMC free article] [PubMed] [Google Scholar]
- 52.Wong KL, Tai JJ, Wong WC, et al. Gene expression profiling reveals the defining features of the classical, intermediate, and nonclassical human monocyte subsets. Blood. 2011;118:e16–31. doi: 10.1182/blood-2010-12-326355. [DOI] [PubMed] [Google Scholar]
- 53.Kaito M, Araya S, Gondo Y, et al. Relevance of distinct monocyte subsets to clinical course of ischemic stroke patients. PLoS One. 2013;8:e69409. doi: 10.1371/journal.pone.0069409. [DOI] [PMC free article] [PubMed] [Google Scholar]
- 54.Zhou L, Ma X, Wang W. Inflammation and coronary heart disease risk in patients with depression in China mainland: A cross-sectional study. Neuropsychiatr Dis Treat. 2020;16:81–86. doi: 10.2147/NDT.S216389. [DOI] [PMC free article] [PubMed] [Google Scholar]