Abstract
Profiling samples from patients, tissues, and cells with genomics, transcriptomics, epigenomics, proteomics, and metabolomics ultimately produce lists of genes and proteins that need to be further analyzed and integrated in the context of known biology. Enrichr (Chen et al., 2013; Kuleshov et al., 2016) is a gene set search engine that enables the querying of hundreds of thousands of annotated gene sets. Enrichr uniquely integrates knowledge from many high-profile projects to provide synthesized information about mammalian genes and gene sets. The platform, available at https://maayanlab.cloud/Enrichr, provides various methods to compute gene set enrichment and the results are visualized in several interactive ways. This protocol provides a summary of the key features of Enrichr, which include using Enrichr programmatically and embedding an Enrichr button on any website.
Keywords: bioinformatics, enrichment analysis, gene sets, disease, drug discovery, visualization, web application
INTRODUCTION
Gene set enrichment analysis is a common genomic analysis method, in which an input gene list is queried against libraries of annotated gene sets with the goal of identifying gene sets which significantly overlap with the input genes (Subramanian et al., 2005). Enrichr (Chen et al., 2013; Kuleshov et al., 2016) is a widely used gene set search engine containing a large collection of gene sets and gene set libraries for the purpose of performing such analyses. Enrichr currently contains a collection of ~400,000 annotated gene-sets organized into ~300 gene-set libraries. The large collection of annotated genes within Enrichr facilitates access to rich knowledge about individual genes, as well as gene sets centered on terms such as drugs, diseases, side effects and other phenotypes, and biological processes.
The large collection of annotated gene sets within Enrichr also allows for knowledge imputation about gene function for understudied genes. This can be done via machine learning strategies, where some of the assembled “attributes” about genes are used as features, and other datasets are used as the class to predict. This approach was demonstrated for several applications (Rouillard et al., 2016). Another important feature of Enrichr is the speed of the returned enrichment results, and the ease of programmatic access. The quick speed of computing enrichment results is enabled by several code optimization strategies. Enrichr can become a plug-in into other tools. While most users of Enrichr use the website, submitting gene sets one at the time, there are also many advanced users who access Enrichr via its API. In this protocol we provide instructions on how to embed an Enrichr button within web-based applications. This enables the community to offer Enrichr as a component of other bioinformatics tools and services. Enrichr provides the enrichment analysis results in various forms with interactive visualizations. Enrichr visualizations are implemented with the Data-Driven Documents (D3) JavaScript library (Bostock et al., 2011) to create interactive vector graphics figures. The enrichment results from Enrichr are visualized as interactive bar graphs, as a canvas that visualizes all terms on a grid (Tan et al., 2013) where each tile represents a term and where the tiles are organized by gene-set content similarity, as a network of enriched terms, and as a heatmap using Clustergrammer (Fernandez et al., 2017). All these plots are interactive and are made available for download. Such an assortment of visualization methods provides users with different ways to extract more knowledge from their gene sets.
In the article we provide several recipes to guide users to extract the most out of Enrichr for their gene and gene set analysis tasks. In Basic Protocol 1 we describe how to upload a gene set for analysis with Enrichr. Basic Protocol 1 explains to the user how to interpret the Enrichr results and comprehend the wide variety of visualization options. Basic Protocol 2 describes how to search for either a particular gene or another biological term within Enrichr. Basic Protocol 3 demonstrates how to analyze RNA-seq data with BioJupies (Torre et al., 2018) to generate differentially expressed gene sets that can then be analyzed with Enrichr. Basic Protocol 4 provides an overview on how to analyze gene sets from model organisms or convert gene sets between model organisms for further analysis with modEnrichr (Kuleshov et al., 2019). Basic Protocol 5 navigates the user through Geneshot (Lachmann et al., 2019) to access Enrichr results for literature search related terms or predicted genes related to any search term. Basic Protocol 6 teaches the user how to access Enrichr through ARCHS4 (Lachmann et al., 2018) by searching for a gene or a key term. Basic Protocol 7 teaches the user how to automatically create visualizations of their enrichment analysis results with a dedicated Appyter. This new feature of Enrichr directs users to an executed Jupyter Notebook that can be accessed directly from the Enrichr results pages. Basic Protocol 8 shows how to access Enrichr programmatically through the API, allowing users to input gene sets, conduct enrichment analyses, and download enrichment results using the command line interface with Python. Finally, Basic Protocol 9 shows how to add an Enrichr button to an external website bypassing the intermediate steps of running the analysis through the Enrichr website.
BASIC PROTOCOL 1
Analyzing lists of differentially expressed genes from transcriptomics, proteomics and phosphoproteomics, GWAS studies, or other experimental studies
The Enrichr web application can be found at https://maayanlab.cloud/Enrichr/. Enrichr enables users to submit lists of human or mouse genes to compare against numerous gene set libraries of known biological function, such as pathways, diseases, or gene sets regulated by transcription factors. The matching gene sets are ranked by different methods that assess the similarity of the input gene set with all other gene sets in each library. Several tools that we and others developed (Gundersen et al., 2015; Torre et al., 2018) can aid users process their raw data into gene signatures that can be then submitted to Enrichr for analysis; For example, differential gene expression analysis tools to process RNA-seq or microarray data. For RNA-seq, users can process their data with BioJupies (Torre et al., 2018) (https://amp.pharm.mssm.edu/biojupies/) or the Bulk RNA-seq Appyter (https://appyters.maayanlab.cloud/#/Bulk_RNA_seq) into signatures that can be analyzed with Enrichr. Such RNA-seq data analysis with these tools can start with a table containing gene counts or begin by uploading and processing the raw FASTQ format files. For microarrays, the Chrome extension GEO2Enrichr (Gundersen et al., 2015) (https://amp.pharm.mssm.edu/g2e/) is available to process studies from the NCBI Gene Expression Omnibus (GEO) (Edgar et al., 2002) into gene expression signatures.
Necessary Resources:
Hardware – Desktop or a laptop computer, or a mobile device, with a fast Internet connection
Software – An up-to-date web browser such as Google Chrome (https://www.google.com/chrome/), Mozilla Firefox (https://www.mozilla.org/en-US/firefox/), Apple Safari (https://www.apple.com/safari/), or Microsoft Edge (https://www.microsoft.com/en-us/edge).
Protocol steps and annotations:
-
1
Navigate to the Enrichr homepage (https://maayanlab.cloud/Enrichr/). The current number of libraries, terms, and lists analyzed are presented to the user at the top of the home page (Figure 1).
Fig 1.
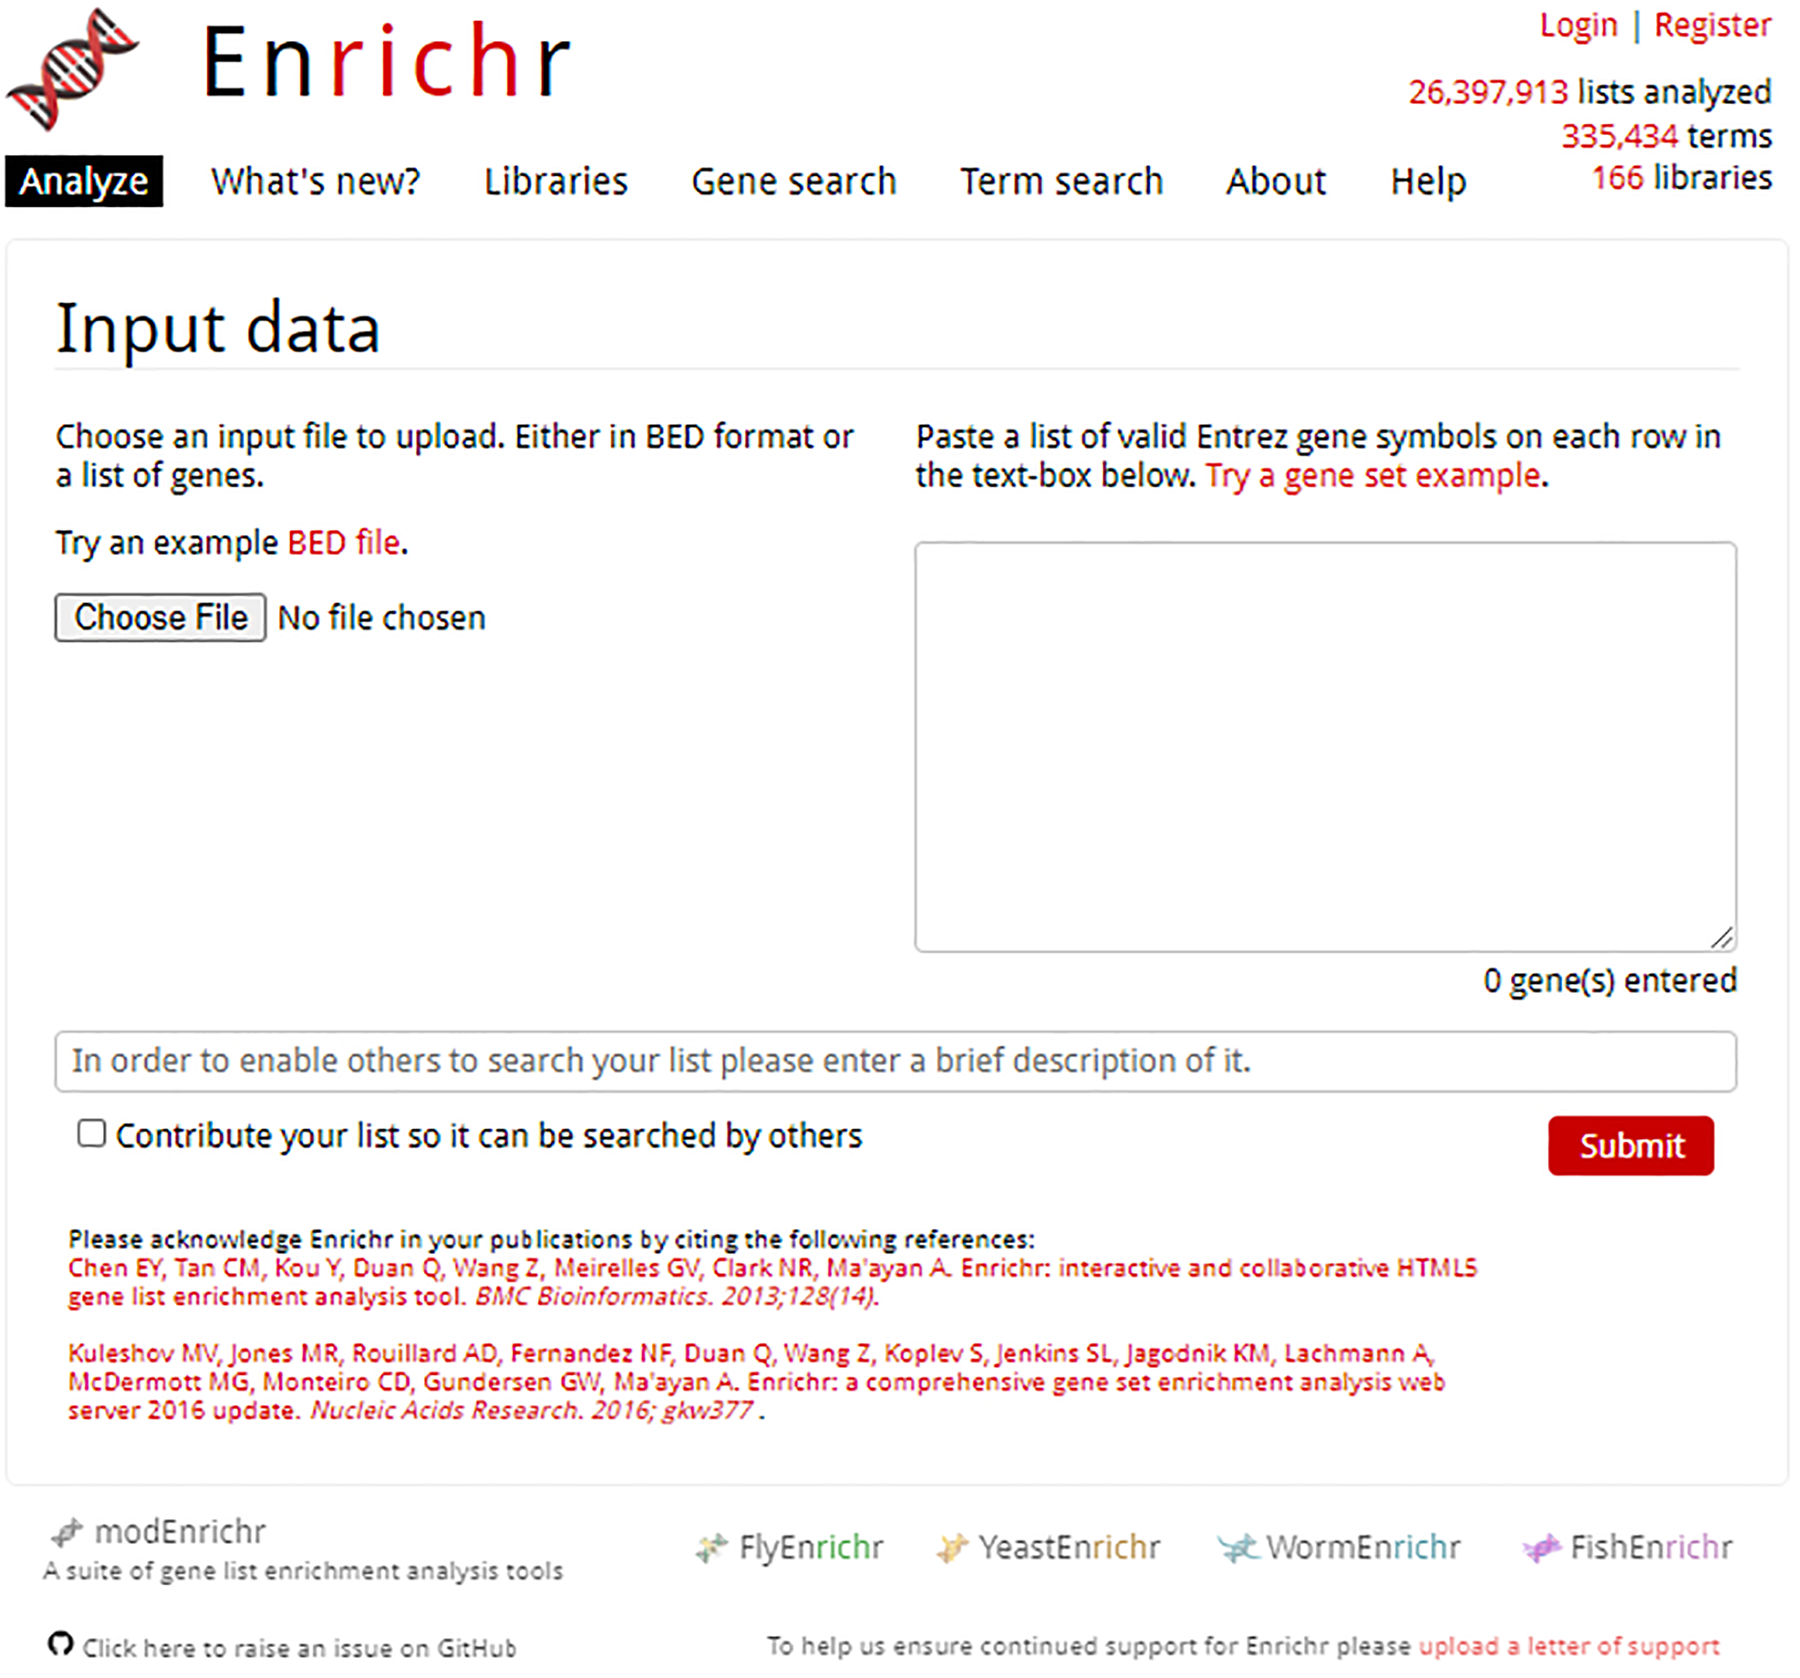
Homepage of Enrichr. Users can upload a file with the “Choose file” button on the left, or by pasting a gene set list into the provided text box.
Creating an account to revisit analyses
-
2
Users can re-access enrichment analysis results without the URL by creating an account to see the lists they previously submitted with their analyses. Clicking on “Register” located on the top right of the page users will be prompted to enter their email address, password, name, and institution (Figure 2).
There are no restrictions on password creation.
-
3
To access your account information, click your name at the top right of the page. The default view displays past gene lists and their creation date along with an option to re-view the Enrichr analysis results by clicking on the list description (Figure 3). Additional actions for viewing the gene list, contributing the gene list to the crowd-sourced library, copying the link to the Enrichr analysis, or deleting the gene list is available.
-
4
To change account information, click on “Account Settings” at the top of the page. Here, you can change your account information such as email, name, institution, and password (Figure 4).
Fig. 2.
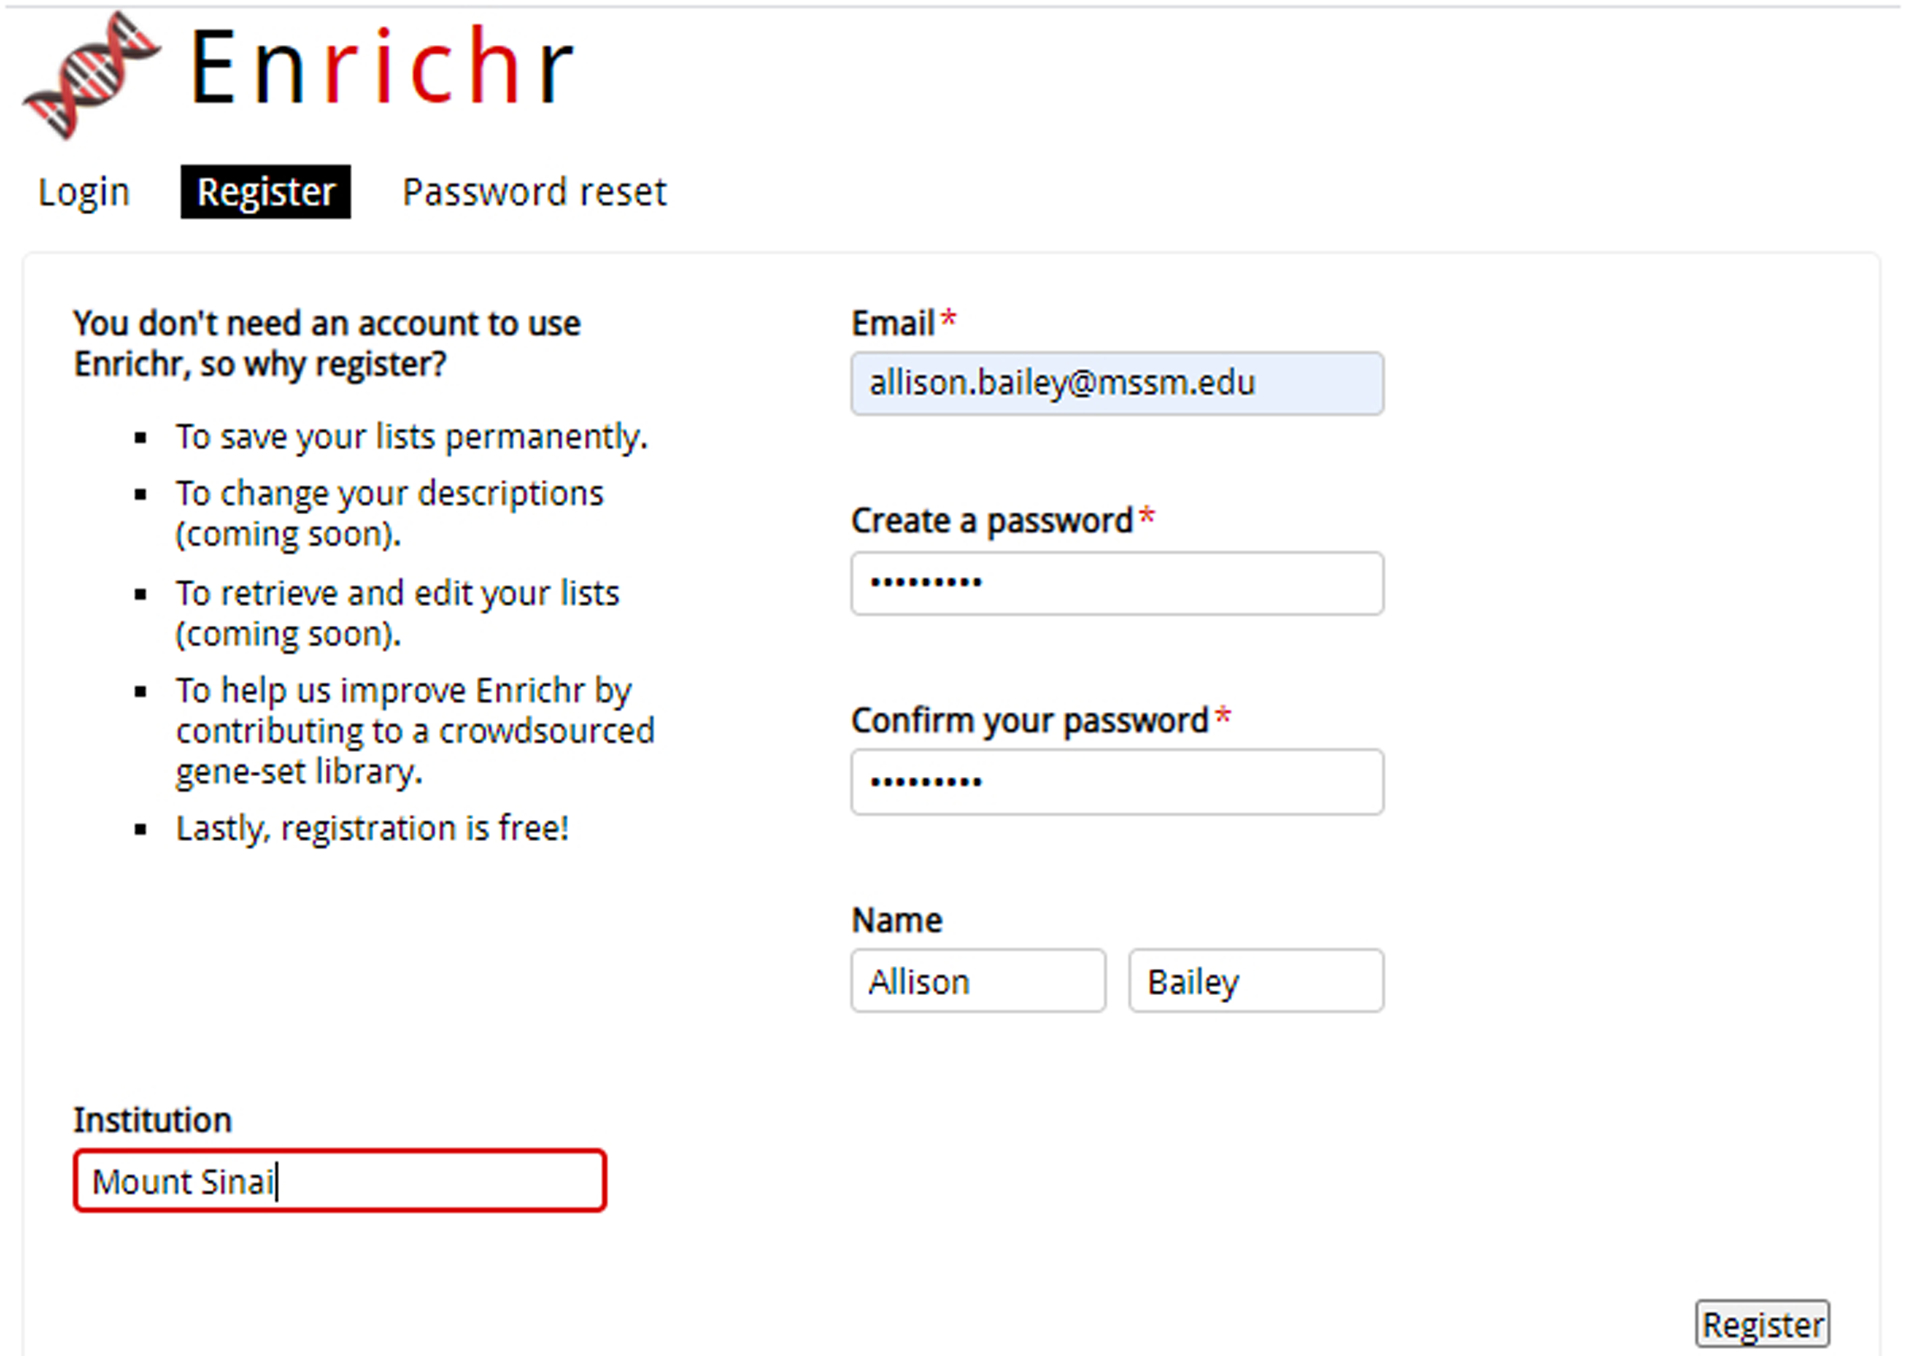
Registration page to create a new account with Enrichr.
Fig. 3.
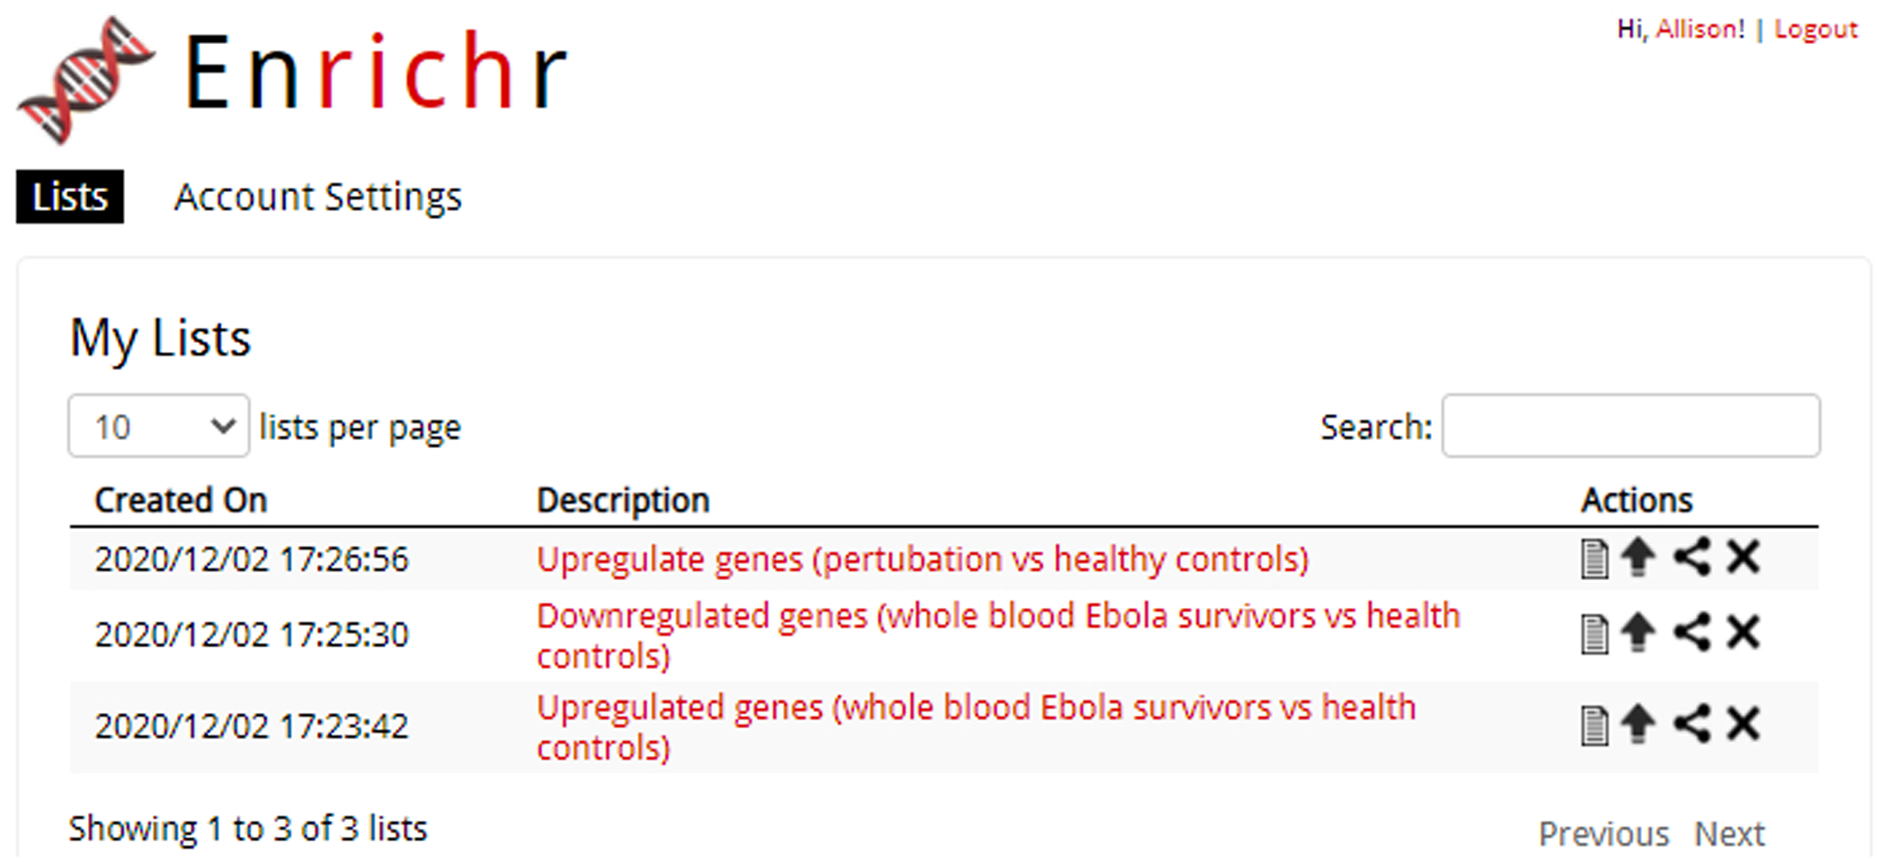
Access a list of previously submitted gene lists by clicking your name in the top-right corner of any page. Additional actions to perform on your gene list are adjacent to each submitted list.
Fig. 4.
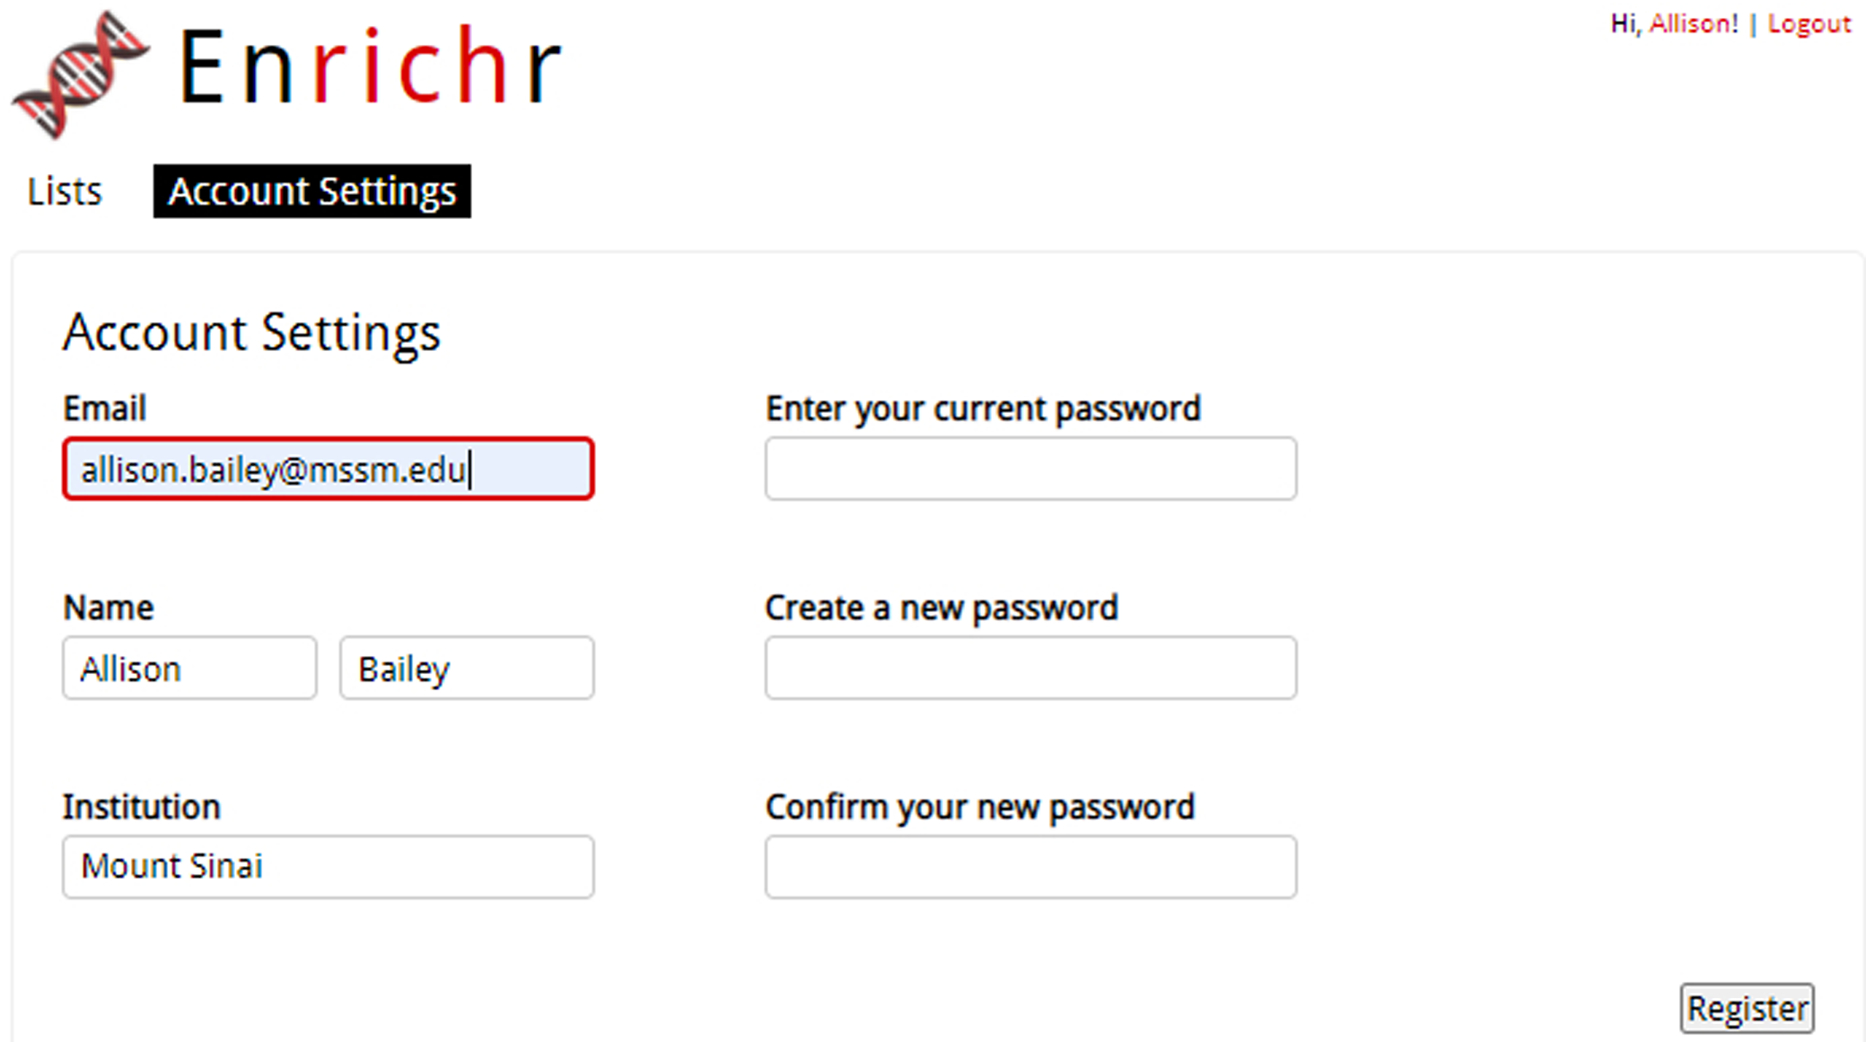
The Account Settings page lets users change personal information they want associated with their profile.
Uploading gene sets
-
5
Users are presented with two options to submit their gene set: uploading an input file or pasting a list of genes into a text box. To upload a gene set input file, click the button “Choose File” under the Input Data heading, and then select an input file from the local files on your computer. There is also an option to upload BED files from ChIP-seq experiments. For BED files, choose the species from which your ChIP-seq data was collected. You can select one of the five options: Human hg18, Human hg19, Human hg38, Mouse mm9, or Mouse mm10. This is the reference genome that will be used to convert the reads in the BED file into genes. Select the maximum number of genes you would like to submit to Enrichr. You can choose from these three options: 1000, 2000, or 500. Enter a short description about your gene set in the text field (optional) and click the “Submit” button.
Enrichr accepts genes from H. sapiens or M. musculus encoded in the Entrez Gene Symbol or the HGNC Gene Symbol format. Input files must be in the BED file format or TXT file format to successfully upload. For TXT files, genes must be on their own row; otherwise, an error will be generated “Failed to process user list (400)”. The user is given the option of allowing the submitted gene list to be searched by others. To grant permission for your list to be reused, make sure to enter a clear description of your gene set, and check the box before clicking the “Submit” button. Note that the submitted list will be subject to review before it is added to Enrichr for search by others.
-
6
Alternatively, paste the gene symbols into the text box on the home page (Figure 5). Describe the list using the given text field and click the “Submit” button.
Make sure that the pasted genes are in the Entrez Gene Symbol or the HGNC Gene Symbol format and only one gene is entered per row. The user is given the option of allowing the submitted gene list to be searched by others.
-
7
The gene set library results are displayed initially as a grid of bar charts with a summary of the top enriched terms for each gene set library in each category (Figure 6). Users can select from one of the following categories of gene set libraries they would like to explore at the top of the page: Transcription, Pathways, Ontologies, Diseases/Drugs, Cell Types, Legacy, and Crowd. The top five most significantly enriched terms are displayed in red or gray color bars. Gray colored bars indicate that terms have not passed statistical significance. The user’s description of the drug set is printed at the top of the page.
-
8
Users can share their results by clicking the share icon immediately right of the gene list description name at the top of the page.
-
9
Users can also obtain access to the submitted list by clicking the notebook icon near the share icon.
-
10
When clicking on the bars, the results are re-sorted by other ranking methods. There are three methods of ranking the results: The Fisher’s exact test, odds ratio, and a method that combines the two.
Fig. 5.
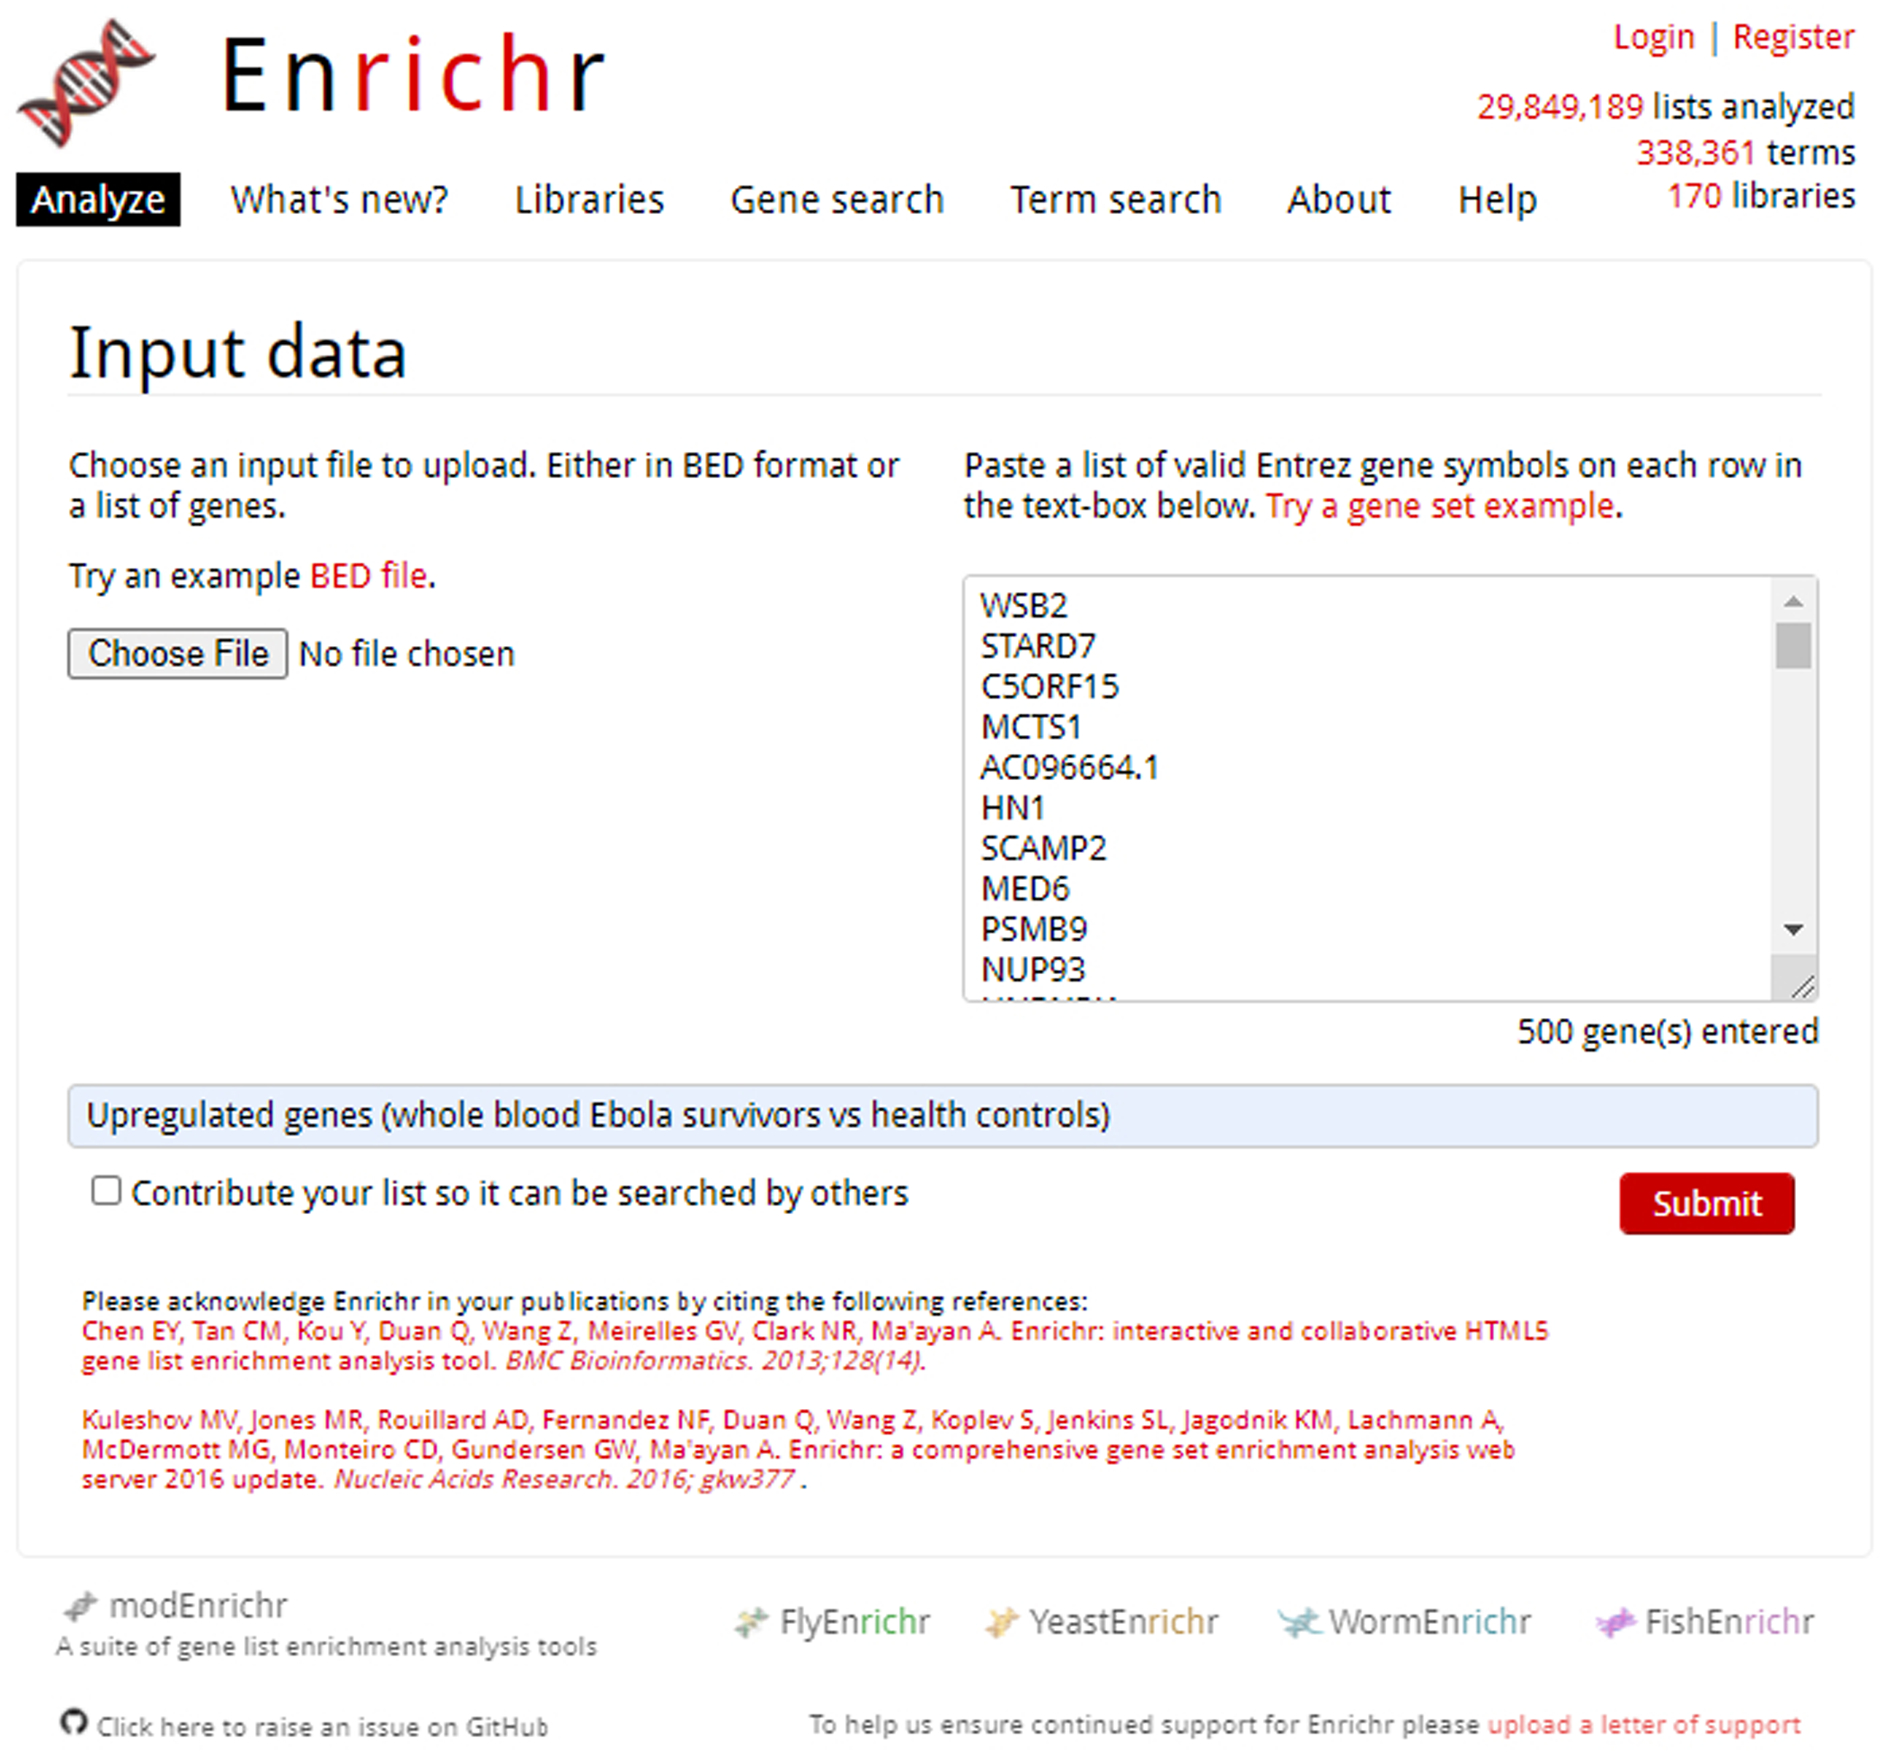
Enrichr homepage with pasted gene list in upload box. All genes are Entrez gene IDs with one gene on each row. A title for the gene list is written immediately below.
Fig 6.
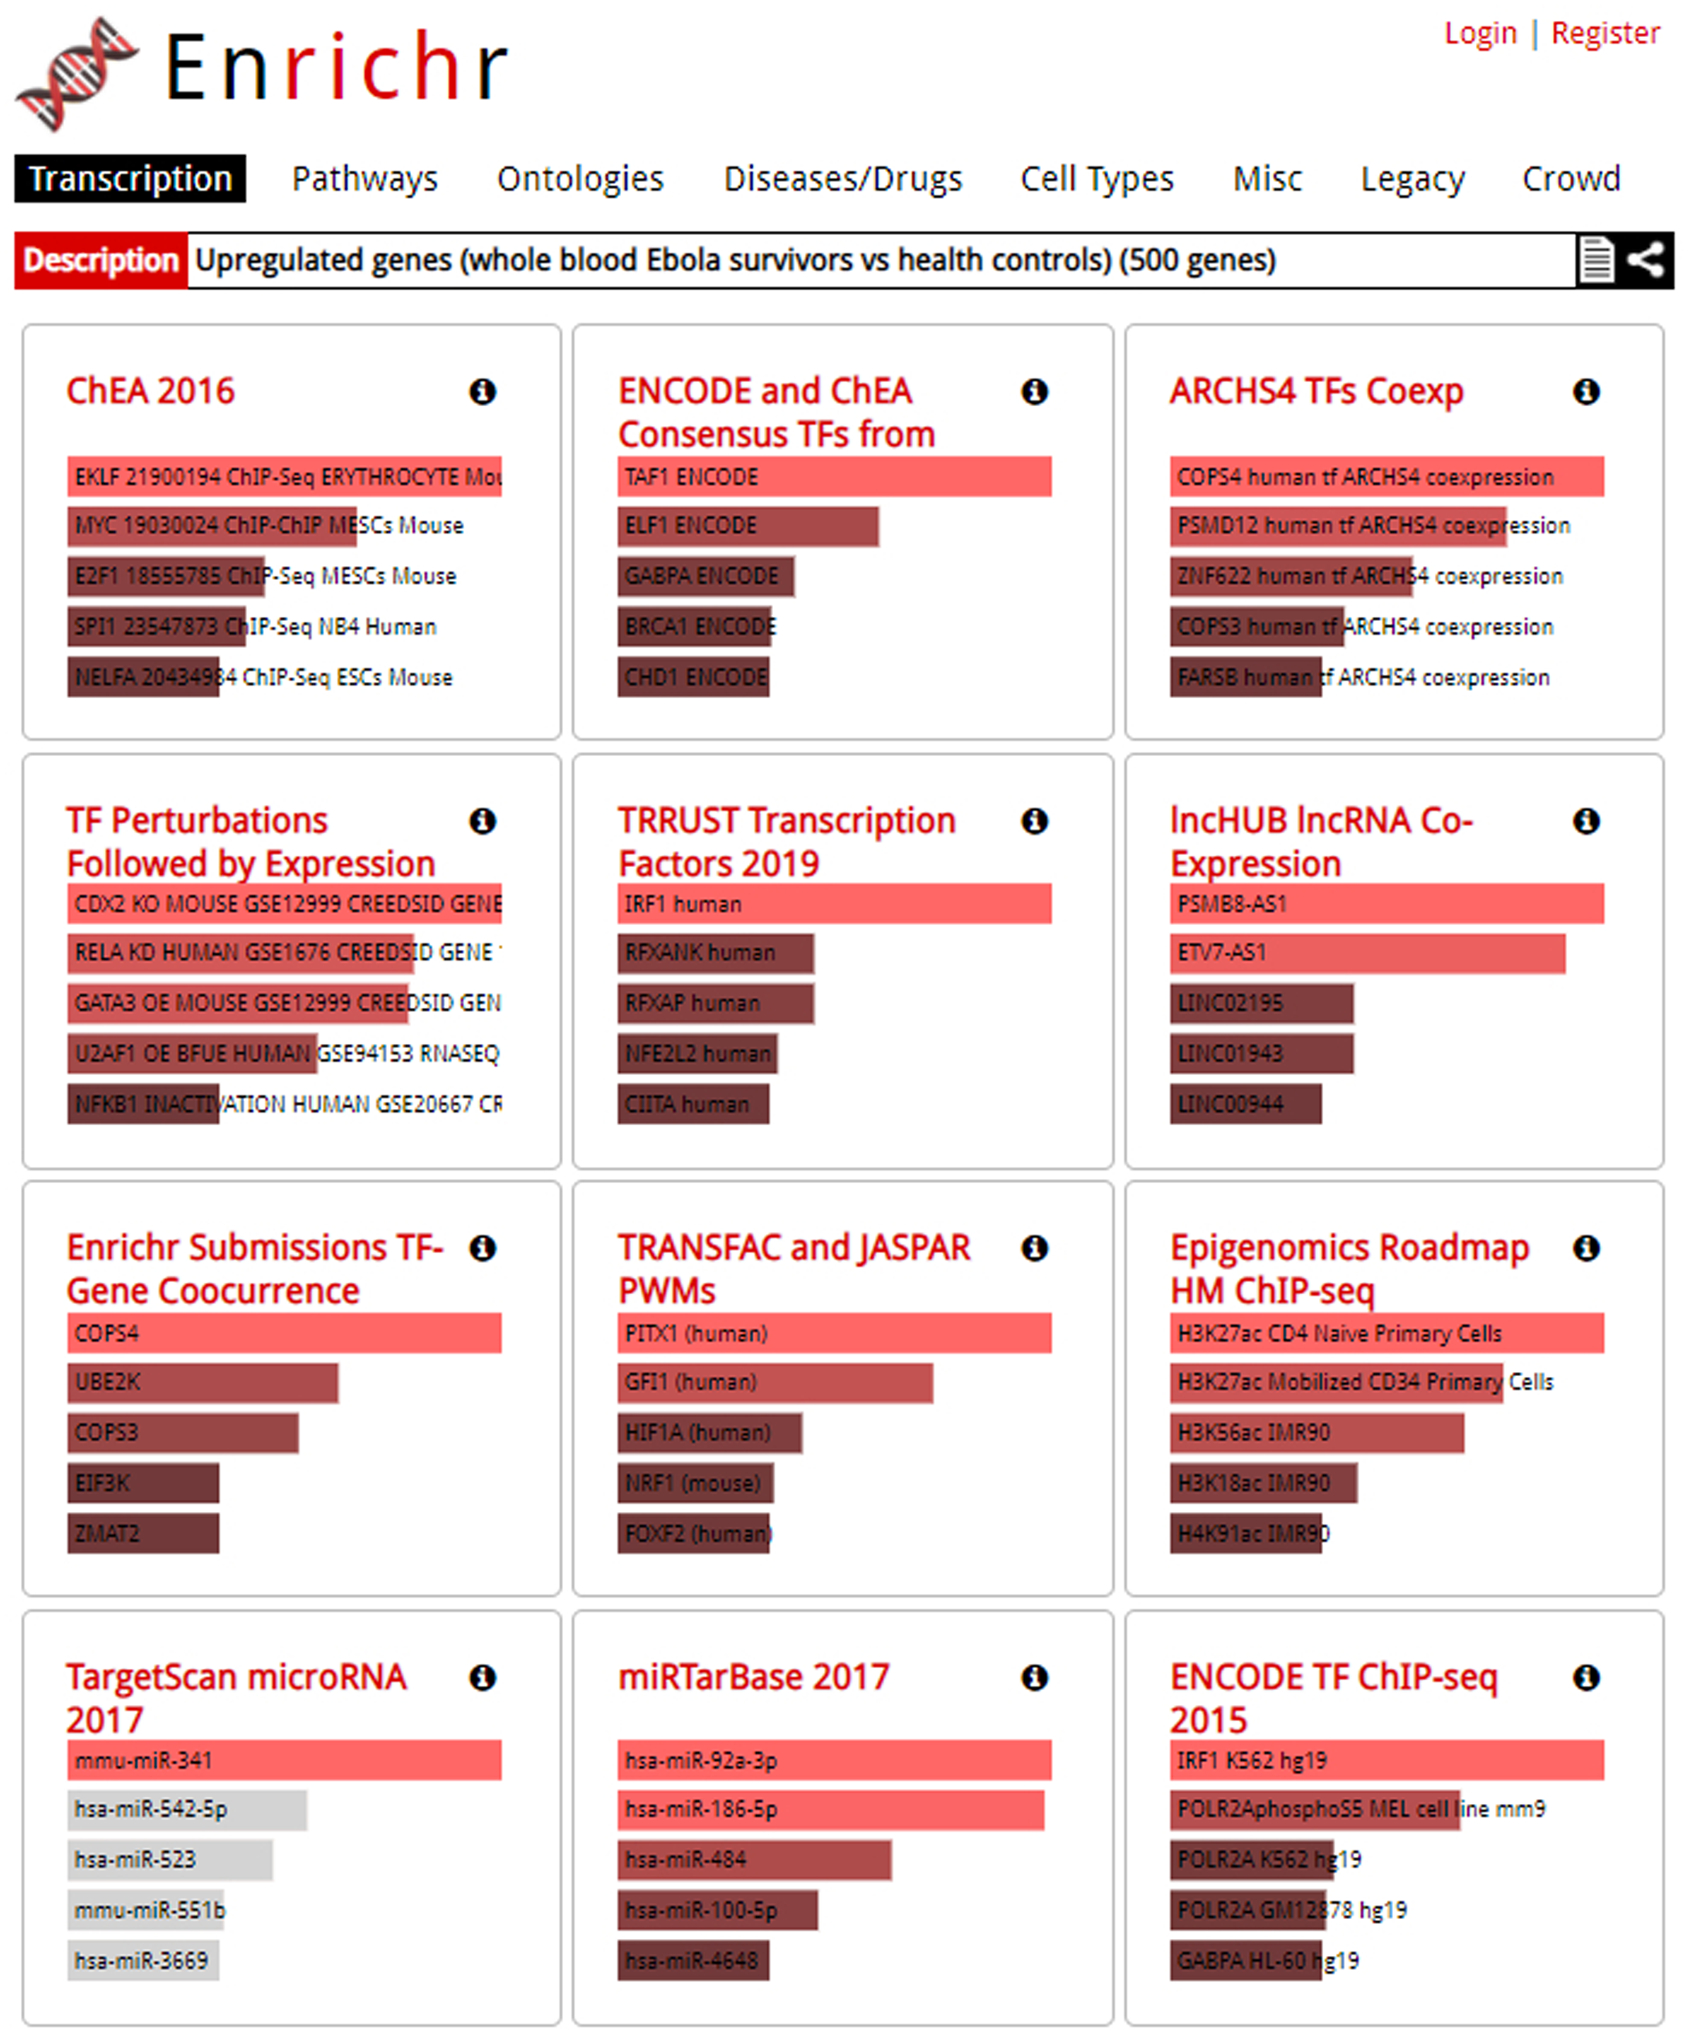
Results page. Users may explore varying categories by clicking through the options at the top of the page. Gene set libraries are listed in tiles, with more significant terms longer and in a brighter color.
Exploring and understanding the various visualizations
-
11
Clicking on a gene set library term brings the user to a more detailed analysis page with a bar graph sorted by the top 10 p-value rankings (Figure 7). You may switch between multiple visualizations: bar graph, table, grid, network, Appyter, and clustergram.
-
12
The “Bar Graph” option displays a ranking of the top ten enrichment results through a bar graph (Figure 7). When in the bar chart mode, hovering over a bar brings up four ranking parameters: p-value, q-value, odds ratio, and combined score. Clicking the bar graph visualization changes how the graph is sorted. The color of the bars can be changed by clicking the gear icon and selecting the desired color. The graph can be saved by clicking the desired image file type at the top right corner.
Options of bar graph ranking are by p-value ranking, q-value ranking, odds ratio ranking and combined score ranking. The bar graph represents high significance based on color and length. The longer and lighter the bar, the more significant the term. Gray bars indicate the term is not statistically significant. You can save the bar chart in one of three image file types: SVG, PNG, or JPG.
-
13
Clicking the “Table” option produces a view of the enrichment analysis results as a table (Figure 8). The table is interactive, for example, the user can select the number of entries they wish to be displayed on the page: 10, 25, 50, or 100. Columns include index (the position of the term in the ranking), the term’s text, p-value, adjusted p-value, odds ratio, and combined score. Clicking a column will sort the table in ascending order; clicking it again will sort the table in descending order. The table can be exported as a tab-delimited file by clicking the “export entries to table”. The exported table contains the same information that is displayed, but with an additional column that contains the overlapping genes.
You can hover over each row to see genes that overlap. If the term is highlighted in red, you can view additional information from external sites. You can save the table in one of three image file types: SVG, PNG, or JPG.
-
14
Clicking on the “Grid” option pulls up a grid visualization of the enrichment results (Figure 9). The default grid is arranged by gene-set similarity, with more brightly colored points identified as more significant. Clicking on the grid toggles to an alternative view where the white dots represent significant terms and tiles are colored by their correlation score with their neighbors. Next to the visualization are the reported z-scores and p-values of how clustered the top 10 terms are on the grid. Highlighting a point reveals the term name.
The grid visualization may not be available for all gene-set libraries. Only the top 10 terms are shown. Users can toggle between different colors. You can save the table in one of three image file types: SVG, PNG, or JPG.
-
15
Clicking on the “Network” option brings up the network visualization option (Figure 10). Each node represents a term; connected nodes indicate some gene content similarity.
The network visualization may not be available for all gene-set libraries. You can save the table in one of three image file types: SVG, PNG, or JPG.
-
16
Clicking on the “Clustergram” option brings up the clustergram visualization (Figure 11). The clustergram is a heatmap that illustrates the association between the user-submitted input genes and the overlapping genes. The rows are the user-submitted input genes, the columns are the top enriched terms ranked by enrichment score as indicated by the length of transparent red bars above the enriched term name, and the cells indicate whether a gene from the input list overlaps with an enriched term.
Fig 7.
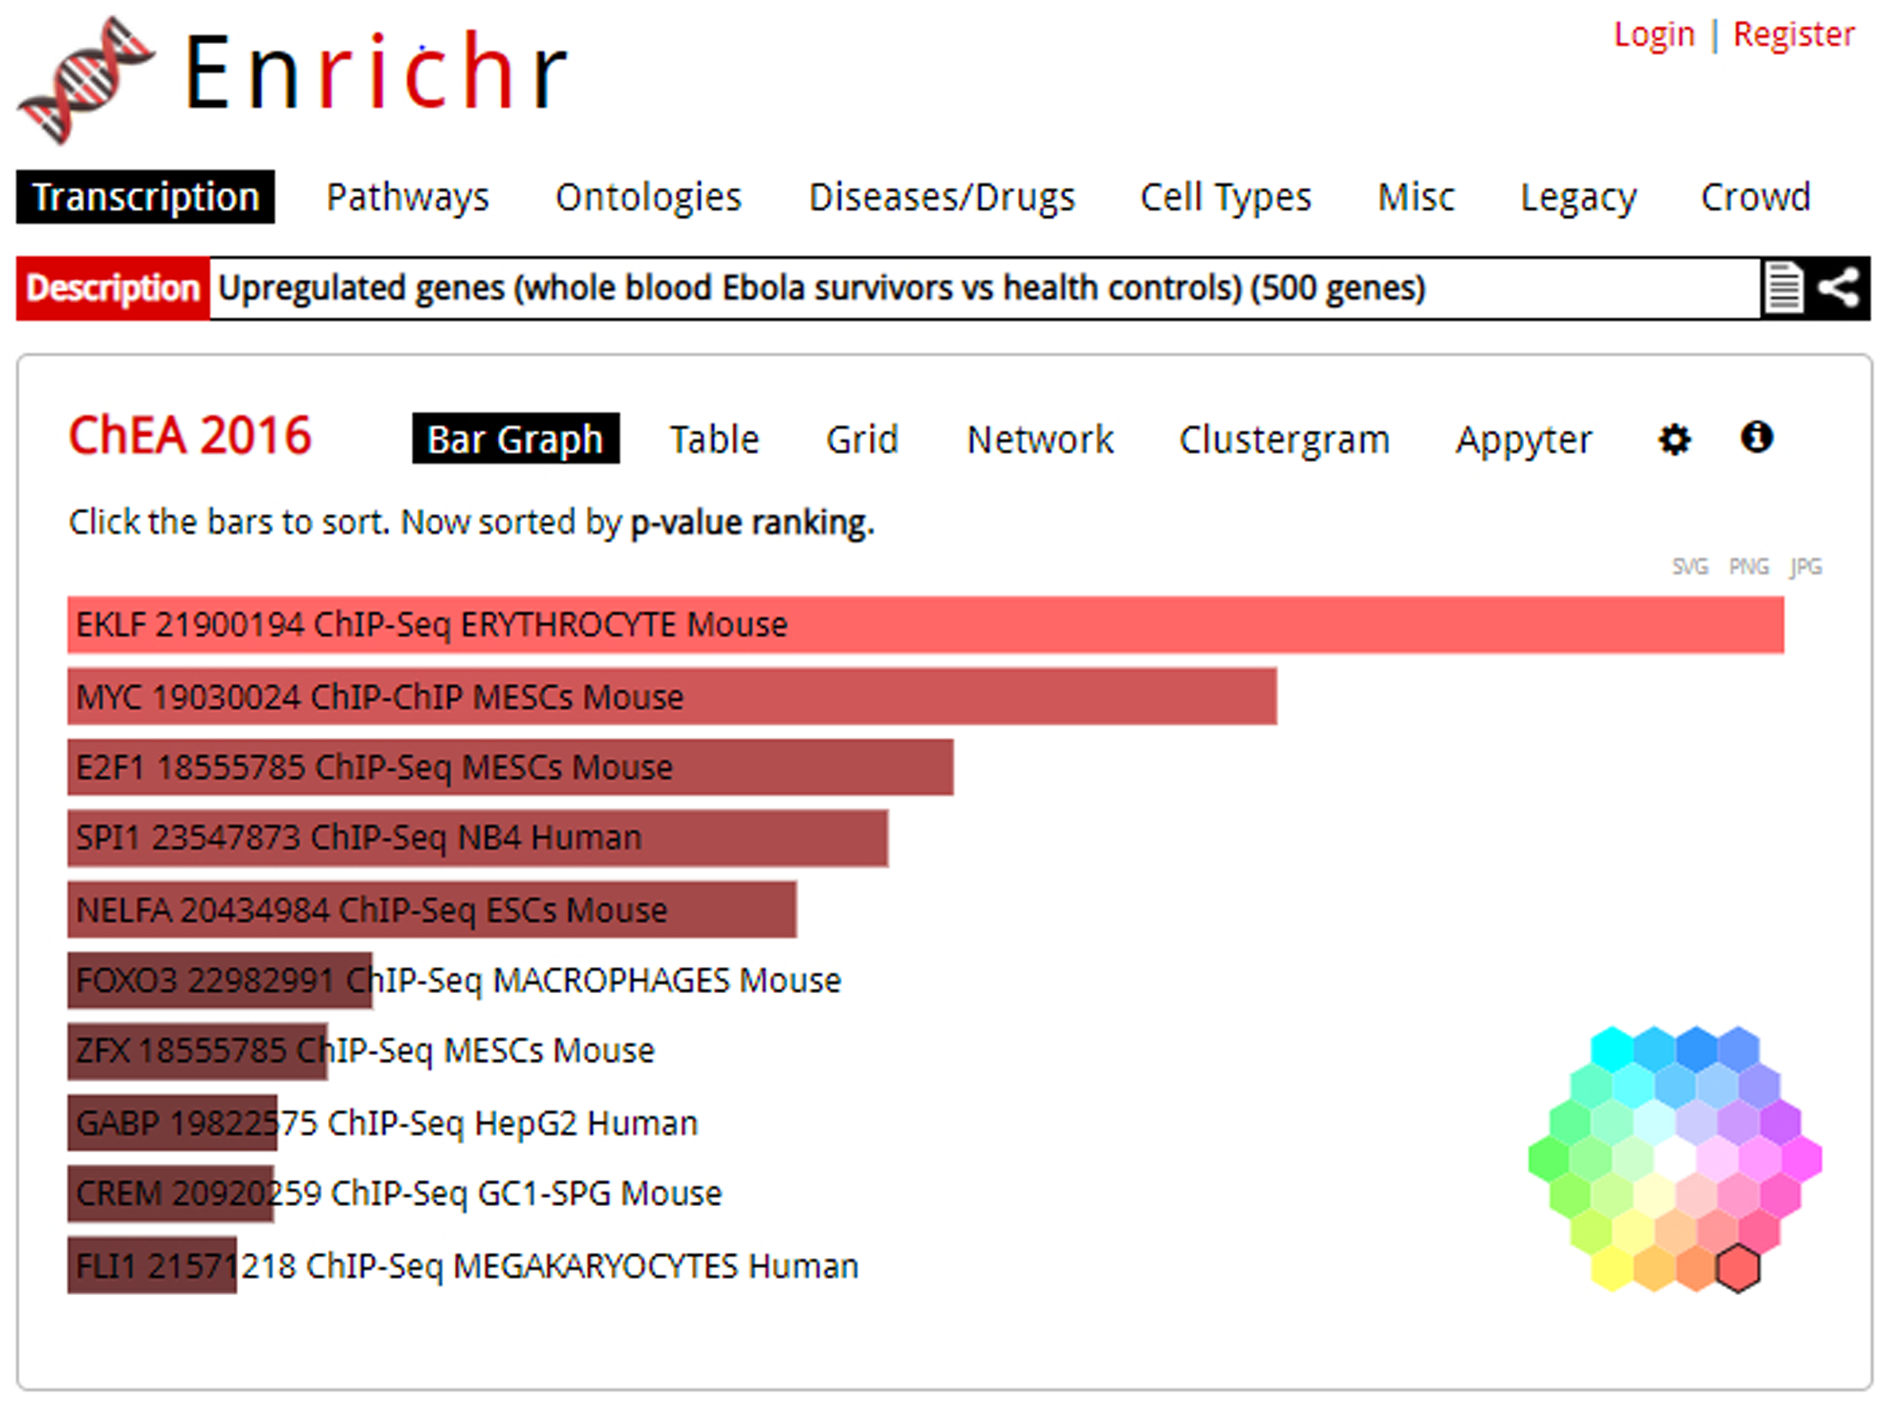
Detailed analysis of top 10 enriched terms displayed as a bar graph, with “Bar Graph” highlighted as the selected visualization. This is the default visualization when first clicking on a library. By clicking the cog icon in the top-right of the bar graph visualization, you can access the color wheel shown bottom left to change graph colors.
Fig. 8.
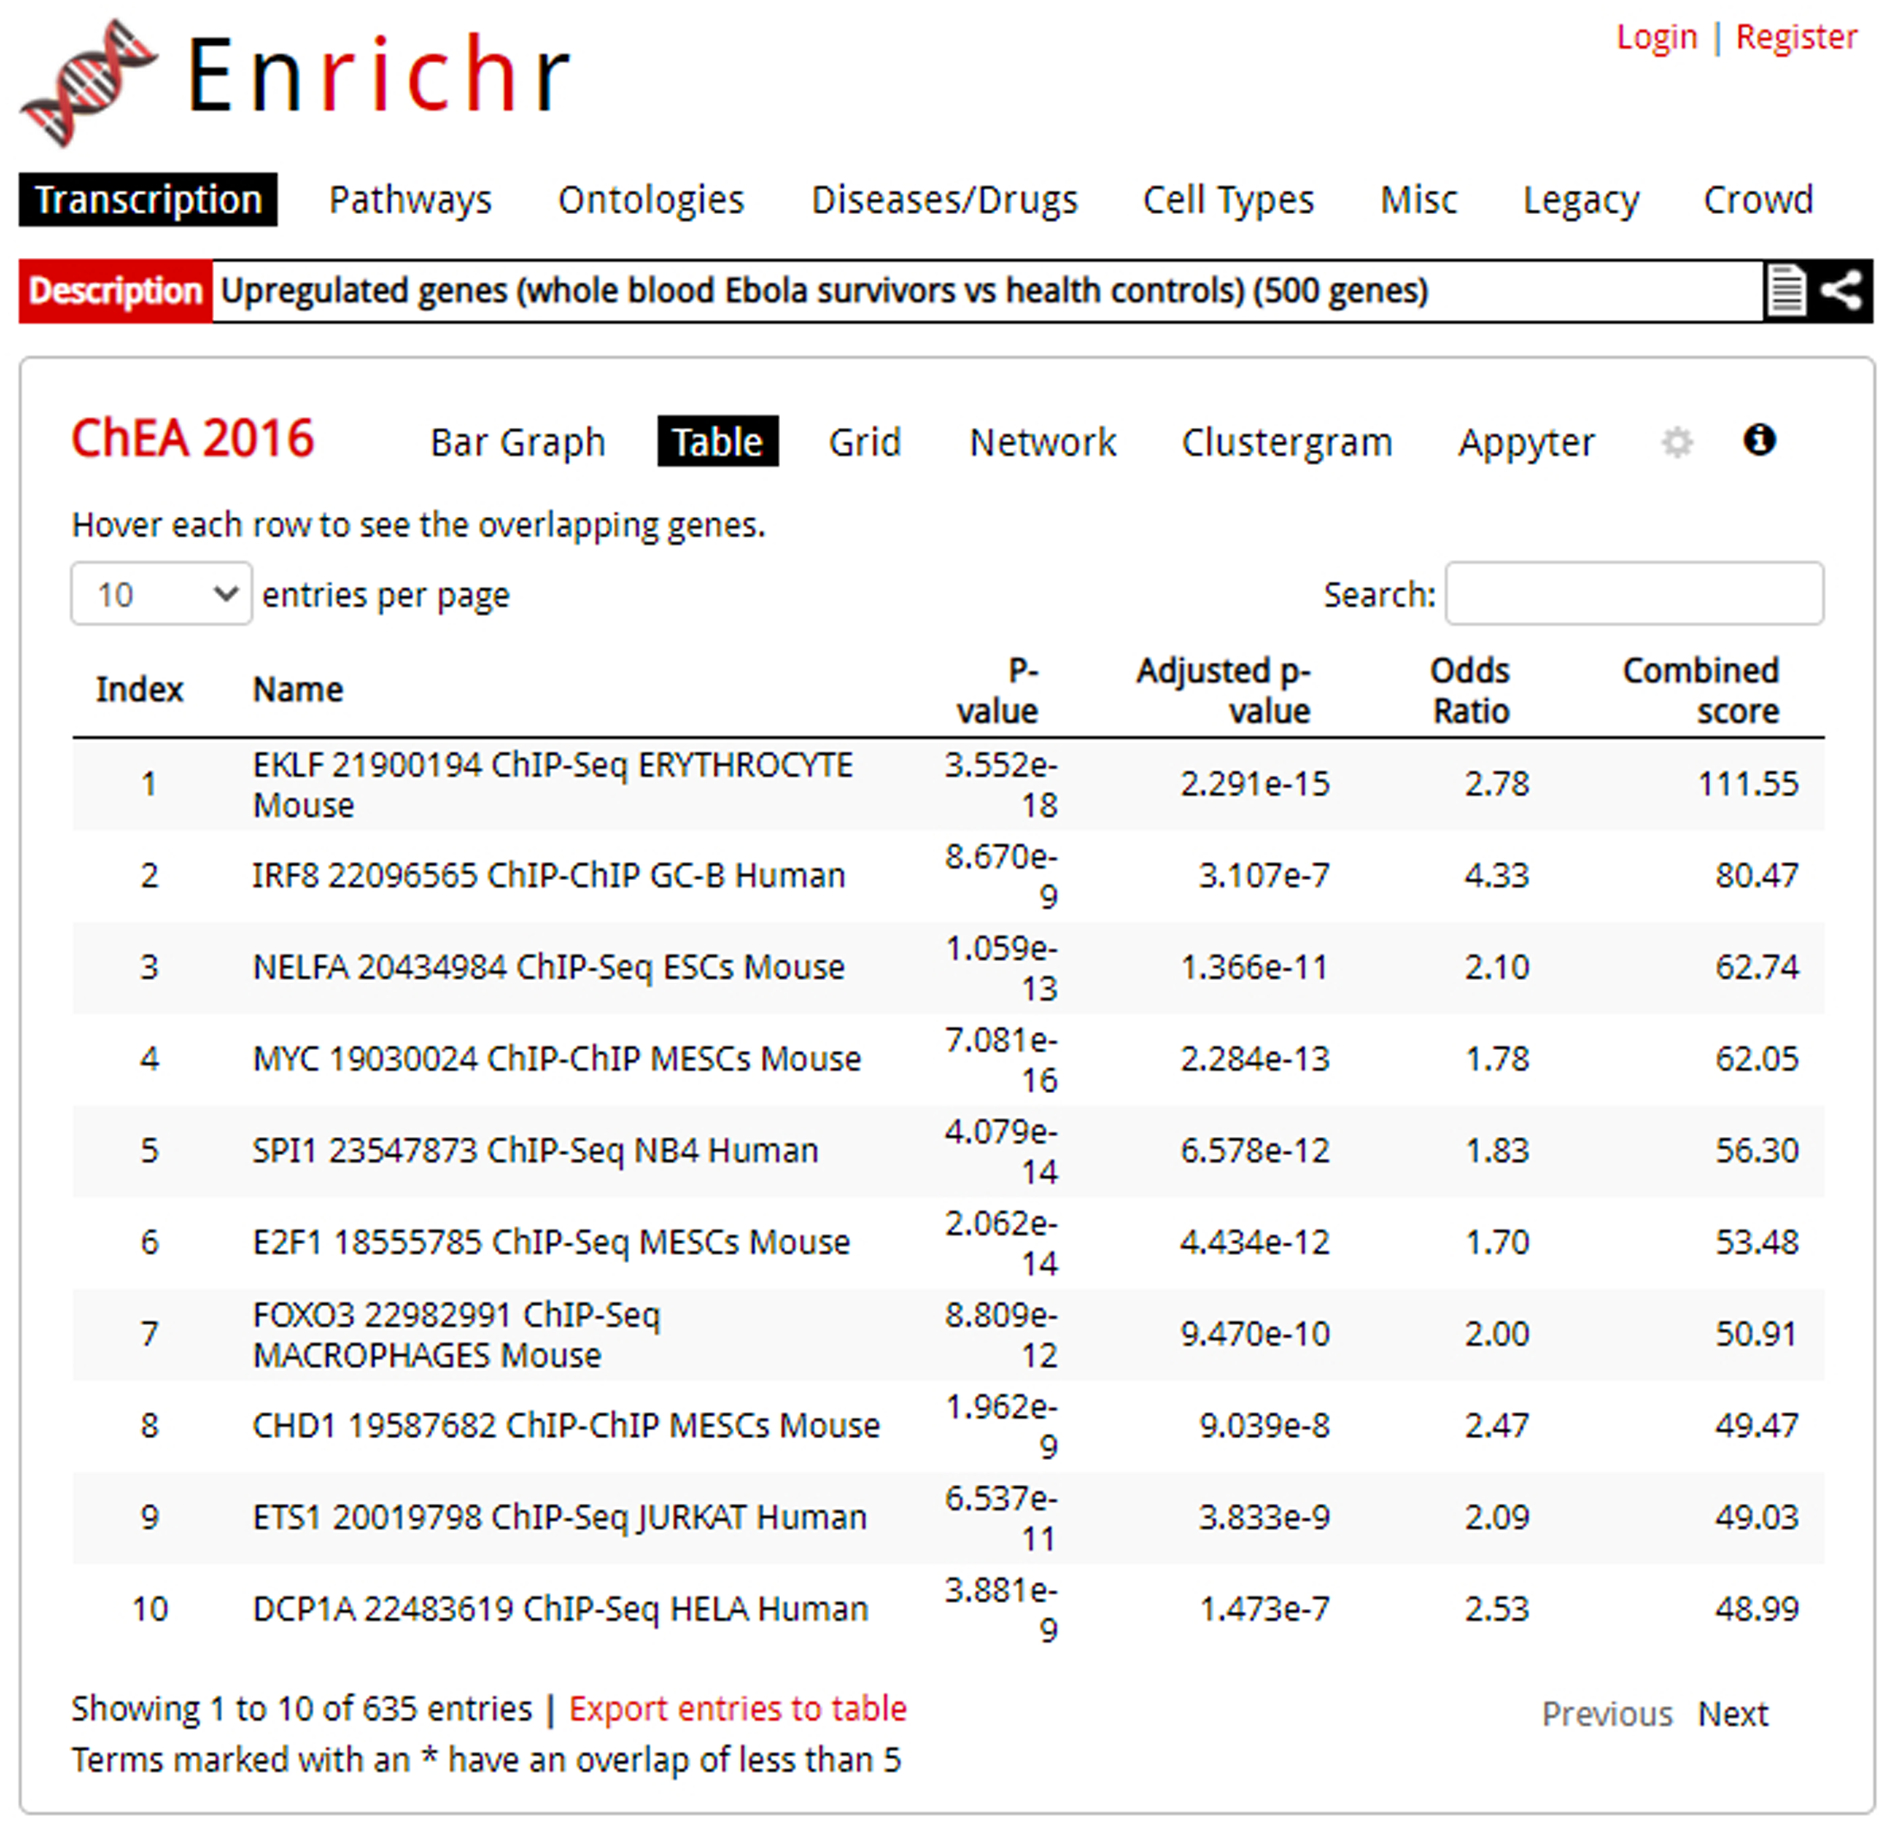
The table visualization of an enrichment analysis. Columns can be sorted by clicking a column header.
Fig. 9.
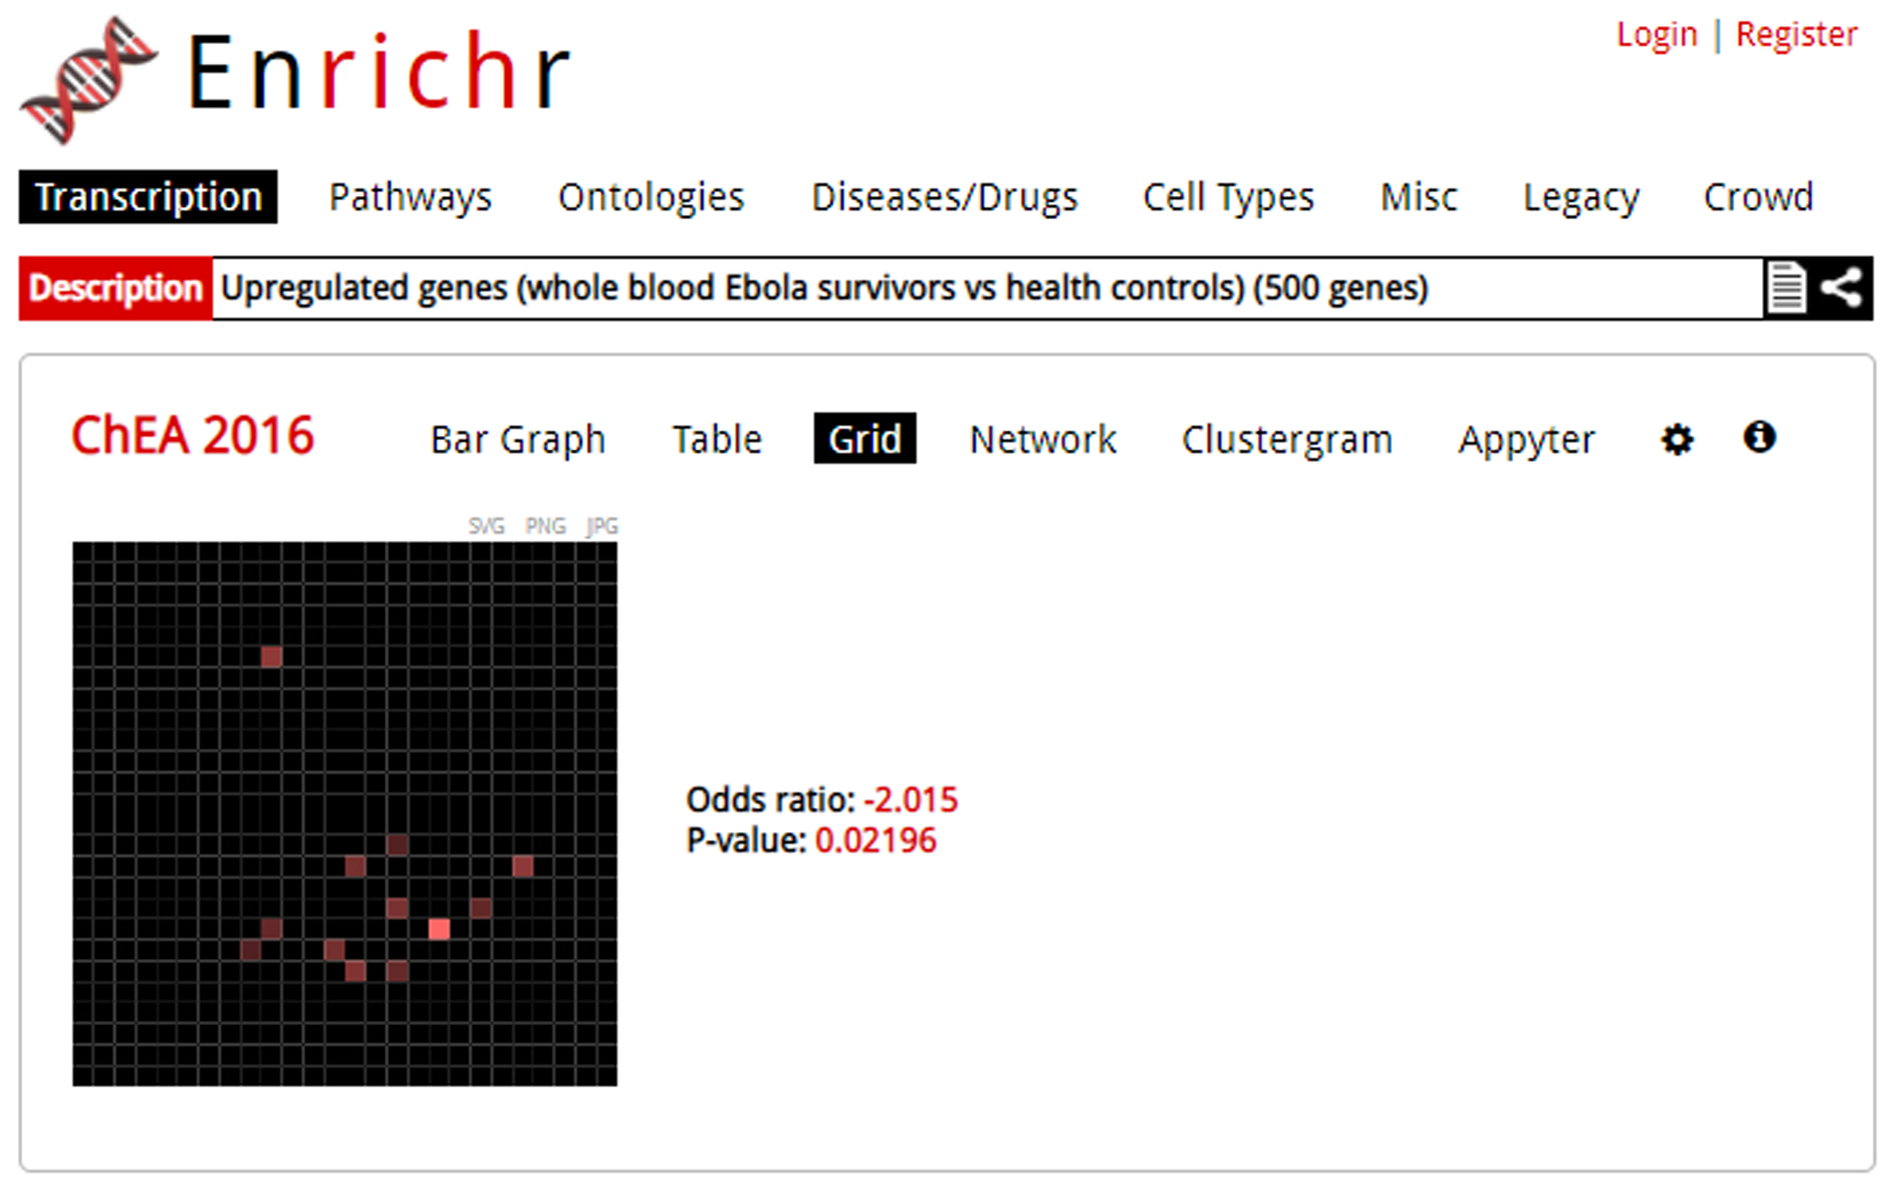
The grid visualization of an enrichment analysis. In this visualization, the top 10 ranked terms are arranged by gene similarity with brighter terms more significant.
Fig. 10.
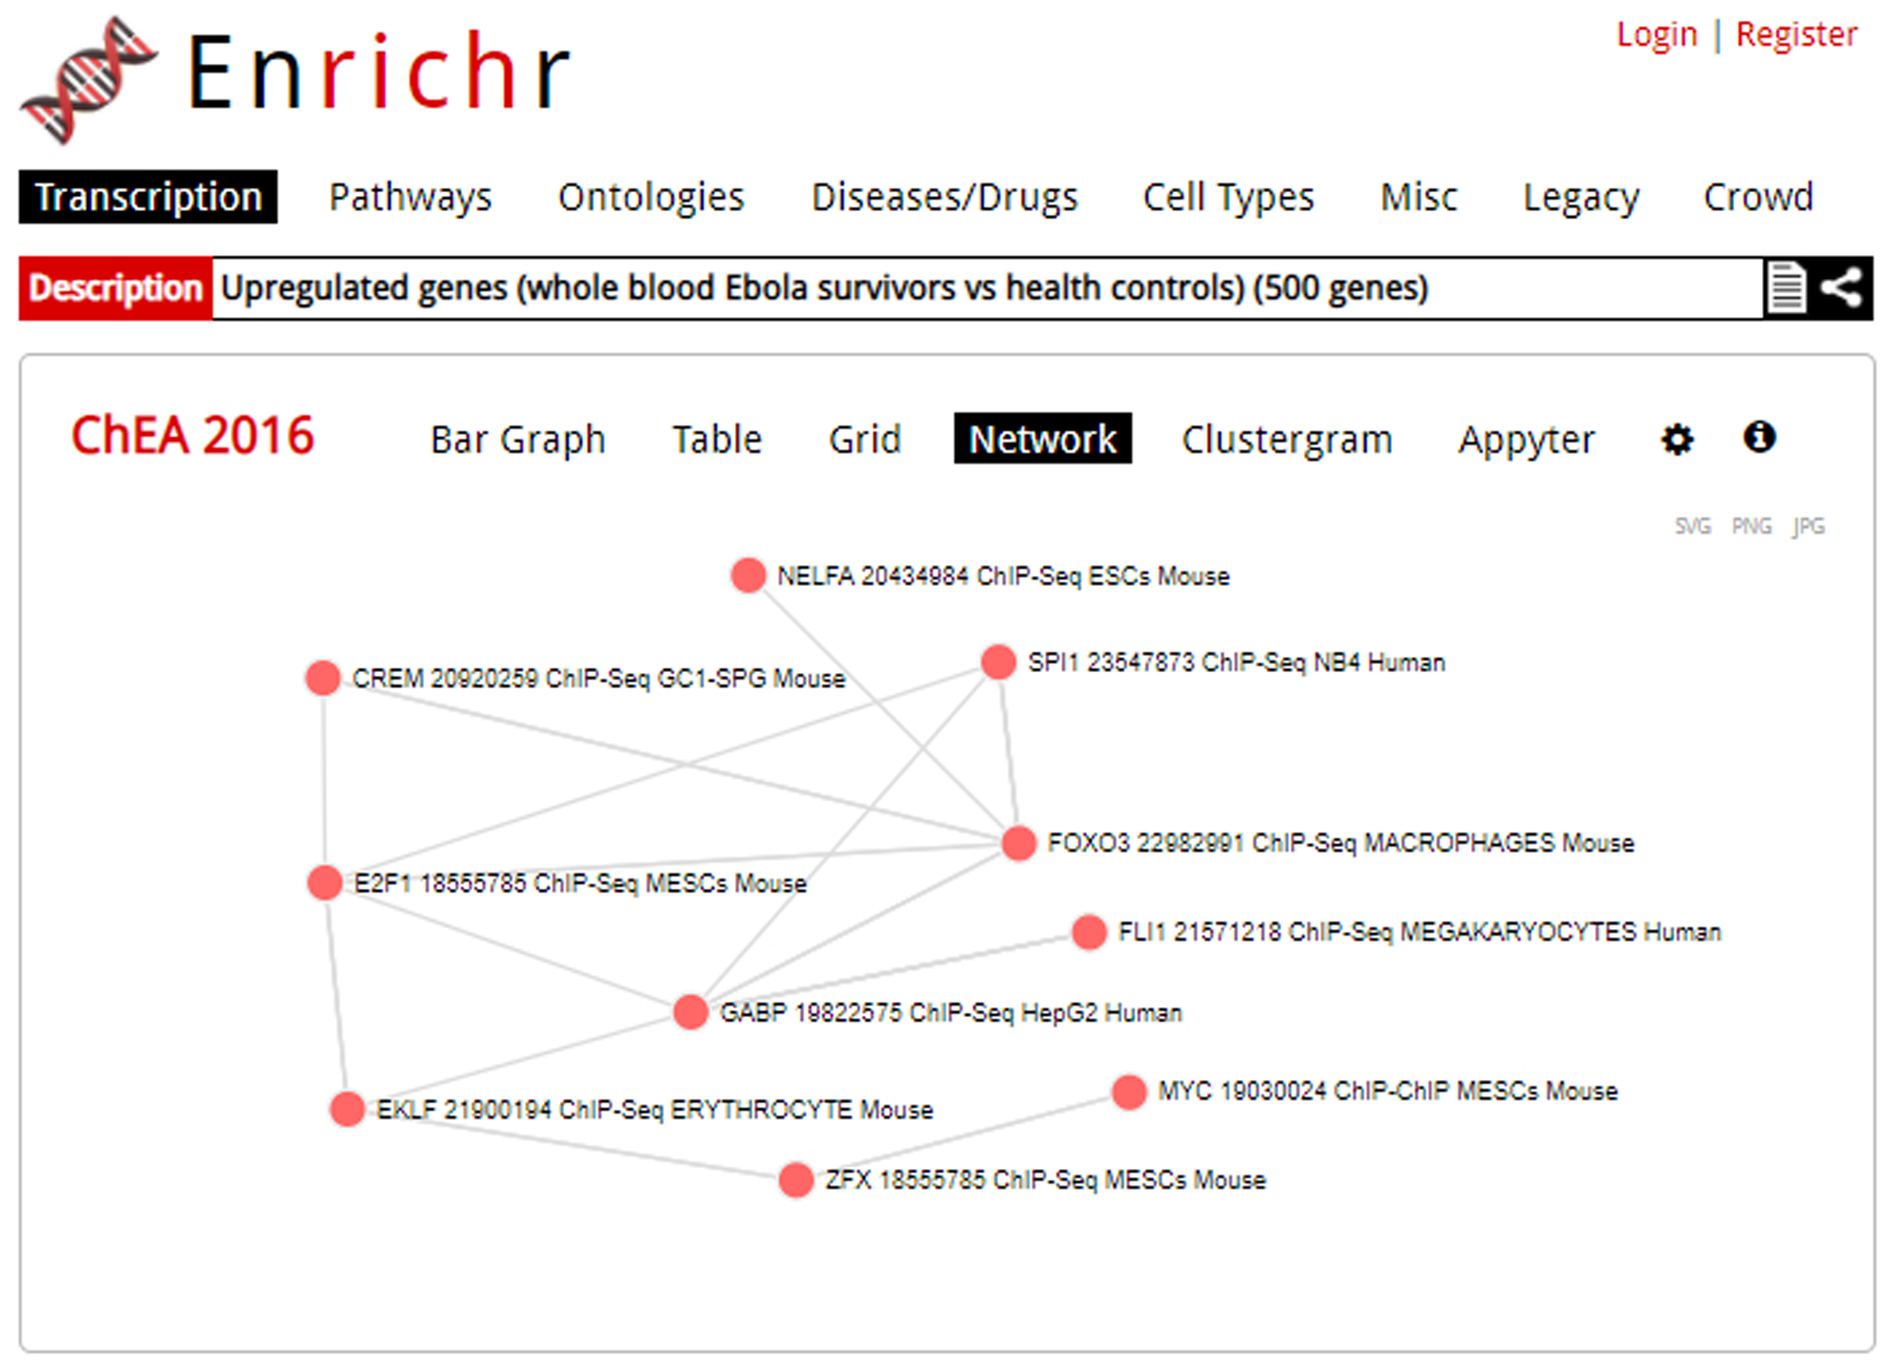
The network visualization of an enrichment analysis. Each node is a gene, and a link between nodes represents gene content similarity.
Fig. 11.
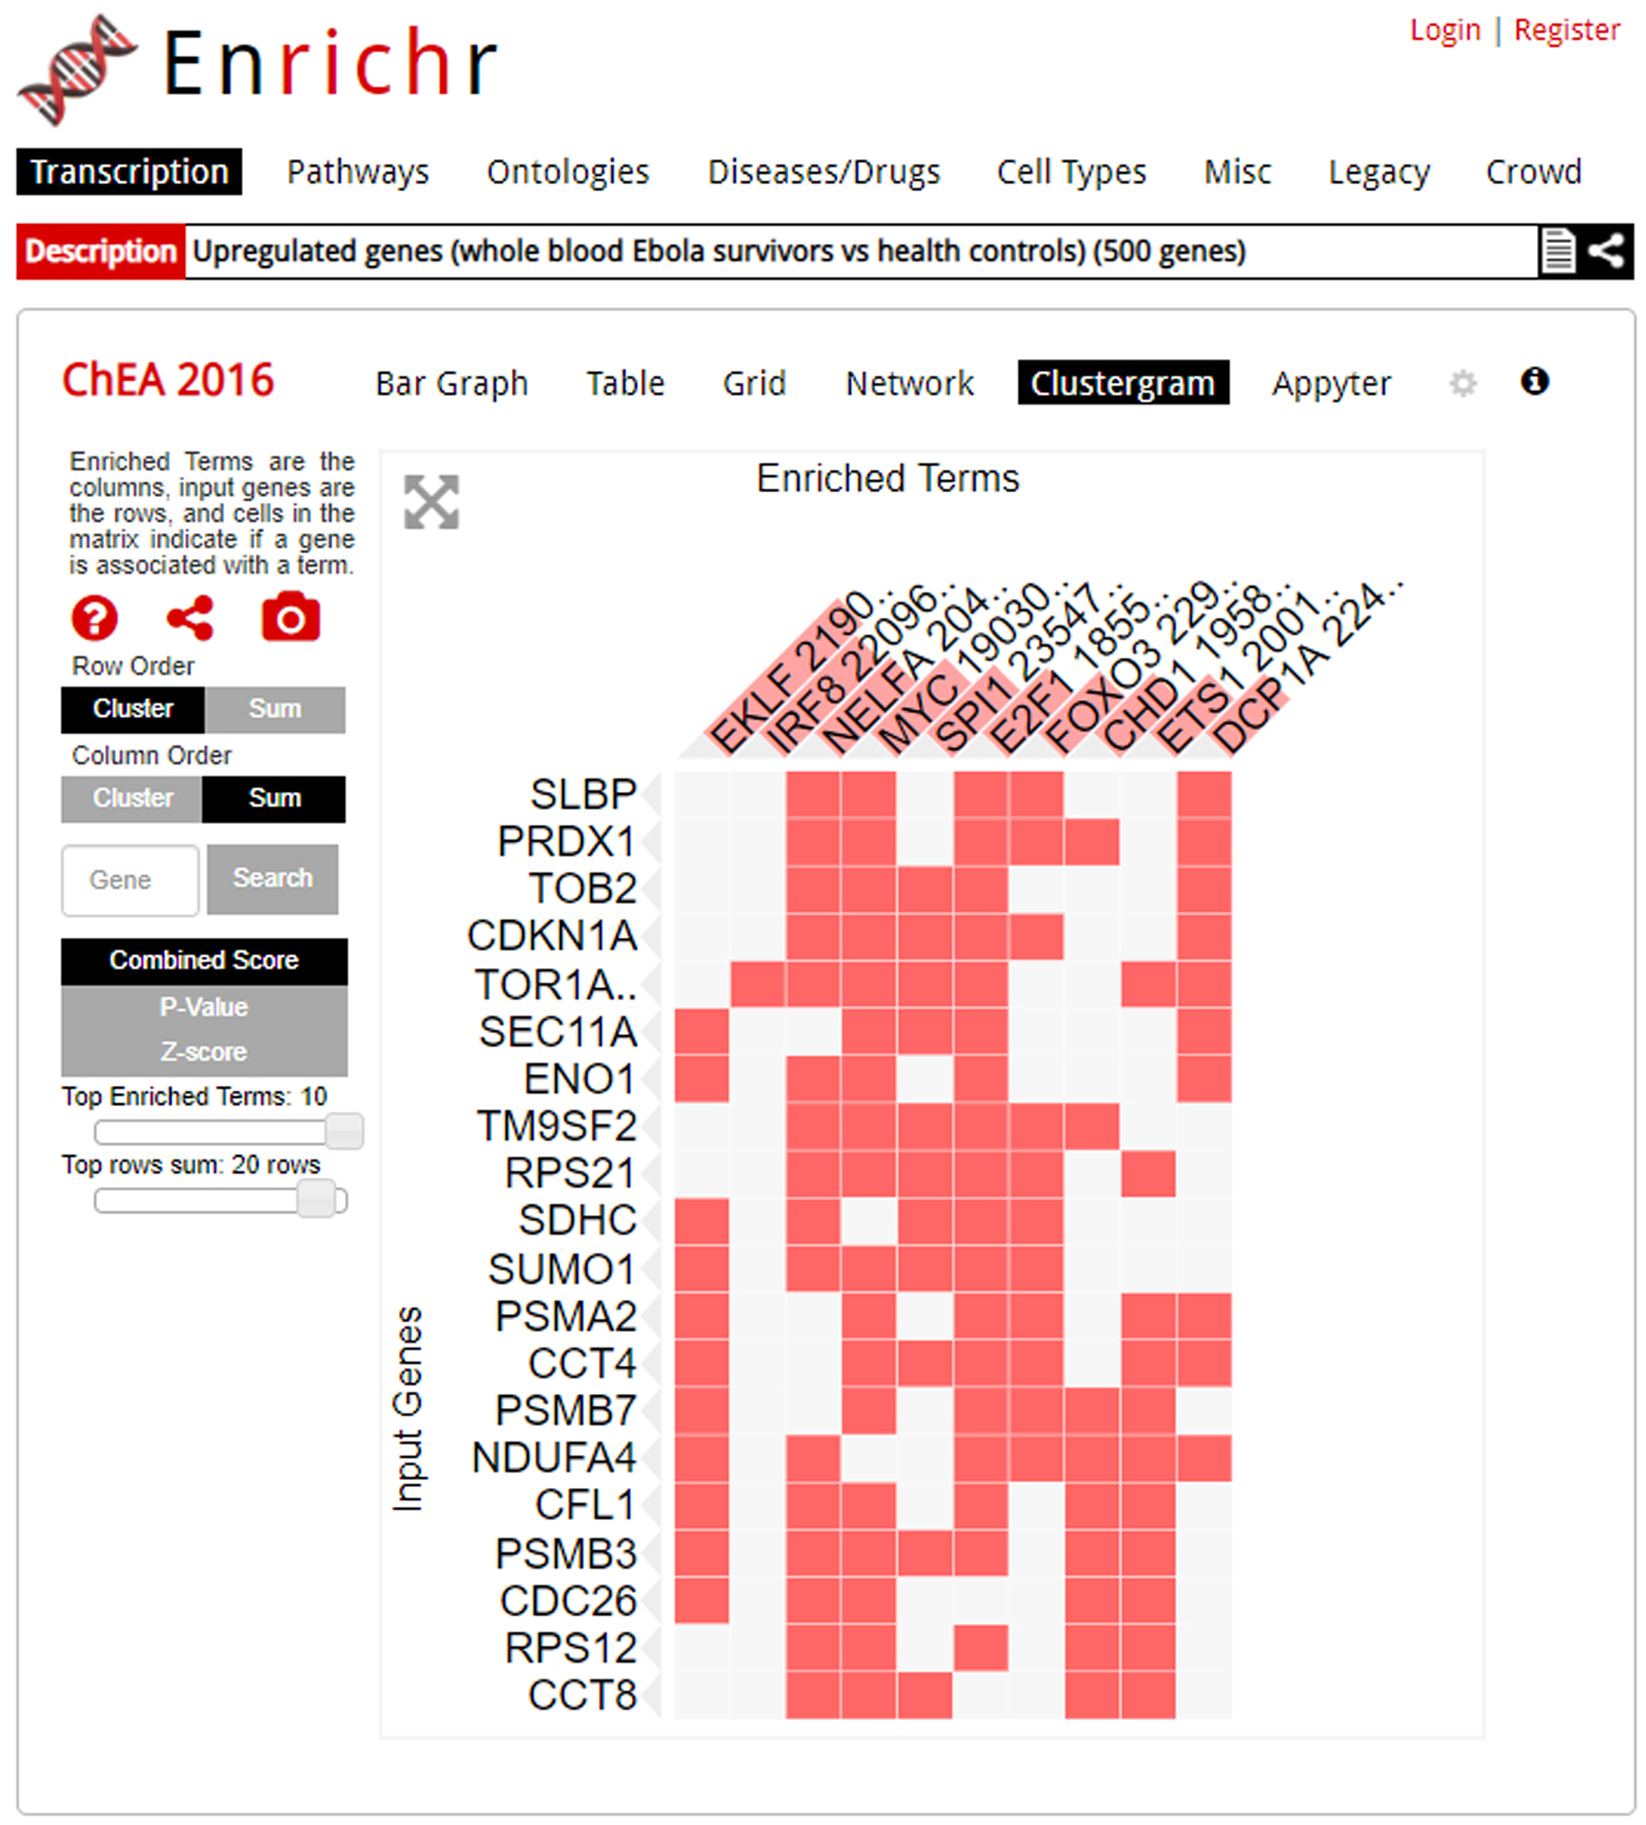
The clustergram visualization of an enrichment analysis. Alterations to the clustergram, such as graph size or ordering preference, can be executed using the modifiers on the right of the page. The column headers are the top 10 enriched terms; you can switch the ranking criteria to combined score, p-value, or z-score. A filled cell indicates that the input term and enriched term overlap. For example, we can see that input gene RPS21 overlaps with the enriched term ETS1.
BASIC PROTOCOL 2
Searching Enrichr by a single gene or key search term
Enrichr offers users the ability to search its database for additional information about a specific gene, or to identify or analyze gene sets by a key search term. Searching for a single gene concisely presents known associations between a gene and a gene set term by querying Enrichr’s multiple libraries. Searching Enrichr by a key term can assist users in finding new gene sets related to their research interests. Such gene sets can be easily downloaded or analyzed within Enrichr.
Necessary Resources:
Hardware – Desktop or a laptop computer, or a mobile device, with a fast Internet connection
Software – An up-to-date web browser such as Google Chrome (https://www.google.com/chrome/), Mozilla Firefox (https://www.mozilla.org/en-US/firefox/), Apple Safari (https://www.apple.com/safari/), or Microsoft Edge (https://www.microsoft.com/en-us/edge).
Protocol steps and annotations:
-
1
Navigate to the Enrichr homepage (https://maayanlab.cloud/Enrichr/) (Figure 12).
Fig. 12.
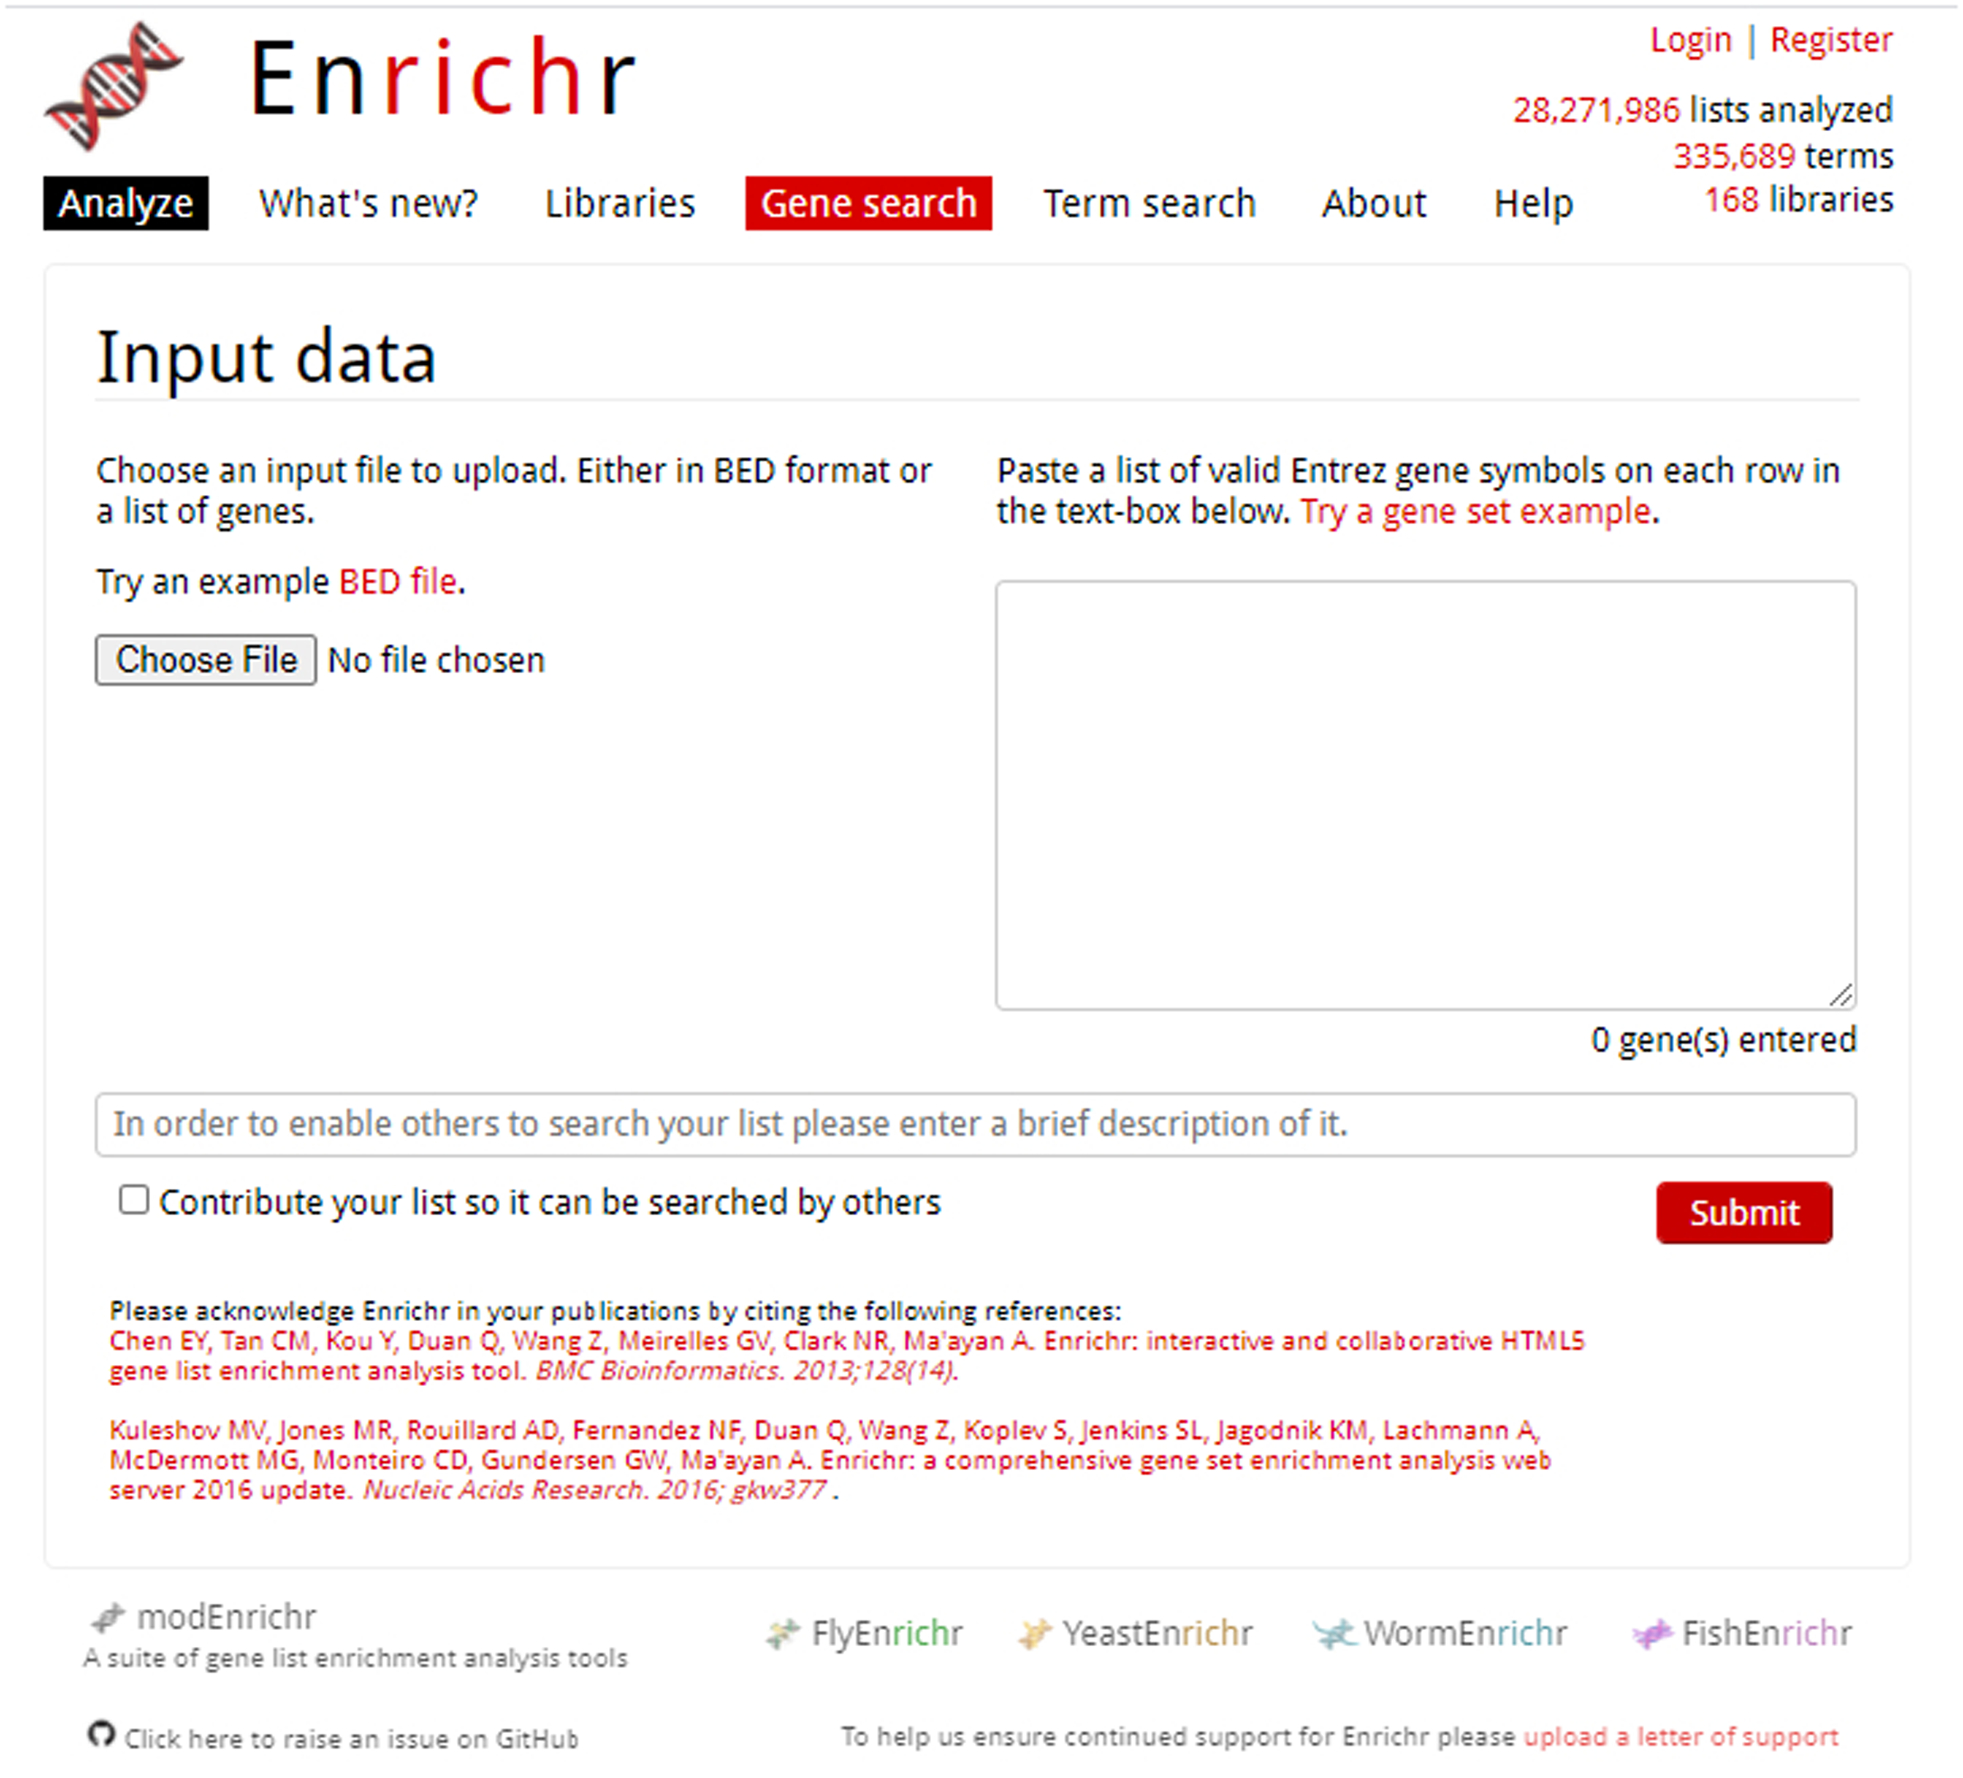
Homepage of Enrichr with the “Gene search” option highlighted in red.
Searching for a single gene
-
2
Click on the “Gene Search” link on the menu bar at the top of the page
-
3
In the text box next to “Gene”, enter an Entrez gene symbol (Figure 13). An auto-complete function can aid you in finding your gene of interest. Click “Find Knowledge” to be brought to the next page. For the demonstration, enter “BRCA3”.
-
4
An accordion menu on the result page allows you to search through different categories and discover relationships between your searched gene and Enrichr libraries (Figure 14).
Only Enrichr libraries with found associations with the gene of interest are displayed.
Fig. 13.
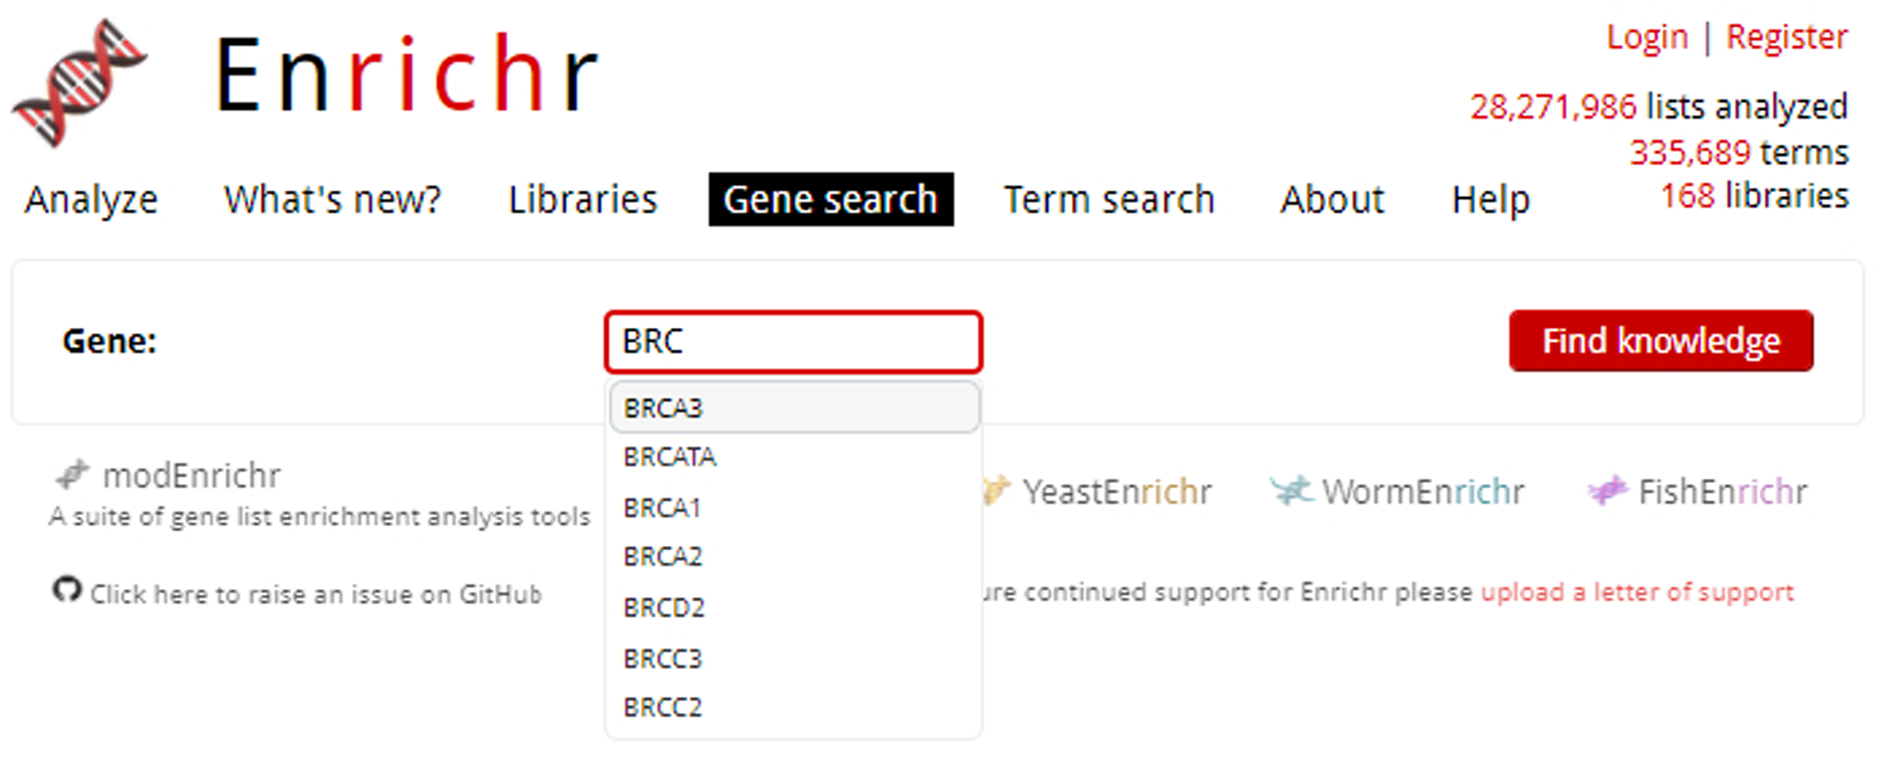
While entering our gene of interest, BRCA3, the auto-complete functionality lists available gene options.
Fig. 14.
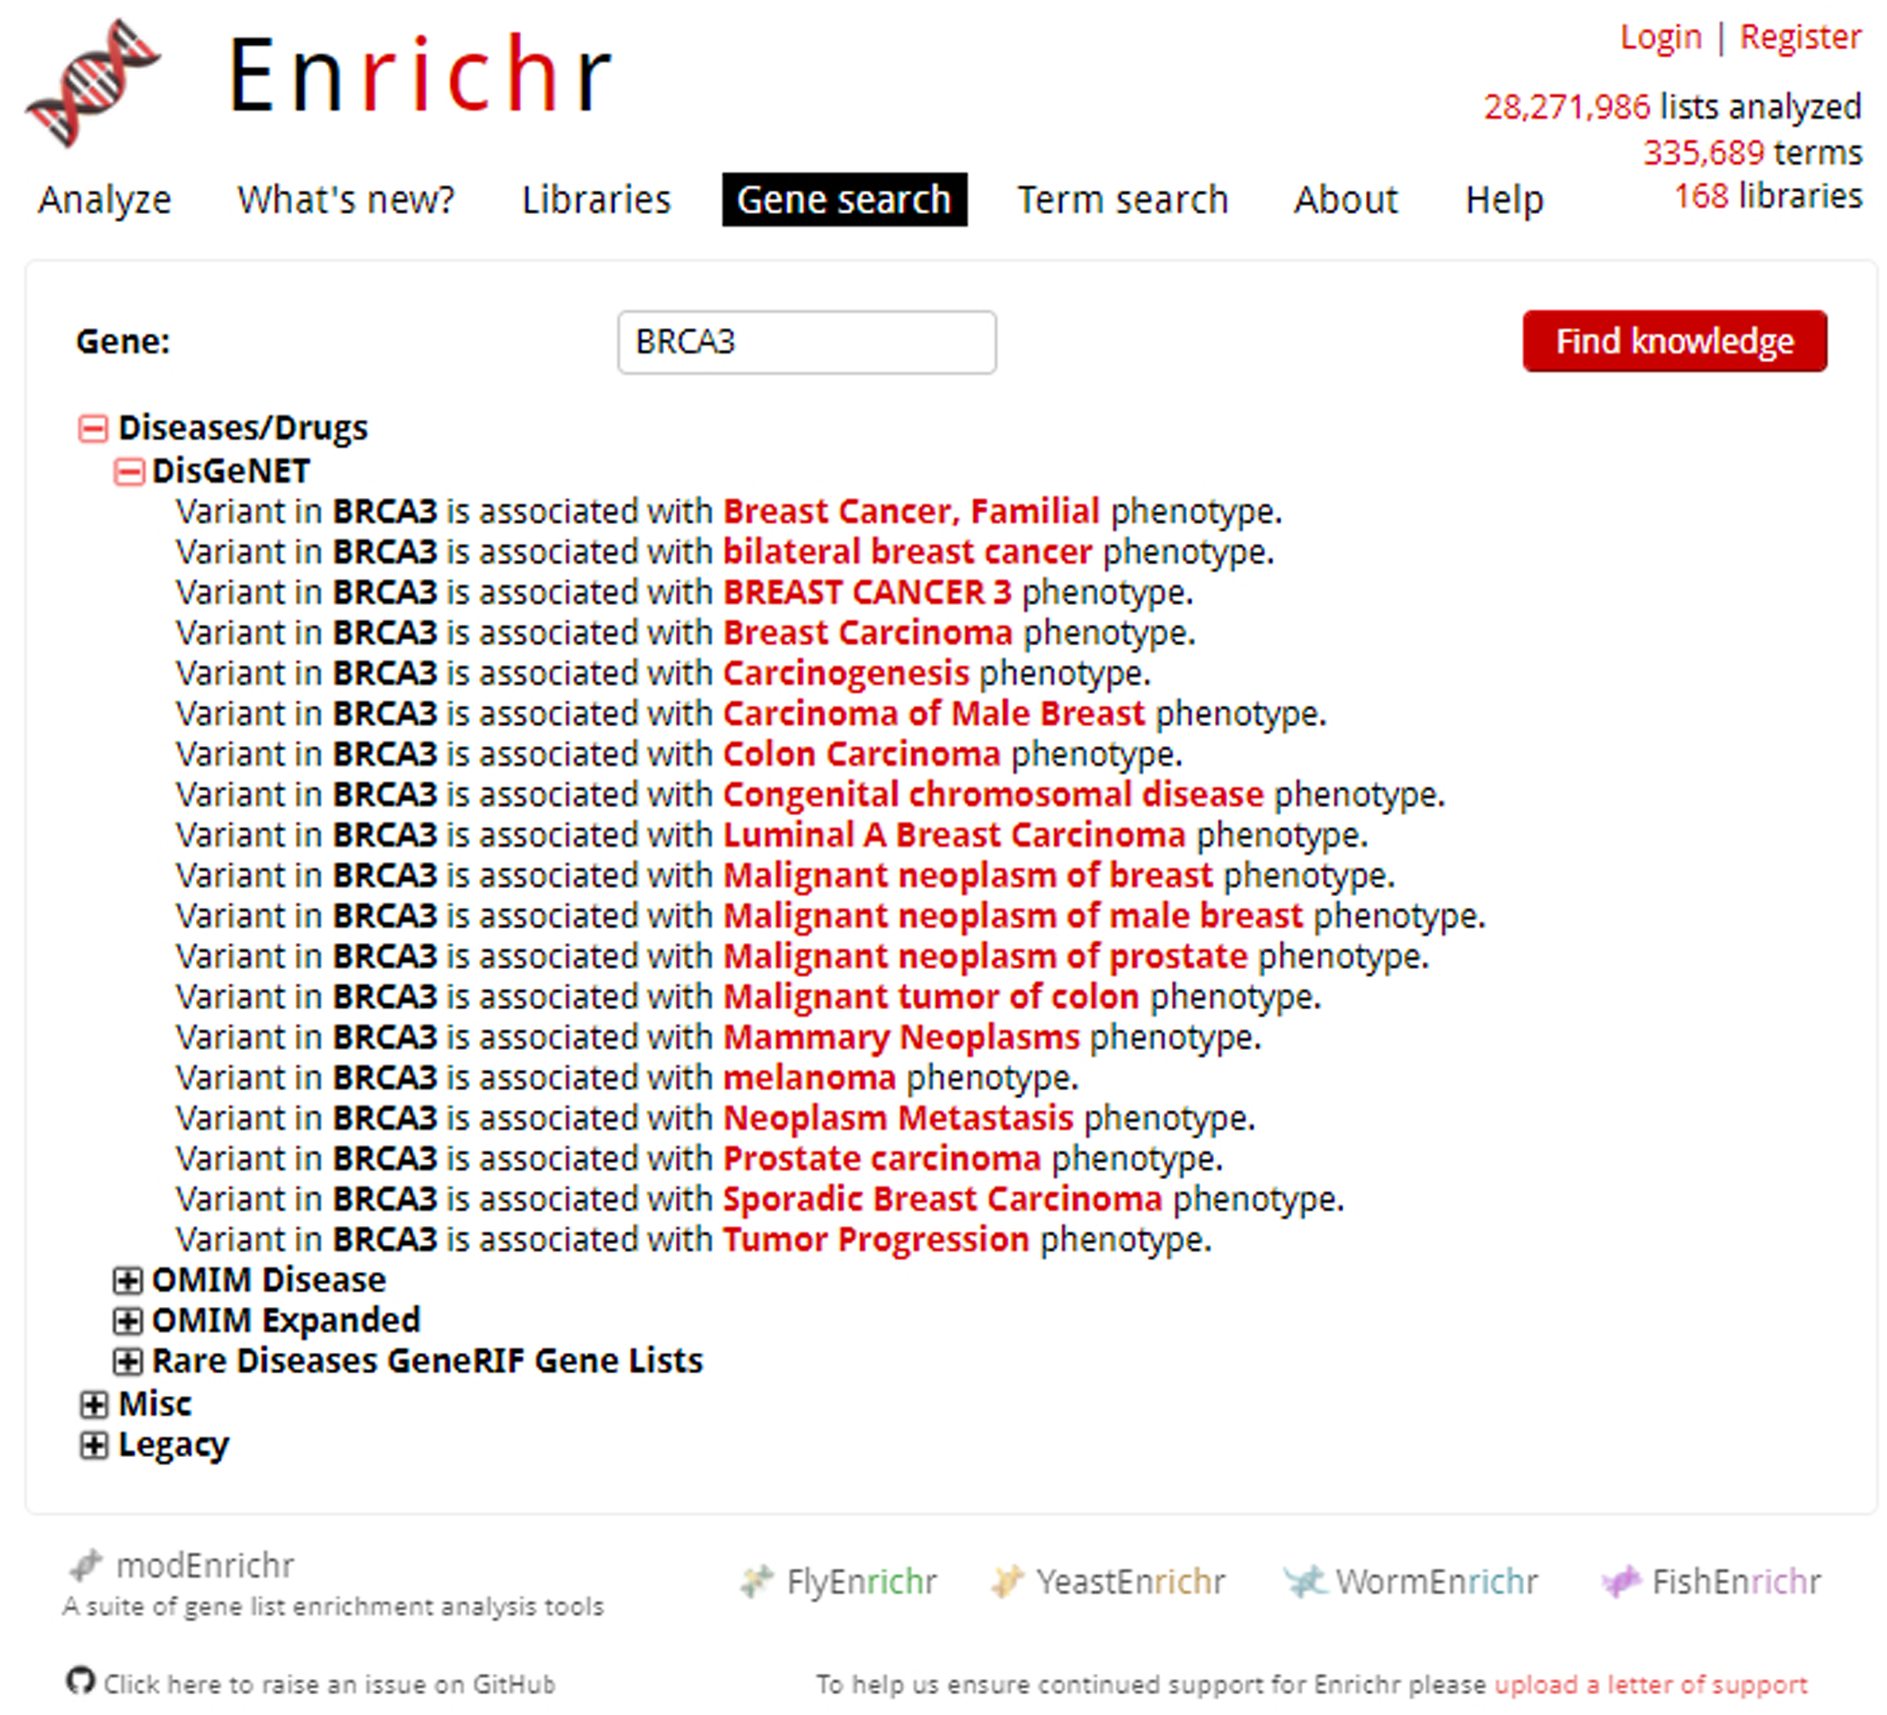
Expanded search results for example gene of interest, BRCA3. Categories can be clicked to open an accordion menu, allowing access to different libraries. Associations or other relationships to the gene library are listed.
Finding and analyzing gene sets from key search terms
-
5
Click on the “Term Search” link on the menu bar at the top of the page (Figure 15).
-
6
In the text box, enter a search term of interest (Figure 16). Click the magnifying glass to see the results. For demonstration, we will be searching for gene sets containing “SARS”.
Search terms can include diseases, phenotypes, genes, drugs, pathways, anatomical parts, cell names, pathogens, ligands, and more.
-
7
The results of your query will appear below (Figure 16). An accordion menu lists Enrichr categories, which can be further expanded to reveal gene sets related to your metadata search term of interest.
-
8
Gene sets can be downloaded by clicking on the file icon. Alternatively, view the Enrichr analysis results for the selected gene set by clicking the hyperlink icon. A link to the Enrichr analysis will pop-up on the screen; click it to view the analysis results.
-
9
To understand the Enrichr analysis results, please follow the instructions of Basic Protocol 1 beginning at Step 4.
Fig. 15.
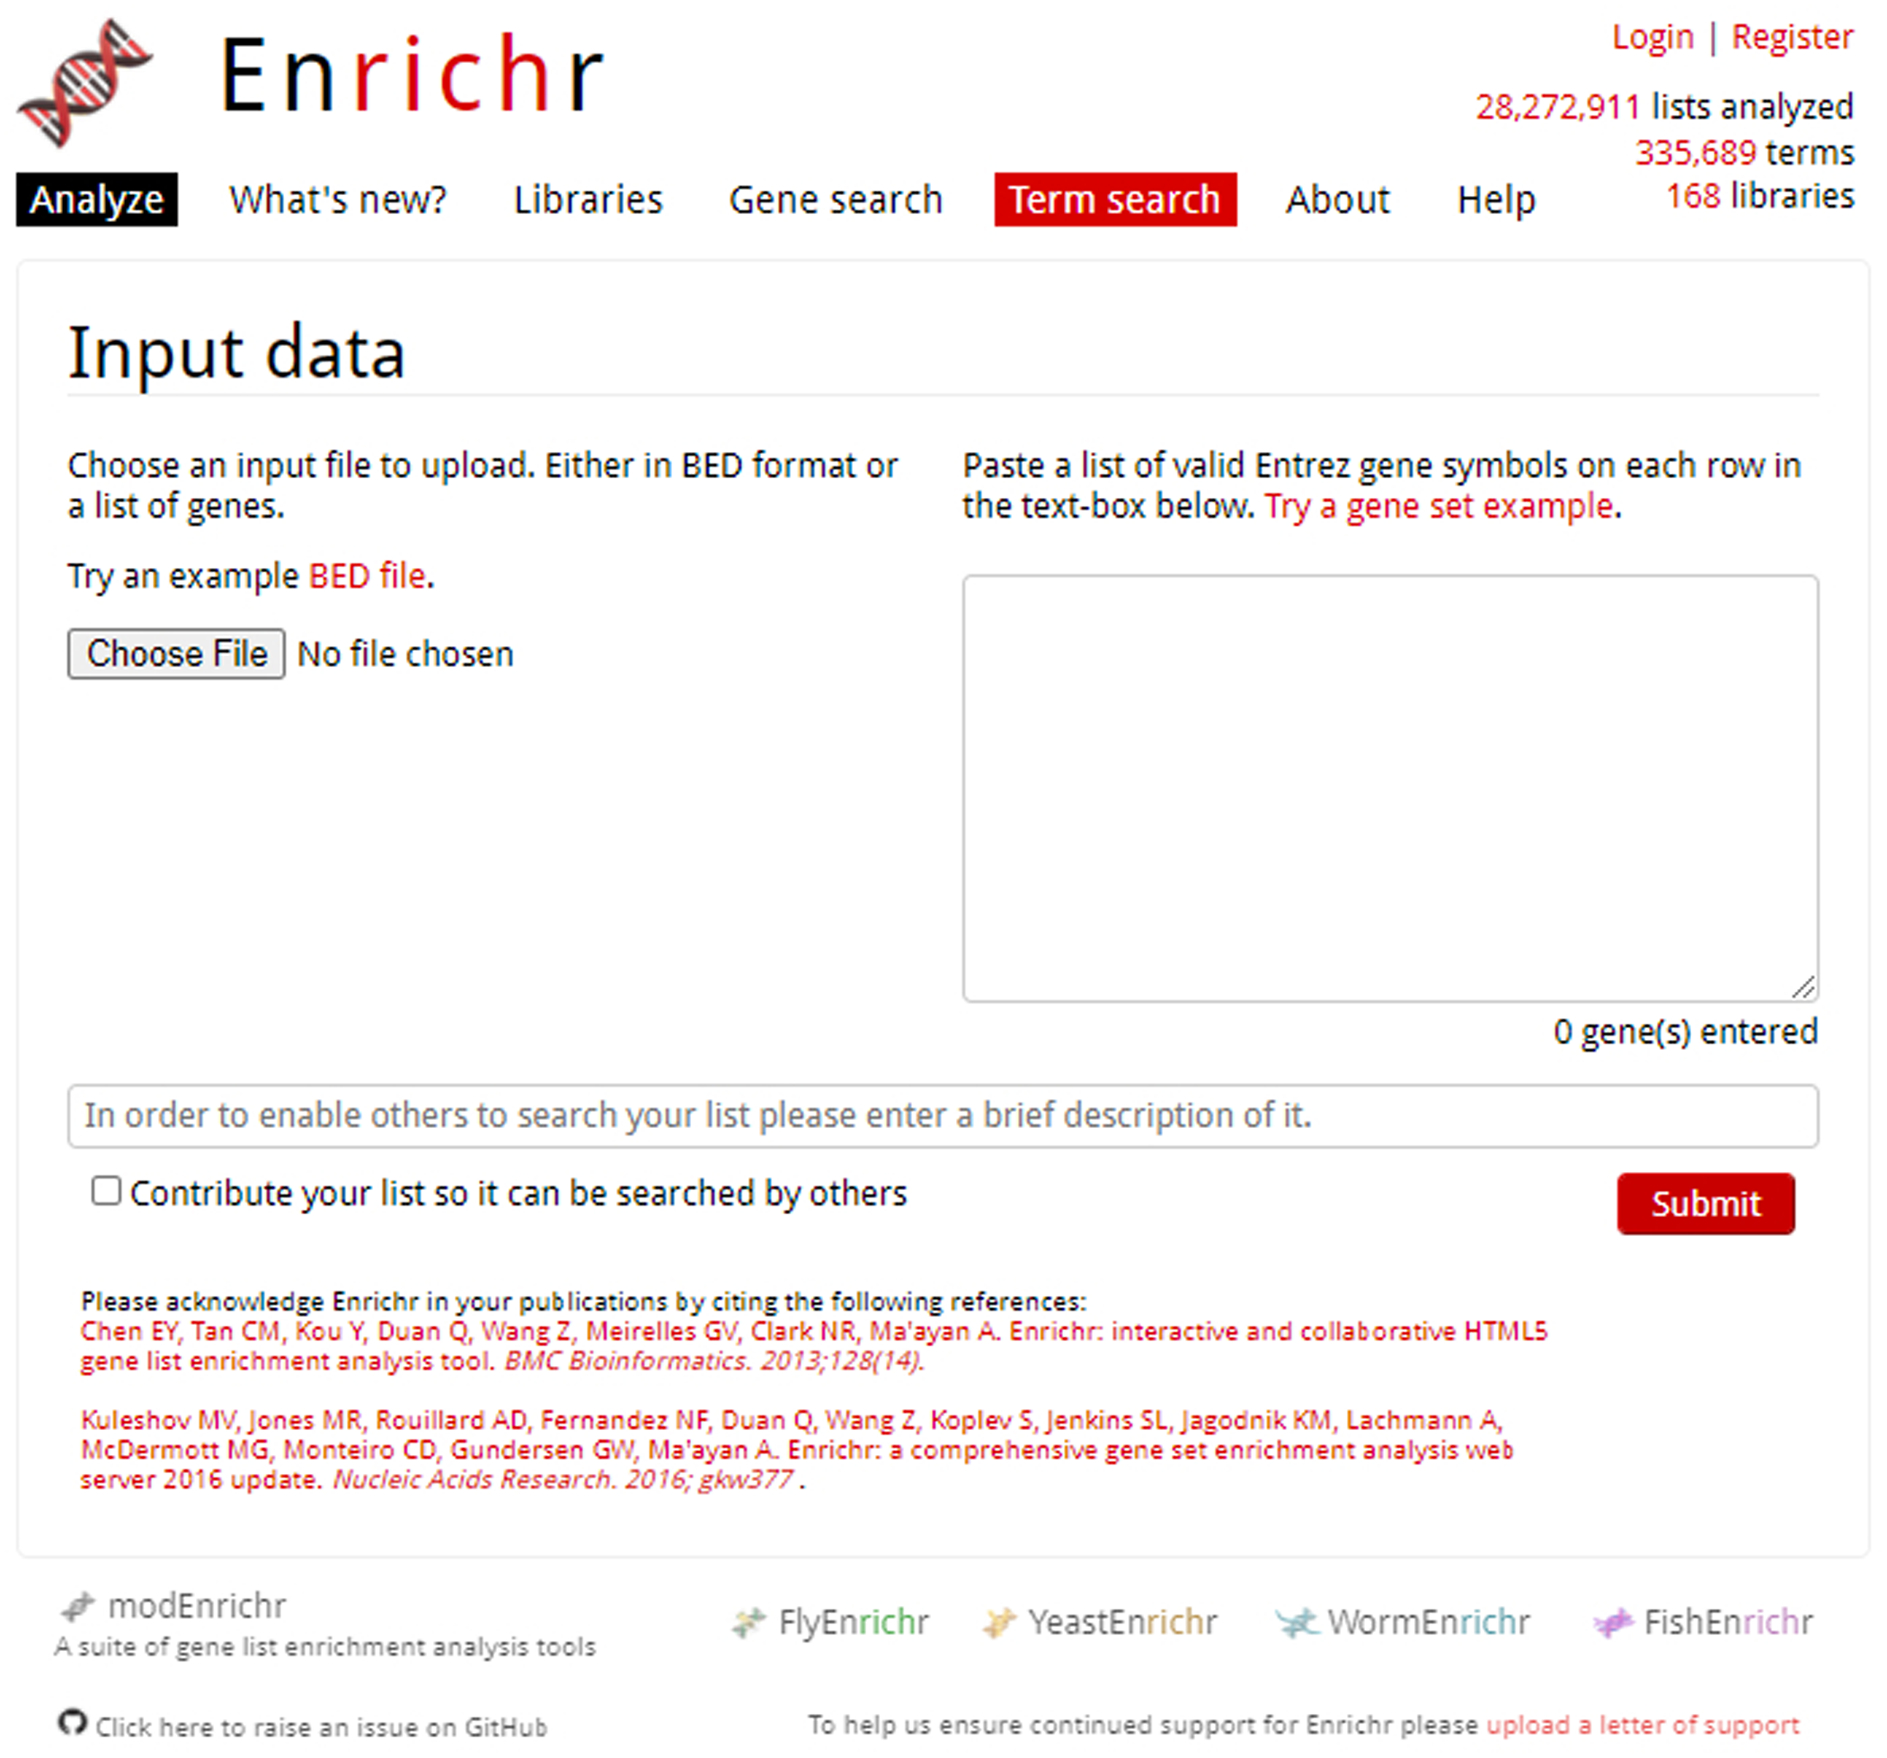
Homepage of Enrichr with the “Term search” option at top of the page highlighted in red.
Fig. 16.
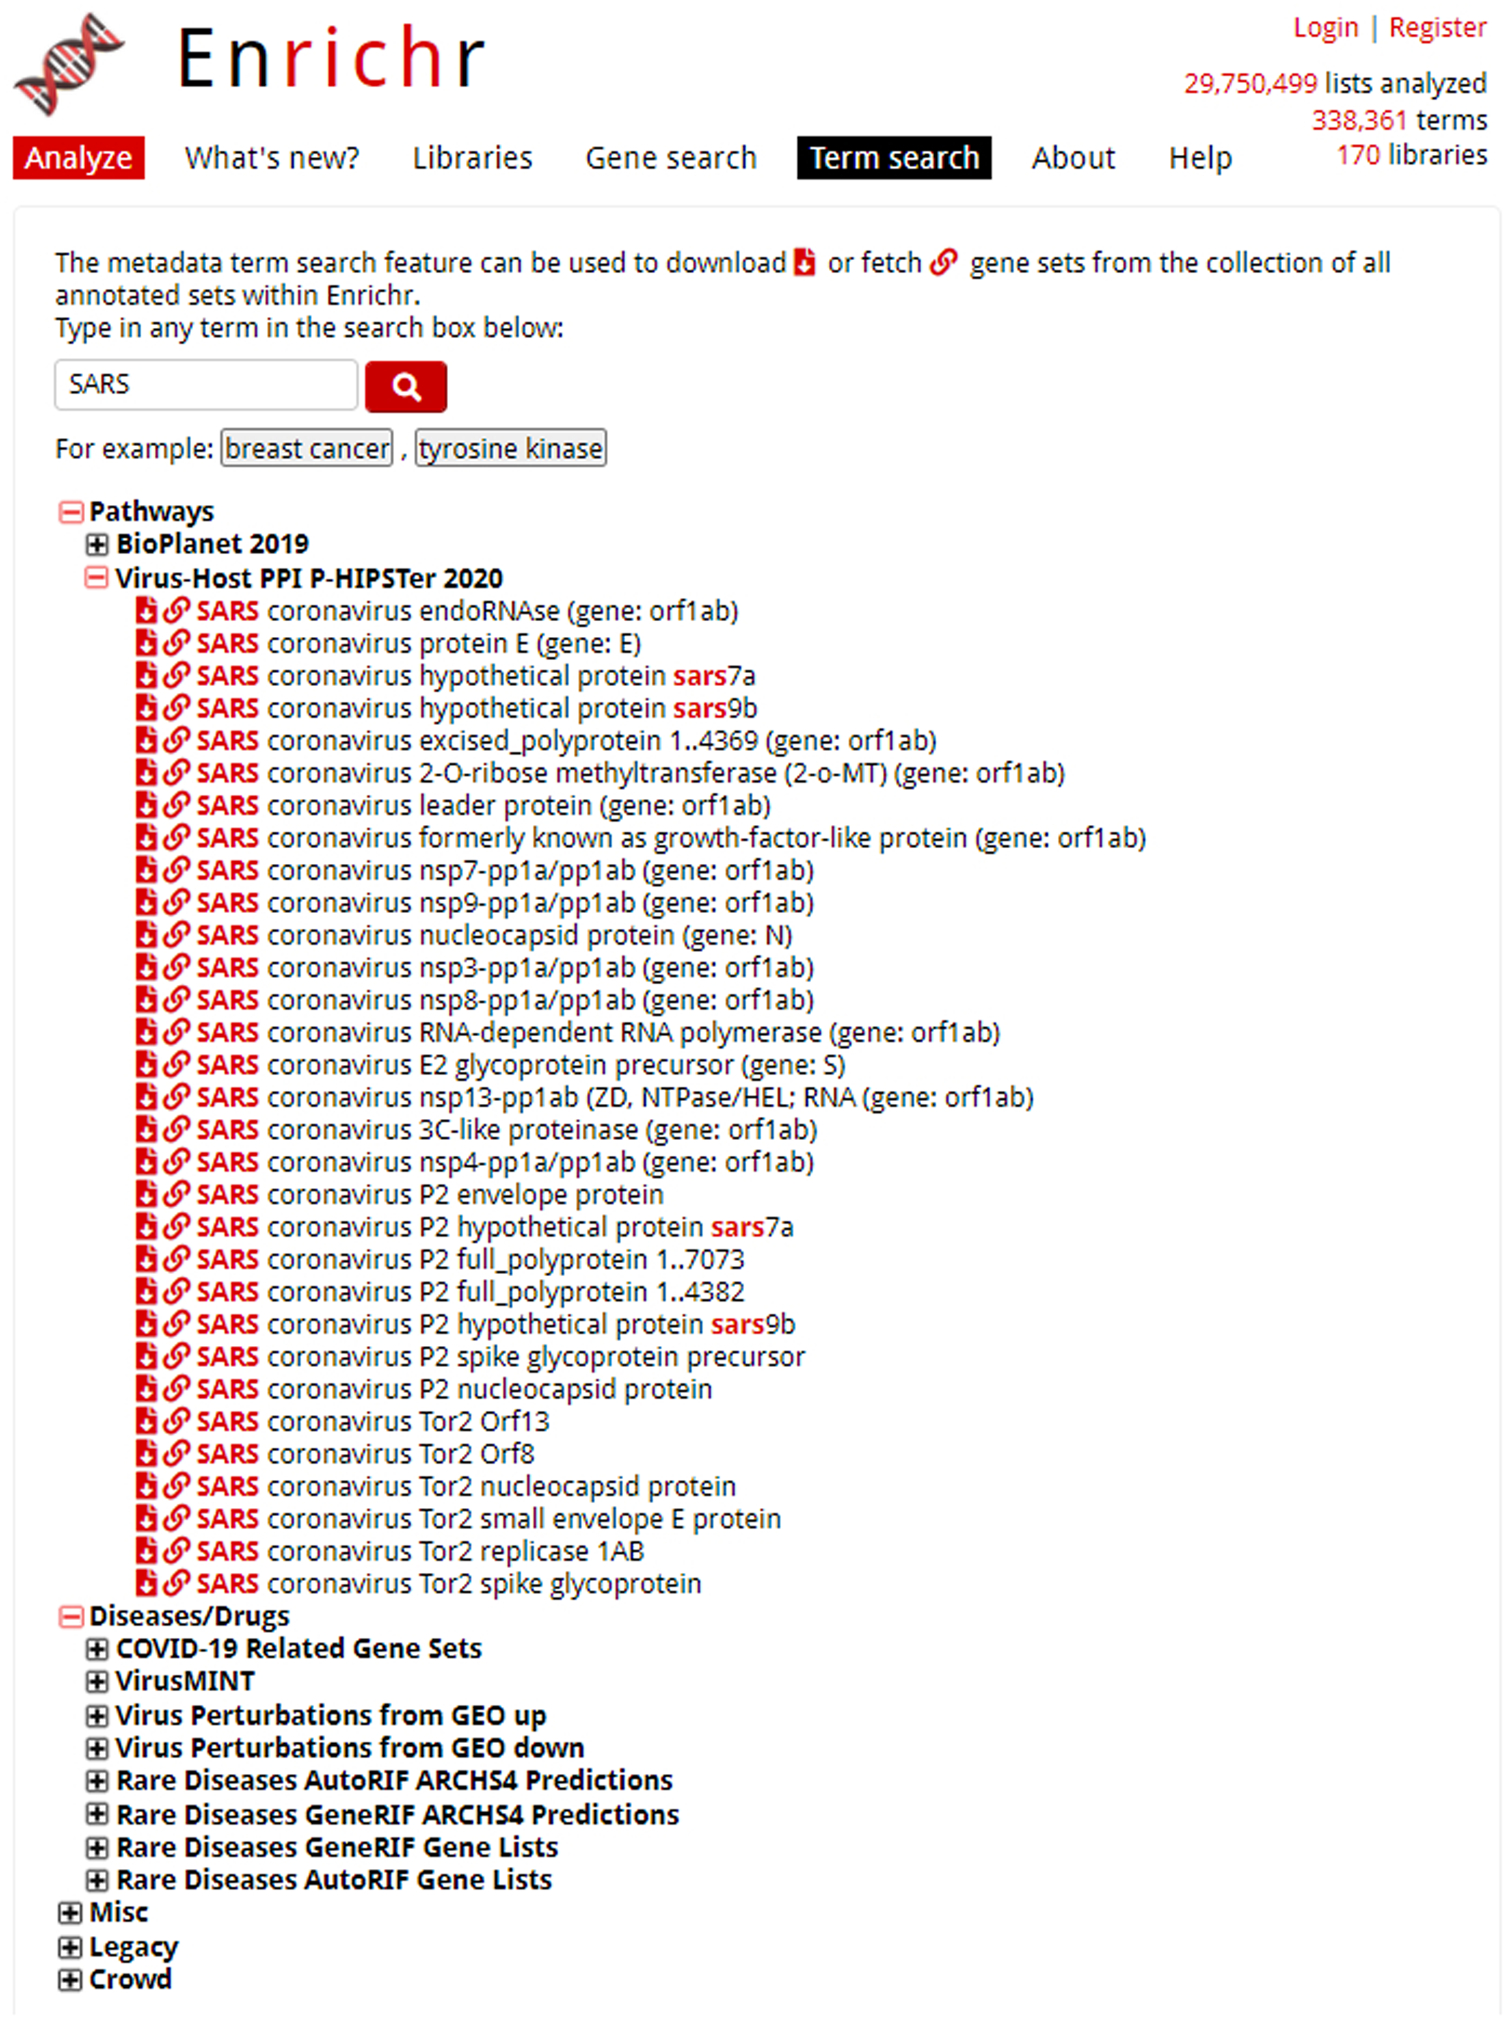
Term search results for example metadata term “SARS”. The category accordion menu can be opened to explore gene set lists. The icons to download the gene set or view the Enrichr analysis are located next to the gene set name.
Basic Protocol 3
Preparing raw or processed RNA-seq data through BioJupies in preparation for Enrichr analysis
BioJupies (https://amp.pharm.mssm.edu/biojupies/) (Torre et al., 2018) is a web-based platform that enables users to produce an interactive and comprehensive Jupyter notebook from RNA-seq data. It is customizable to include various analyses, including links to both the top upregulated and top-down regulated genes to be explored with Enrichr. To demonstrate, we will be generating Enrichr links from a Gene Expression Omnibus (GEO) published study, “Gene expression profiling of blood of Ebola virus disease survivors and Healthy donors by Next Generation Sequencing” (Wiedemann et al., 2020) (GSE143549). The dataset was downloaded, and extraneous data removed in preparation for ingestion into BioJupies.
Necessary Resources:
Hardware – Desktop or a laptop computer, or a mobile device, with a fast Internet connection
Software – An up-to-date web browser such as Google Chrome (https://www.google.com/chrome/), Mozilla Firefox (https://www.mozilla.org/en-US/firefox/), Apple Safari (https://www.apple.com/safari/), or Microsoft Edge (https://www.microsoft.com/en-us/edge).
Files – Sample Dataset (https://www.ncbi.nlm.nih.gov/geo/query/acc.cgi?acc=GSE143549).
Protocol steps and annotations:
-
1
Navigate to the BioJupies home page (https://amp.pharm.mssm.edu/biojupies/) (Figure 17). Click the “Get Started” button to be brought to the data upload page.
-
2
Select a method for uploading the data. BioJupies has two methods of data upload: searching for published datasets via the Gene Expression Omnibus (GEO) (Edgar et al., 2002) or GTEx (Bahcall, 2015) or uploading your own gene expression data (Figure 18).
Fig. 17.
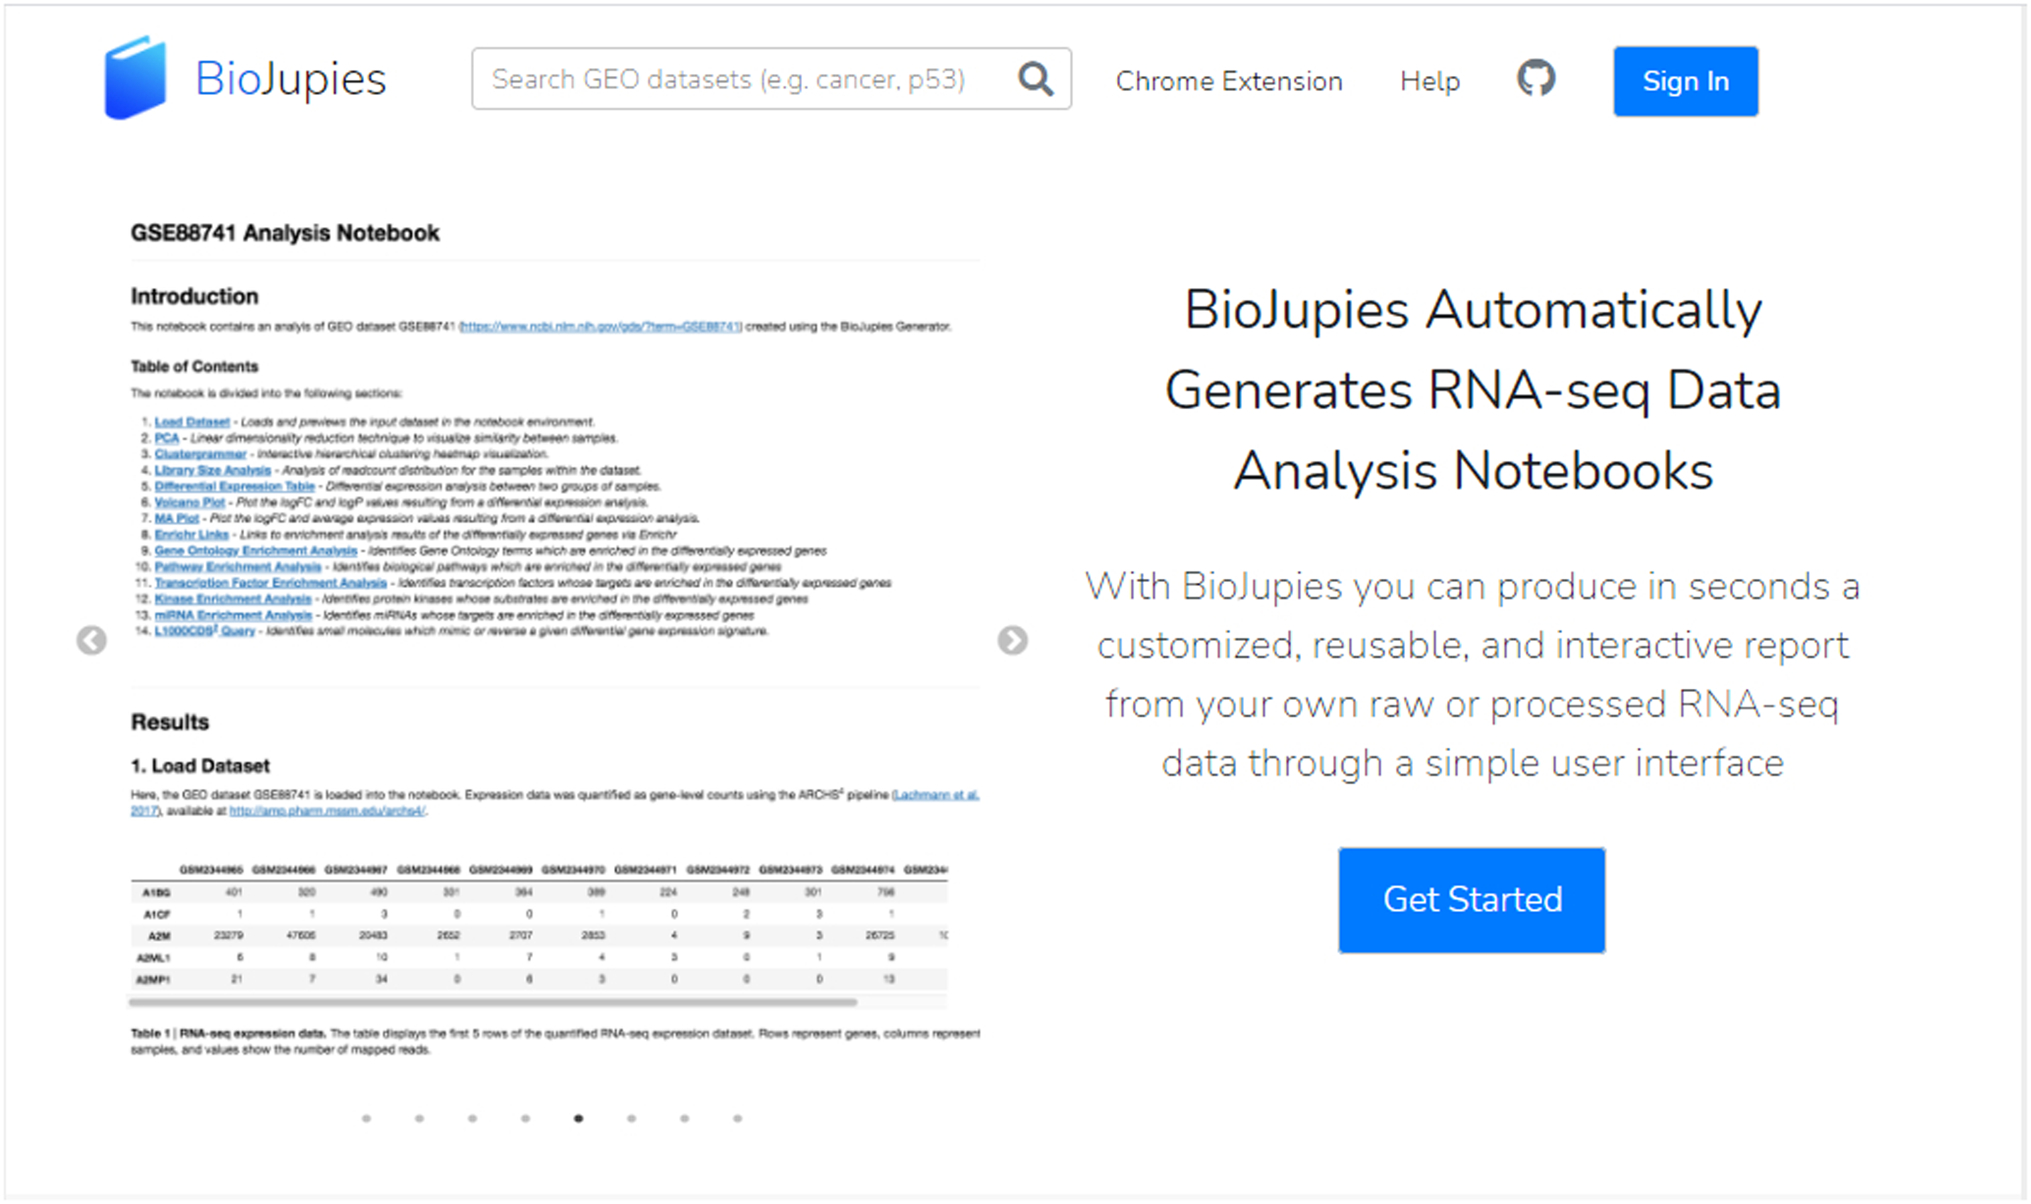
Portion of the BioJupies home page (https://amp.pharm.mssm.edu/biojupies/).
Fig. 18.
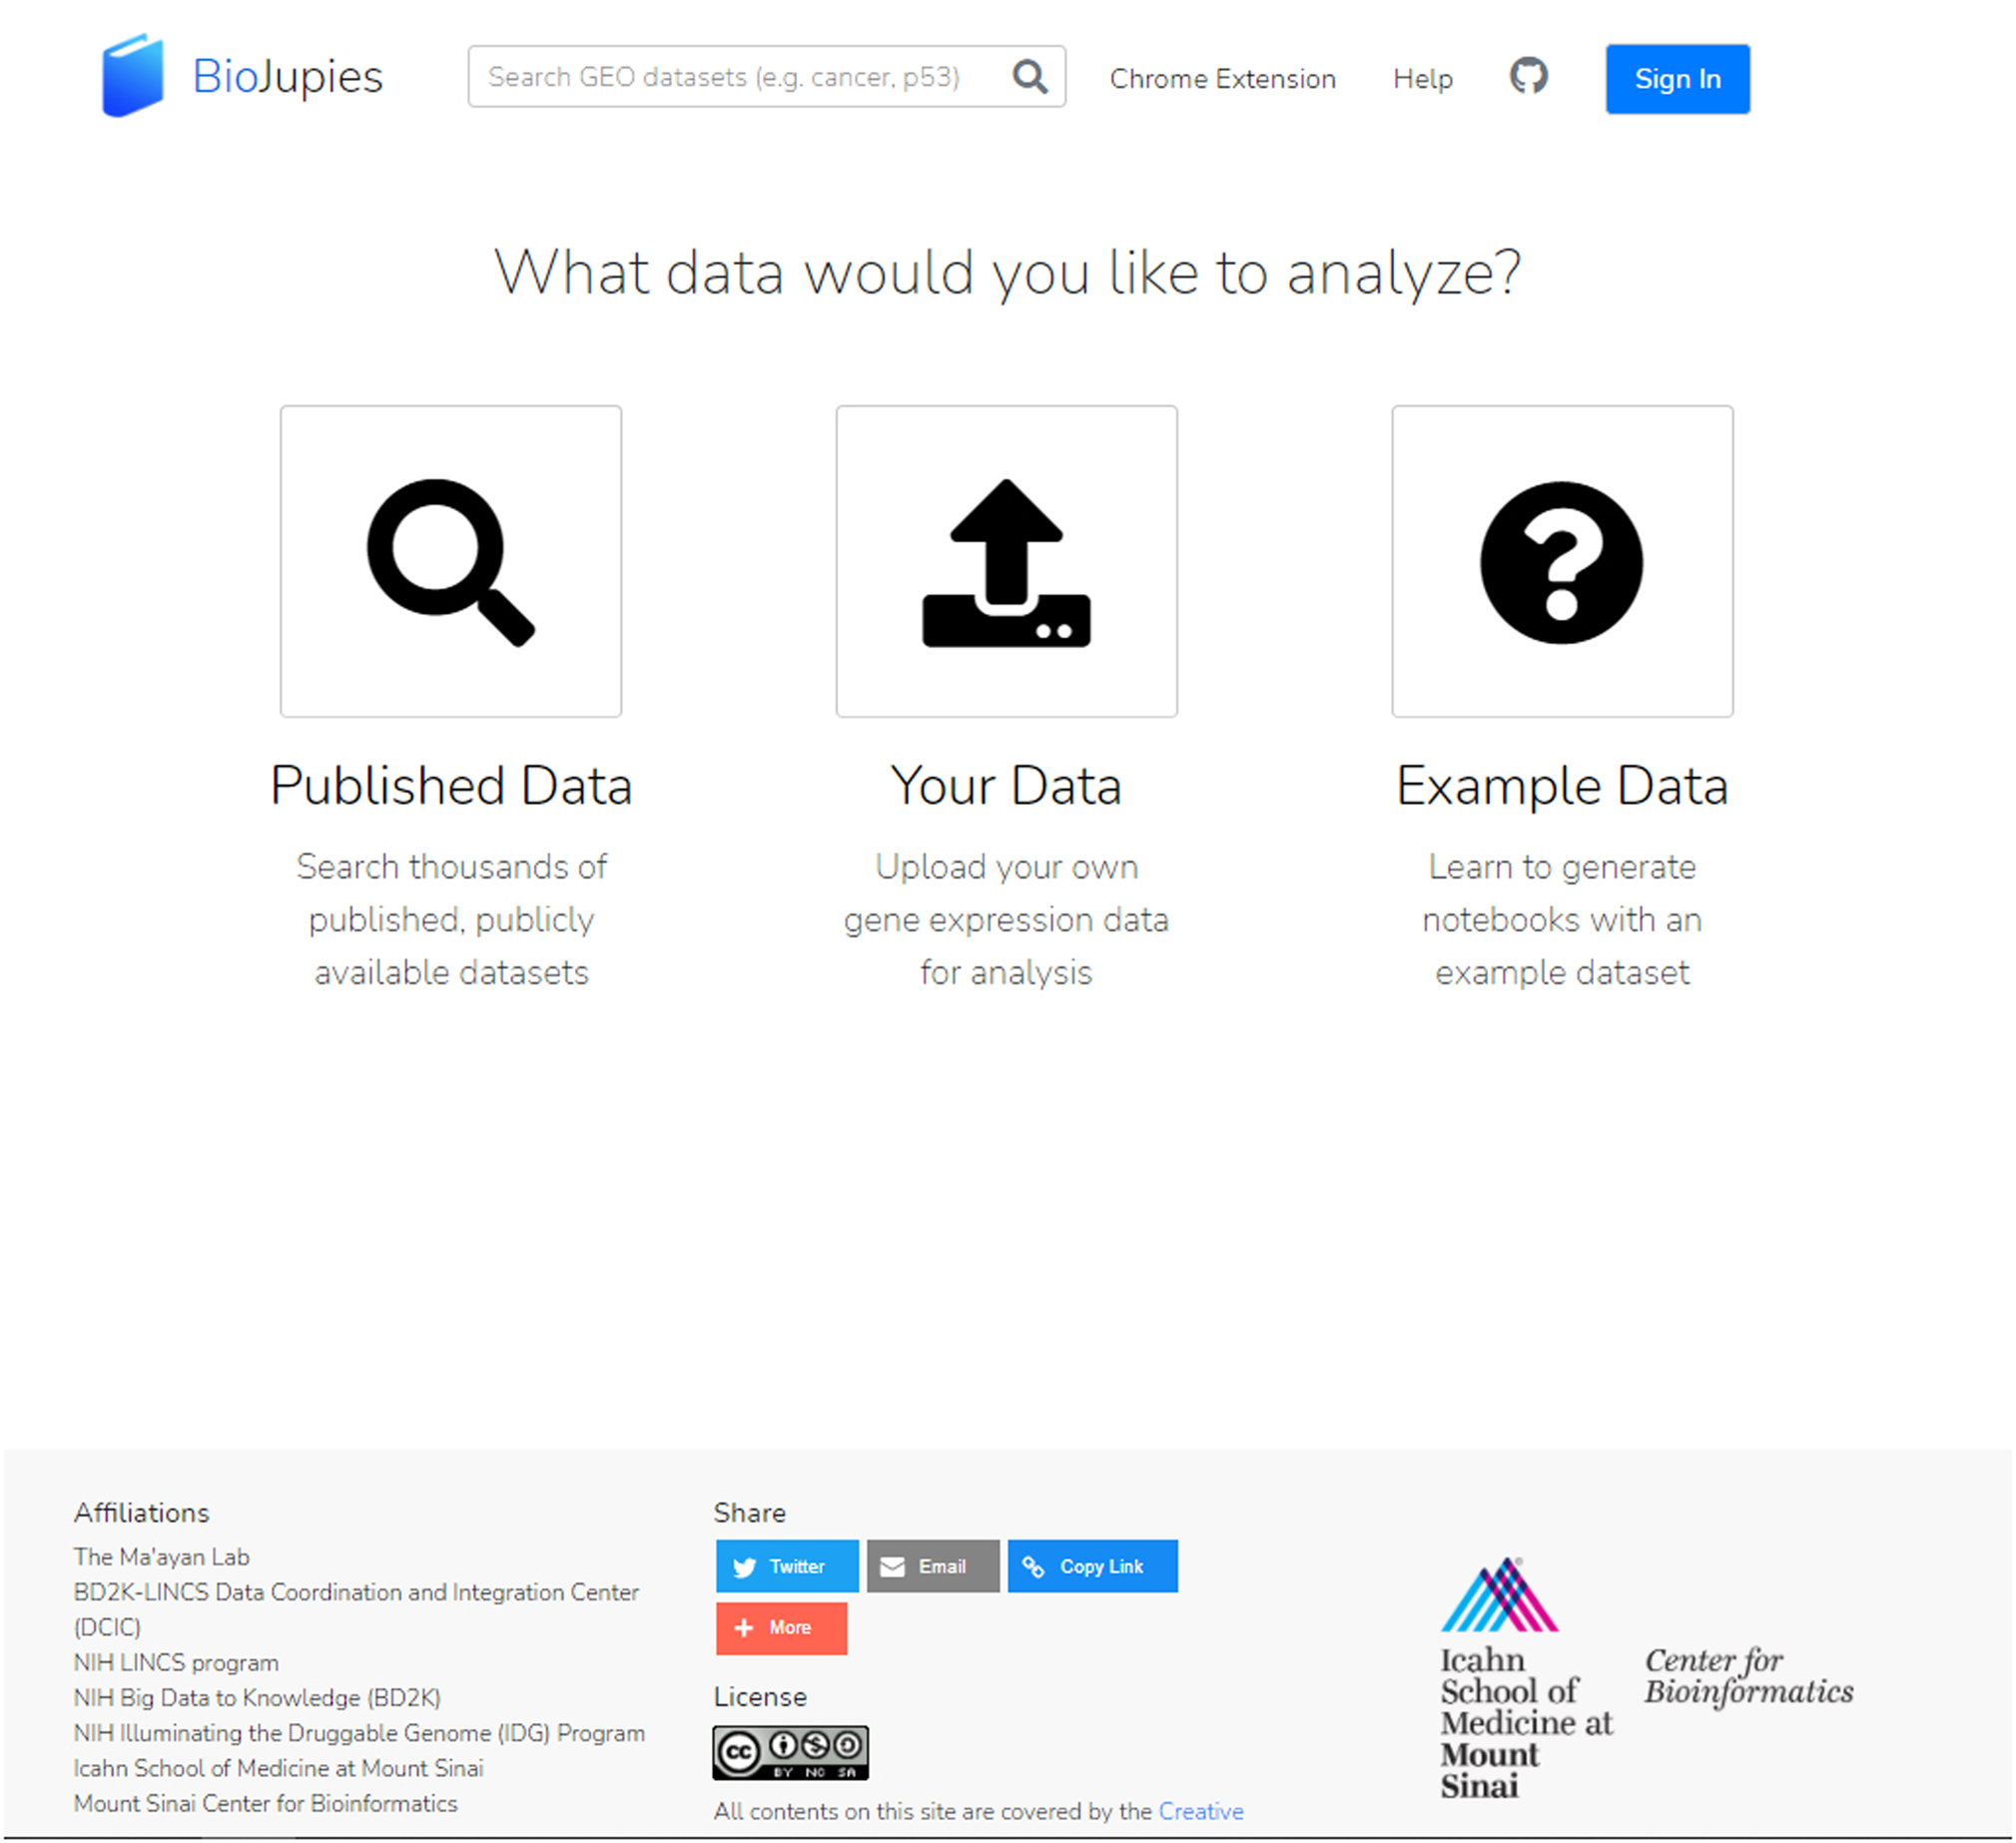
Users can use the buttons to either search and analyze a published dataset (left icon) or upload their own dataset (middle icon). You can also explore features of BioJupies without submitting a dataset by using example data (right icon).
Searching and selecting a published dataset
-
3
For analyzing data from GEO, users can search by key term and filter and sort the results by organism type, number of samples, or publication date (Figure 19). Clicking the drop-down “More Info” brings up a data summary, organism type, and data source. To analyze the dataset, click “Analyze”.
-
4
For analyzing data from GTEx, users can select two groups of samples for further analysis (Figure 20). Enter the group names, and then use the age, gender, and tissues dropdowns to find and select samples. In addition, users may search for a sample of interest. Users must select at least two samples from each group. Clicking on the checkbox by a sample adds it to the group. To analyze, click “Continue”.
Fig. 19.
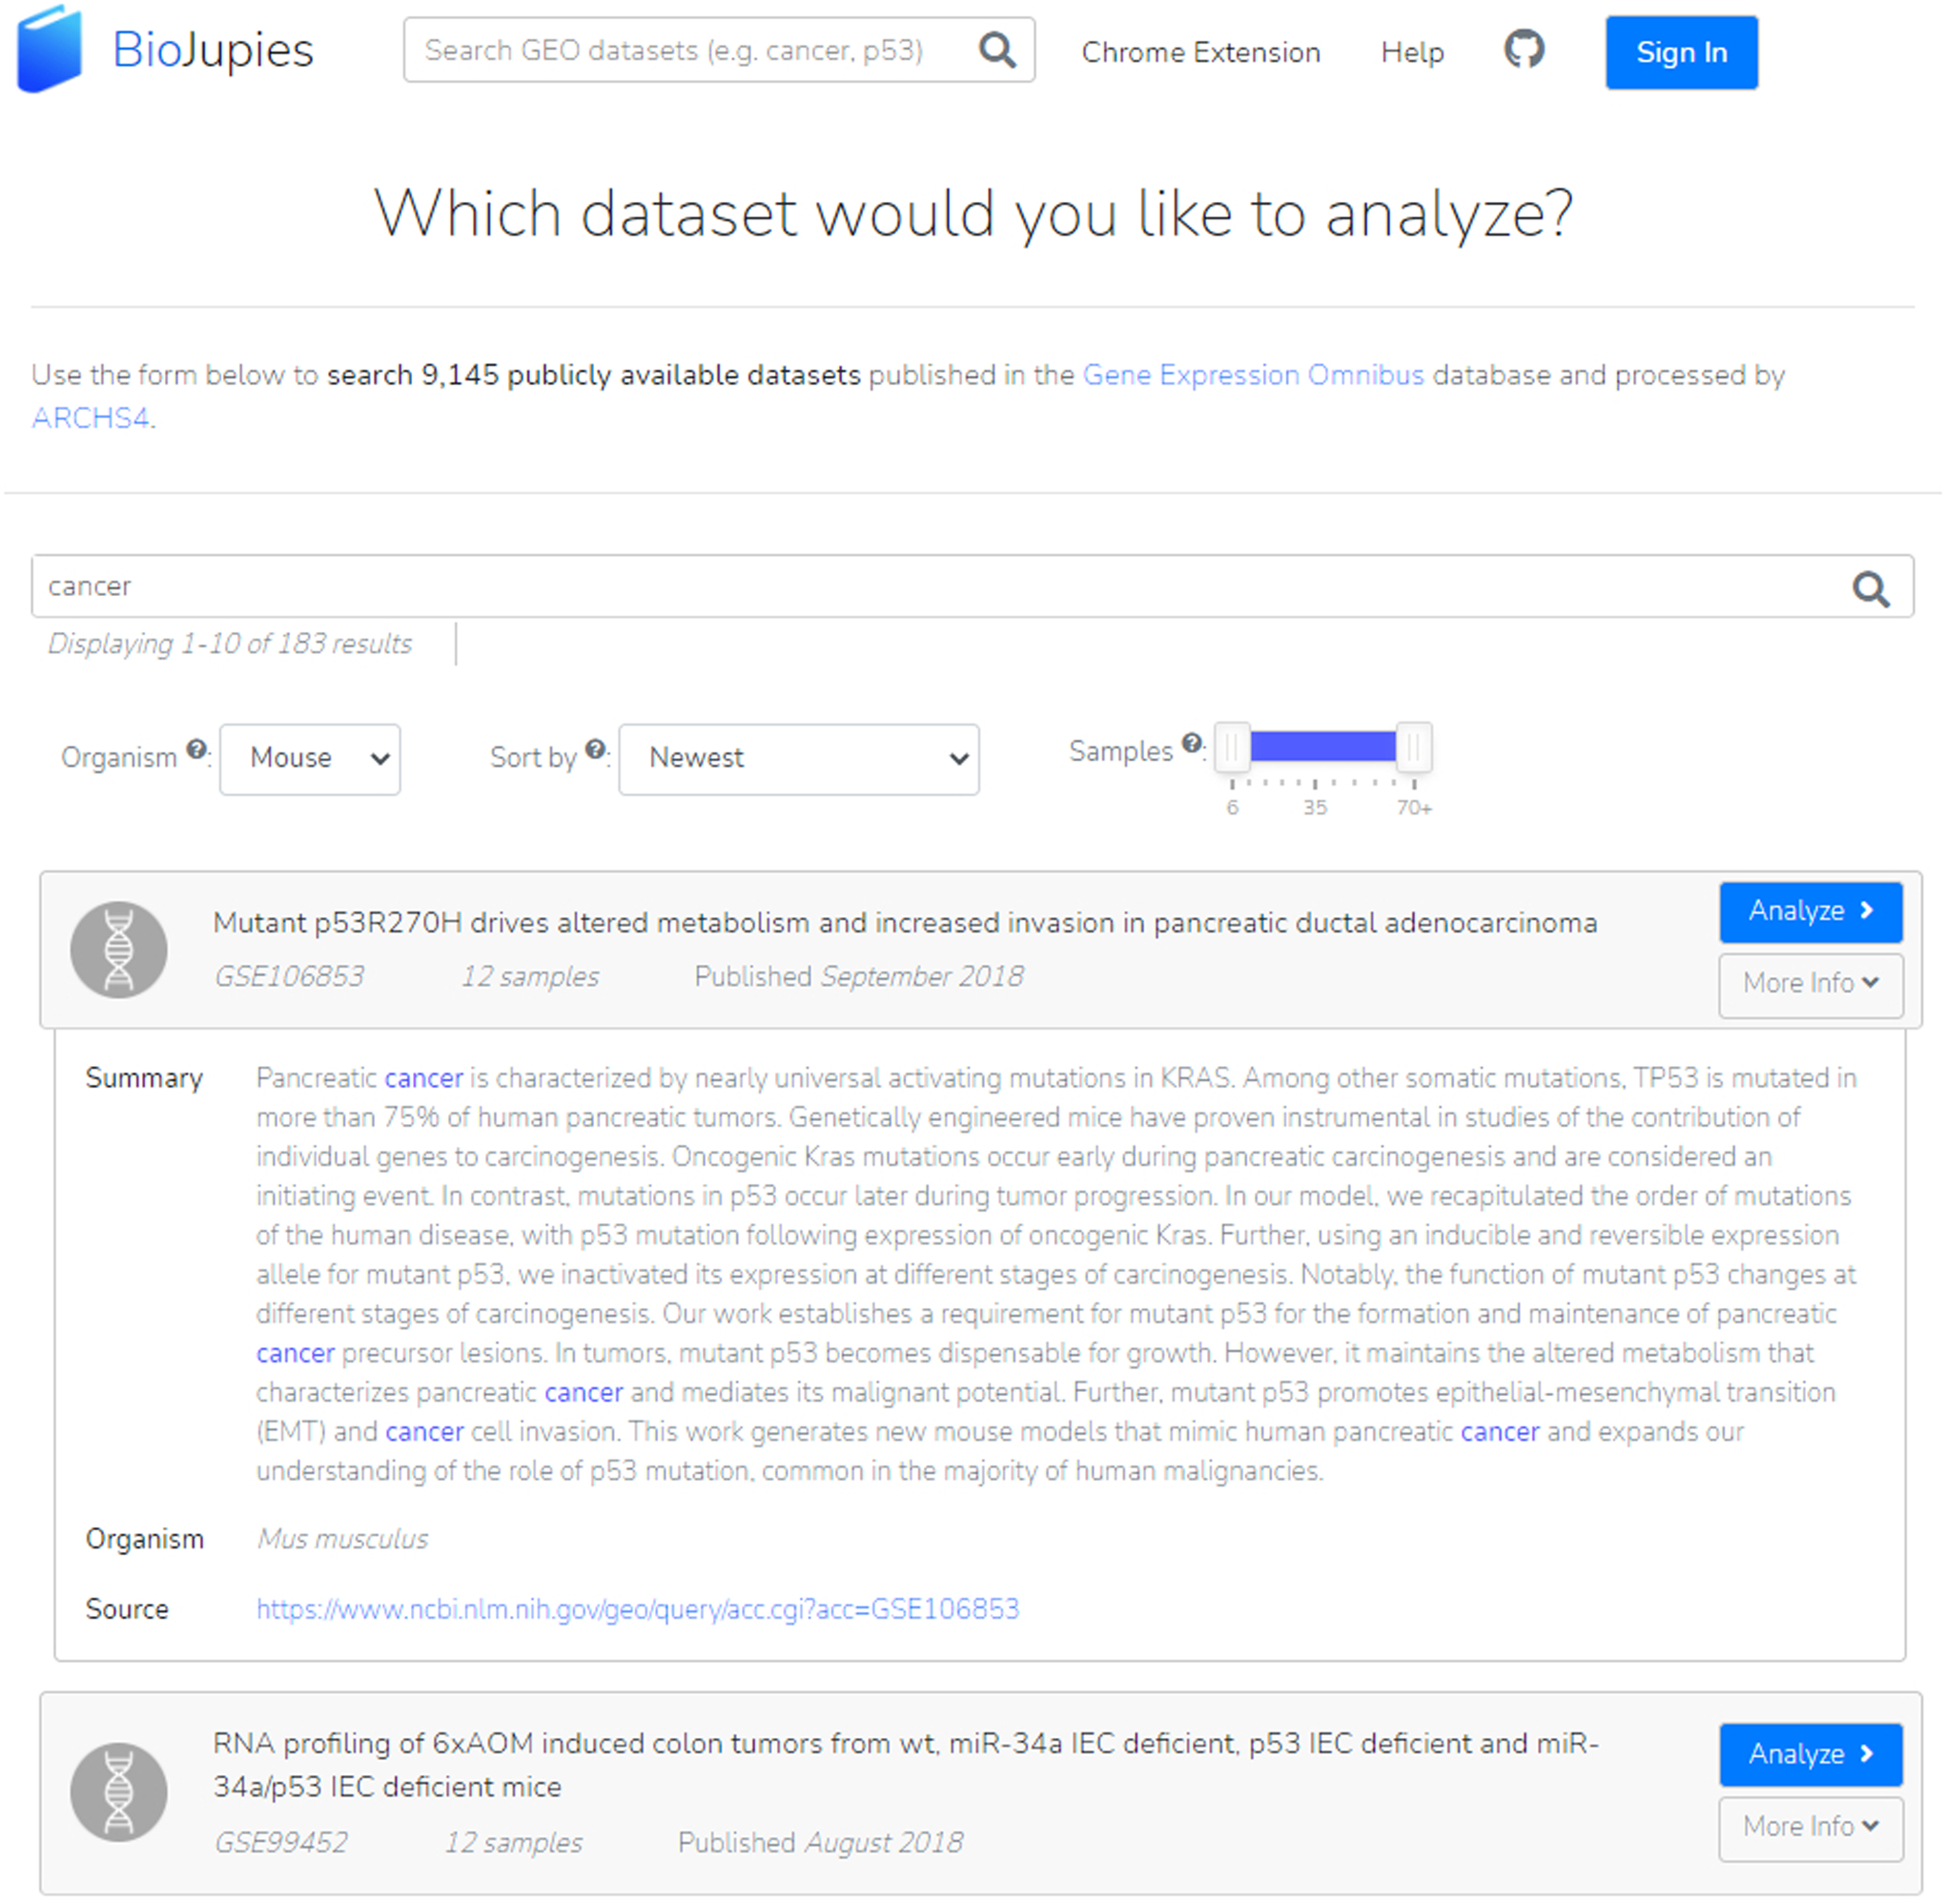
GEO datasets can be searched by key term and filtered by organism type, publication date, and sample size. In this example, we can read more information on a mouse cancer study by accessing the drop-down.
Fig. 20.
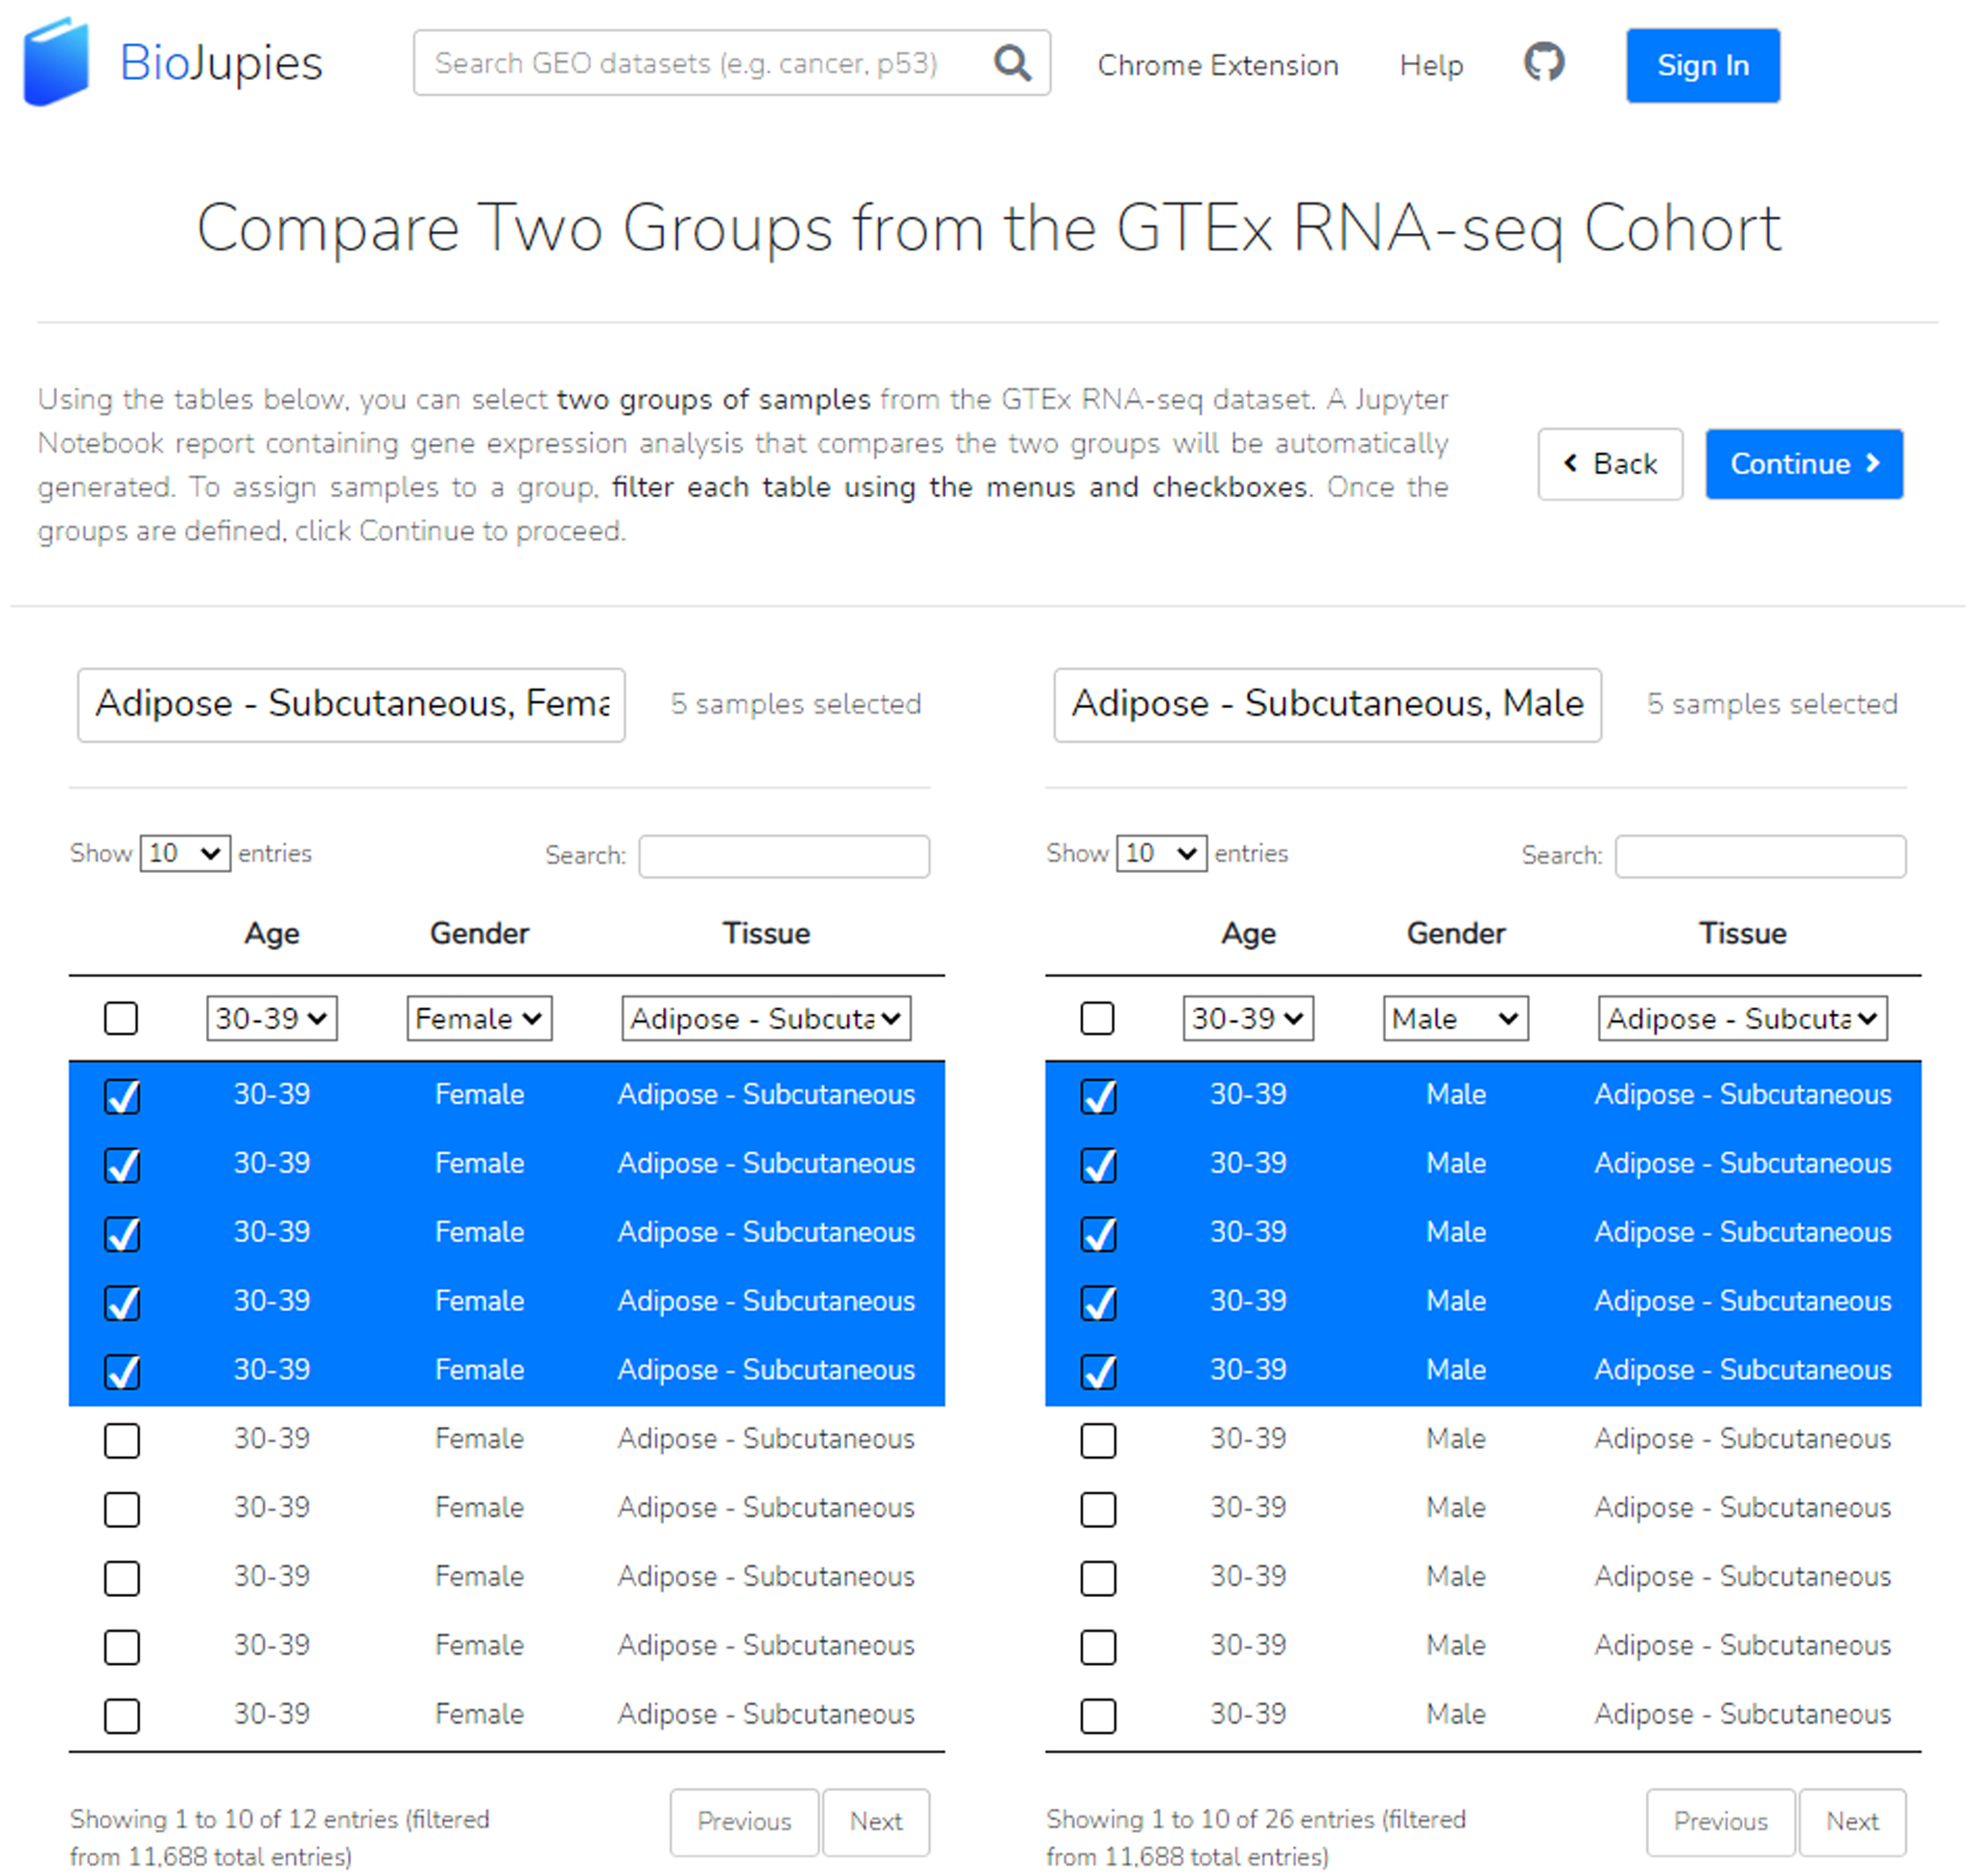
By utilizing the various drop-down menus and the search bar, we can select numerous samples for each of our two labeled groups.
Uploading a raw or pre-processed dataset
-
5
Users have two choices for uploading their RNA-seq data: a gene expression table or raw sequencing data. To upload raw sequencing data, click the button and select your file by selecting the “Choose Files” button, then the “Upload Files” button (Figure 21).
Raw sequencing data must be in fastq.gz file format and less than 5GB in size. Please note that uploaded files may be deleted after one week.
-
6
To upload a gene expression table file, drag and drop the file or click the submission drop-zone to browse and select a file. If successfully uploaded, the file will be previewed on the screen. For our example, we choose “Gene Expression Table” and select our data file, which has already been formatted to successfully upload (Figure 22). Click “Continue” to proceed.
Gene expression table files must be in .txt, .csv, .tsv, .xls, or .xlsx. Please ensure that the table rows are gene symbols, the table columns are samples, and the table values are gene expression counts. BioJupies is optimized to process raw RNA-seq read counts, although normalized read counts are acceptable with appropriate interpretation. The row identifies must be gene symbols instead of Ensembl or Entrez gene IDs for Enrichr to properly interpret the results.
-
7
To manage the metadata associated with each sample, users may either upload a metadata file or manually specify the sample groups. To upload a metadata file, drag and drop the file or click the submission drop-zone to browse and select the file. Users may also manually specify the sample groups by using the provided text boxes next to each sample. For our demonstration, manually identify each sample as belonging to either the control or perturbation group. Click “Continue” to proceed (Figure 23).
BioJupies supports .txt, .csv, .tsv, .xls, or .xlsx file formats for metadata upload.
Fig. 21.
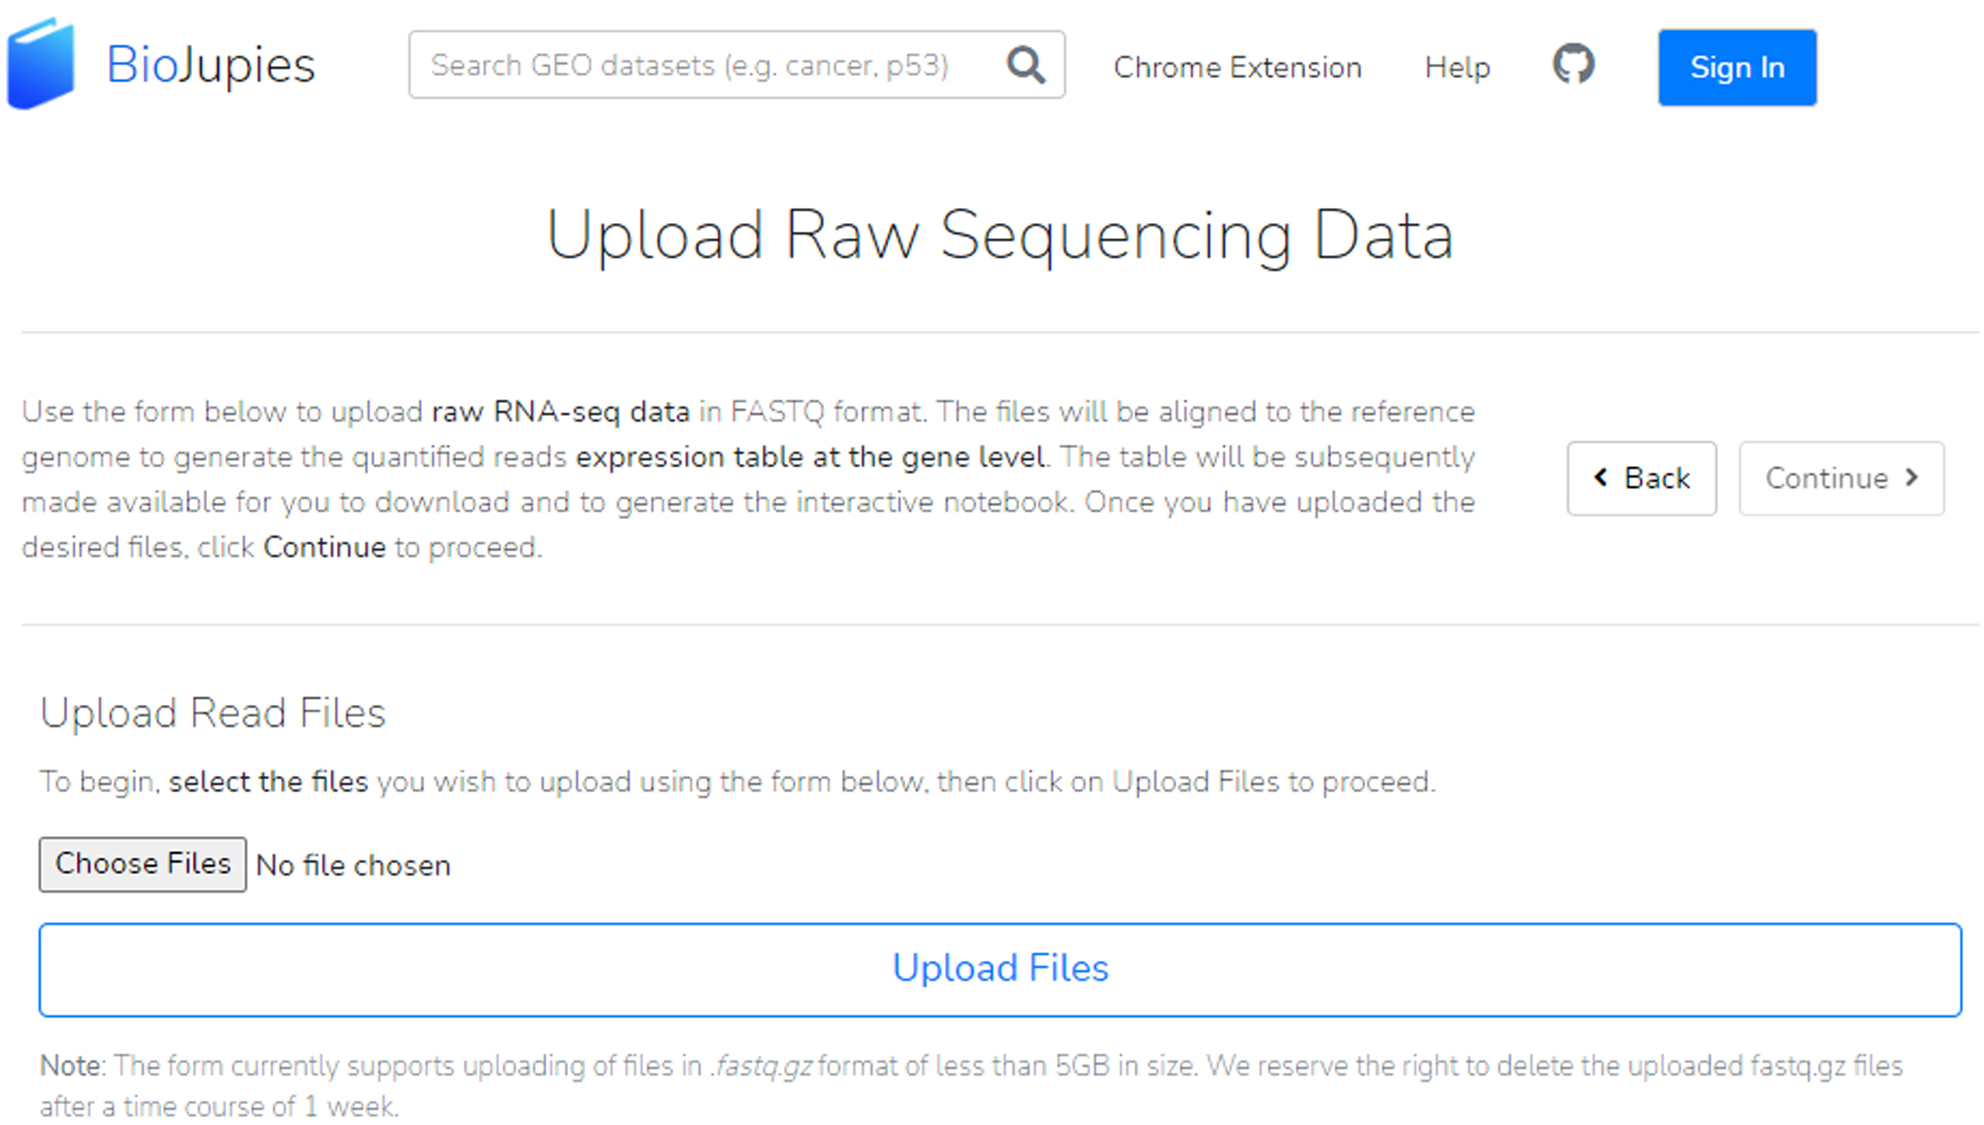
Upload a FASTQ file by clicking the “Choose Files” button and then uploading the files.
Fig. 22.
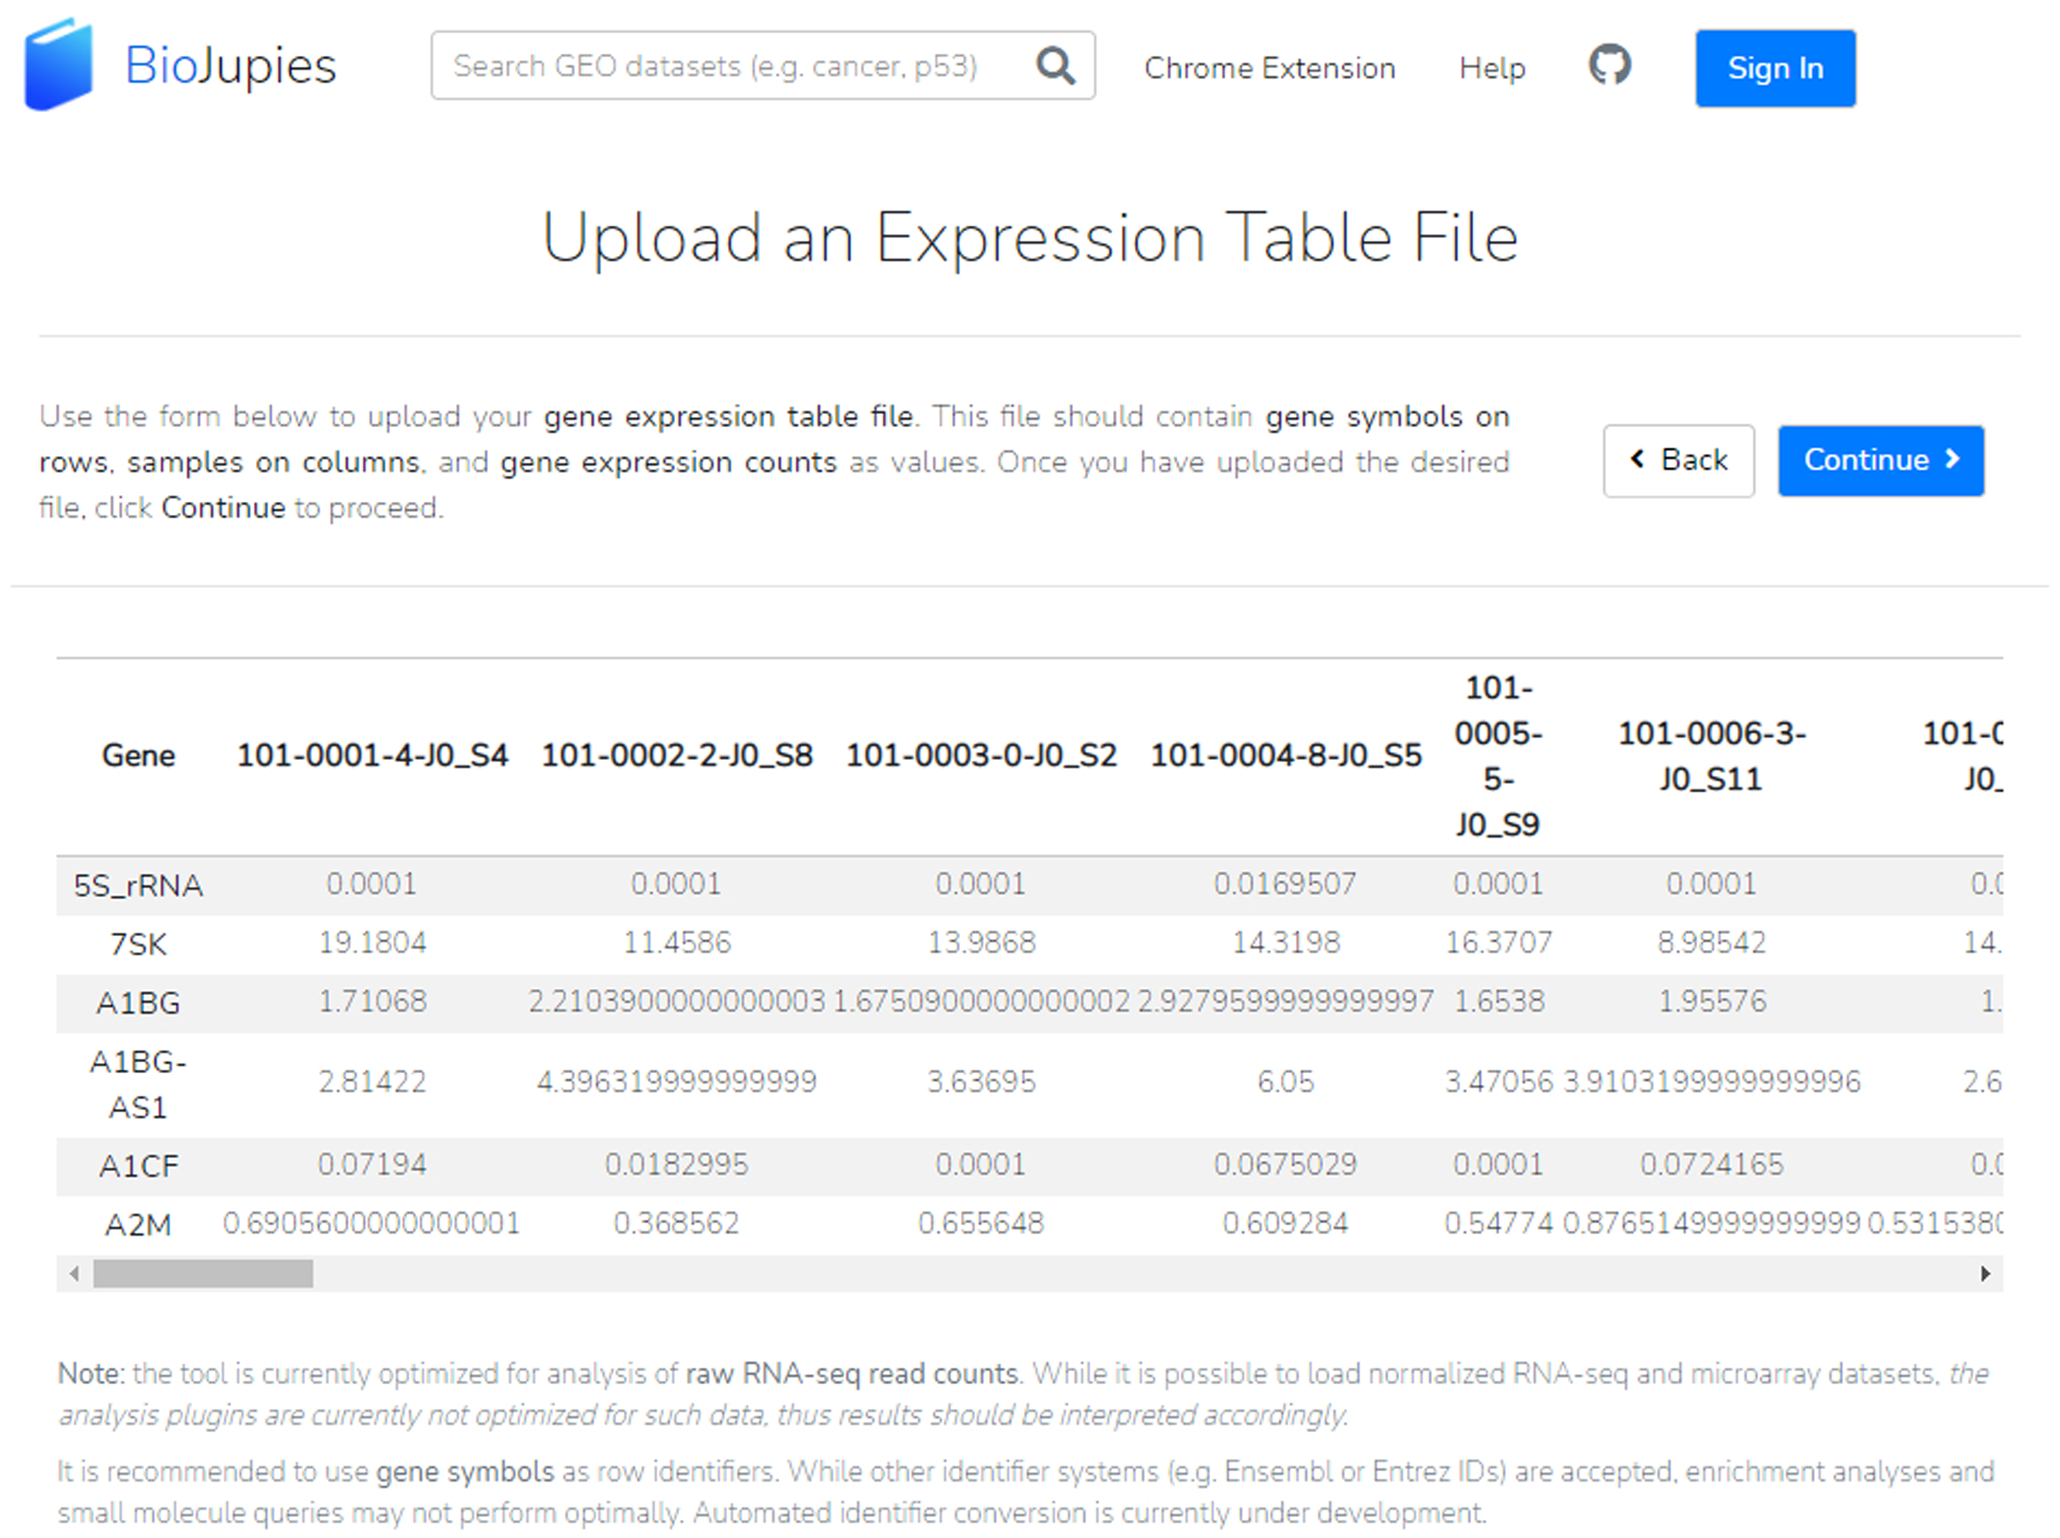
A successfully uploaded expression table file from our GEO dataset; the table is displayed in the middle of the page. Our dataset file was formatted with gene symbols as row identifiers and samples as column identifiers. Metadata should not be included in this file and will be classified in a later step.
Fig. 23.
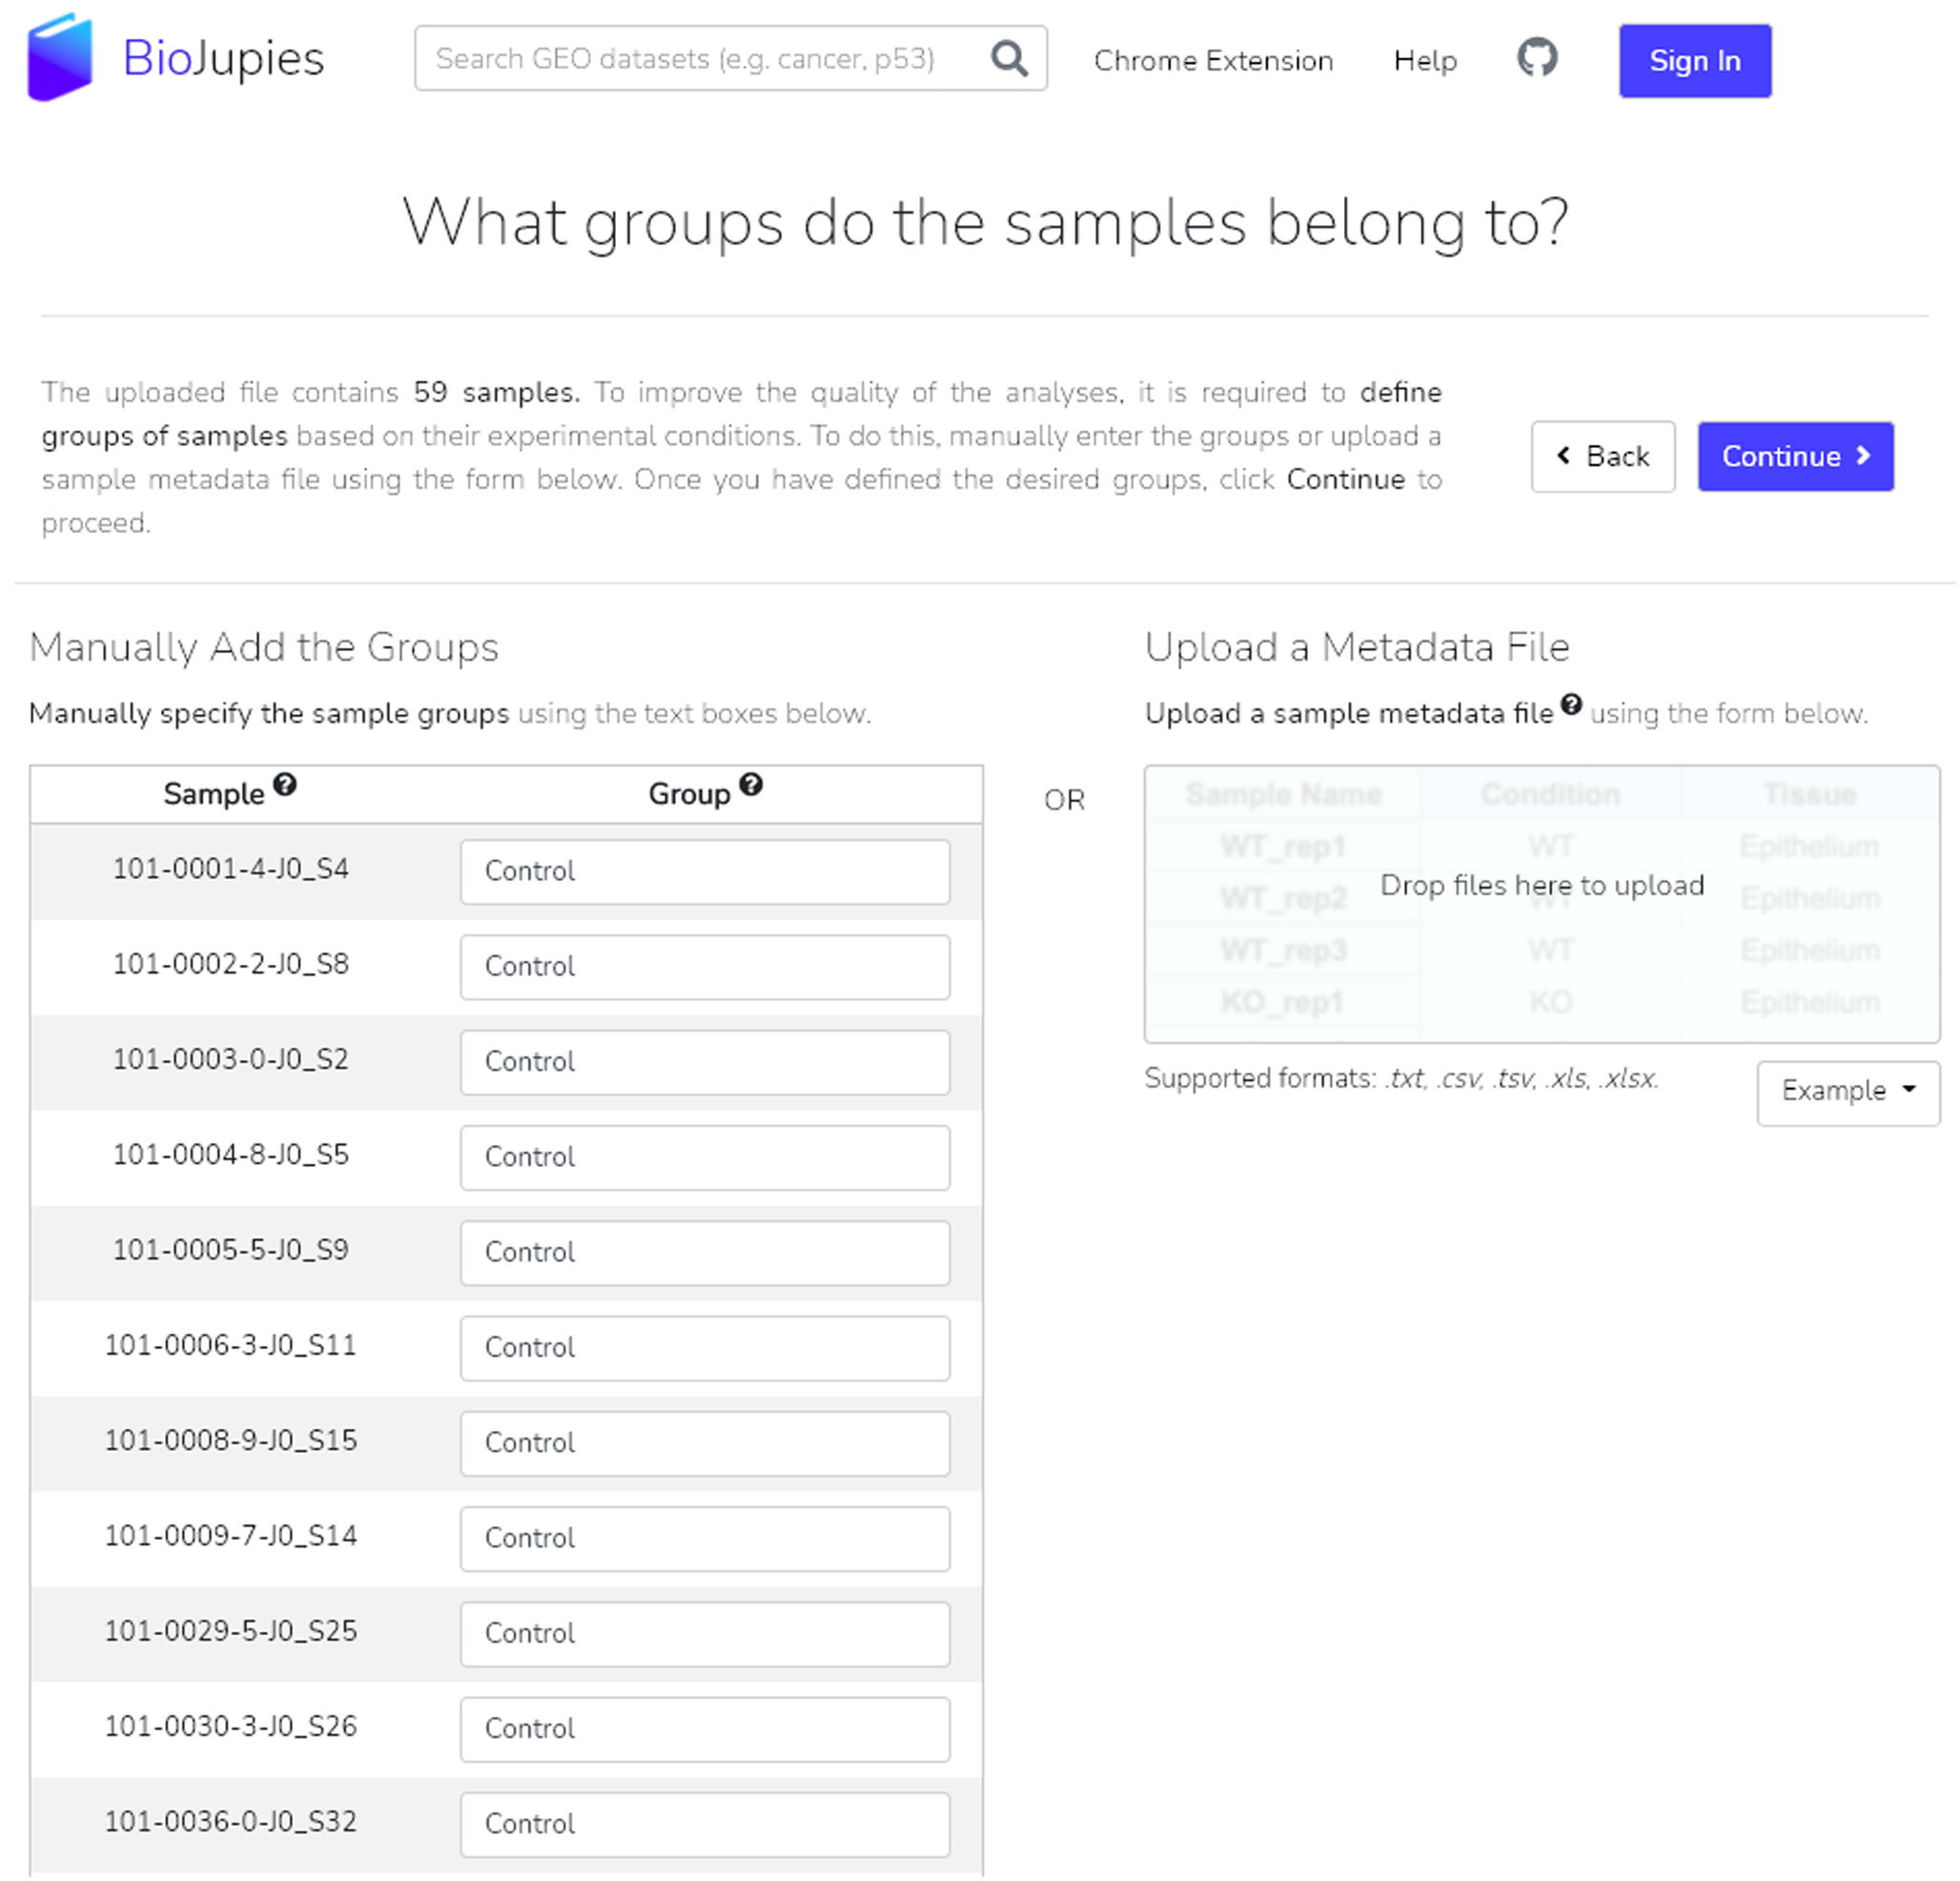
The samples from our example GEO dataset are manually assigned to either the control or perturbation groups. The option to upload a metadata file is available by using the drop-zone.
Customizing and generating the Jupyter notebook
-
8
Users may select various analyses to be displayed in their BioJupies notebook, including Exploratory Data Analysis, Differential Expression Analysis, Enrichment Analysis, and Small Molecule queries. Additional information on each tool is available when you click the “More Info” drop-down button, which will display a tool description, information on the results display, reference citation, and possible further tutorials. Click the “Add +” button to include the analysis in the final BioJupies notebook. Once all desired tools have been selected, scroll back to the top of the page, and click “Continue” to proceed. For our demonstration, add the “Enrichr Links” option under the “Enrichment Analysis” category (Figure 24). This will provide us links to further explore enrichment analysis in Enrichr for the identified differentially expressed genes.
-
9
To generate a gene expression signature an additional step asks users to designate samples to one of two defined groups. Manually label samples that you wish to belong to one of the two groups by using the drop-down adjacent to each sample (Figure 25). Alternatively, you may toggle the “Predict Groups” to have BioJupies automatically designate samples to their groups based on assigned names. Once completed, click “Continue” to proceed.
It is recommended that each group contains at least three samples.
-
10
You may customize your notebook by adding a title and biotags, in addition to modifying parameters on the following page. Click the “Modify parameters” button next to each analysis to customize its results (Figure 26). When finished, click the “Generate Notebook” button.
A loading screen will inform about the estimated time needed for the notebook generation, typically less than 2 minutes. More analyses or larger files may result in longer wait times.
-
11
The notebook is complete (Figure 27). To open it, click the notebook name, the purple “Open Notebook” button at the top right of the results section, or the “Open notebook” thumbnail. Users can share their notebook via Twitter, email, or by copying the link. In addition, users may choose to re-analyze their dataset or begin a new notebook by selecting the appropriate buttons.
-
12
A table of contents greets the user when the Jupyter notebook opens (Figure 28). The user may navigate the table of contents to their desired analysis or browse through the posted results. Find the Enrichr links to the upregulated and downregulated differentially expressed genes within the notebook (Figure 29). When clicked, the user will be brought to Enrichr.
-
13
To understand the Enrichr analysis results, please follow the instructions of Basic Protocol 1 beginning at Step 4.
Fig. 24.
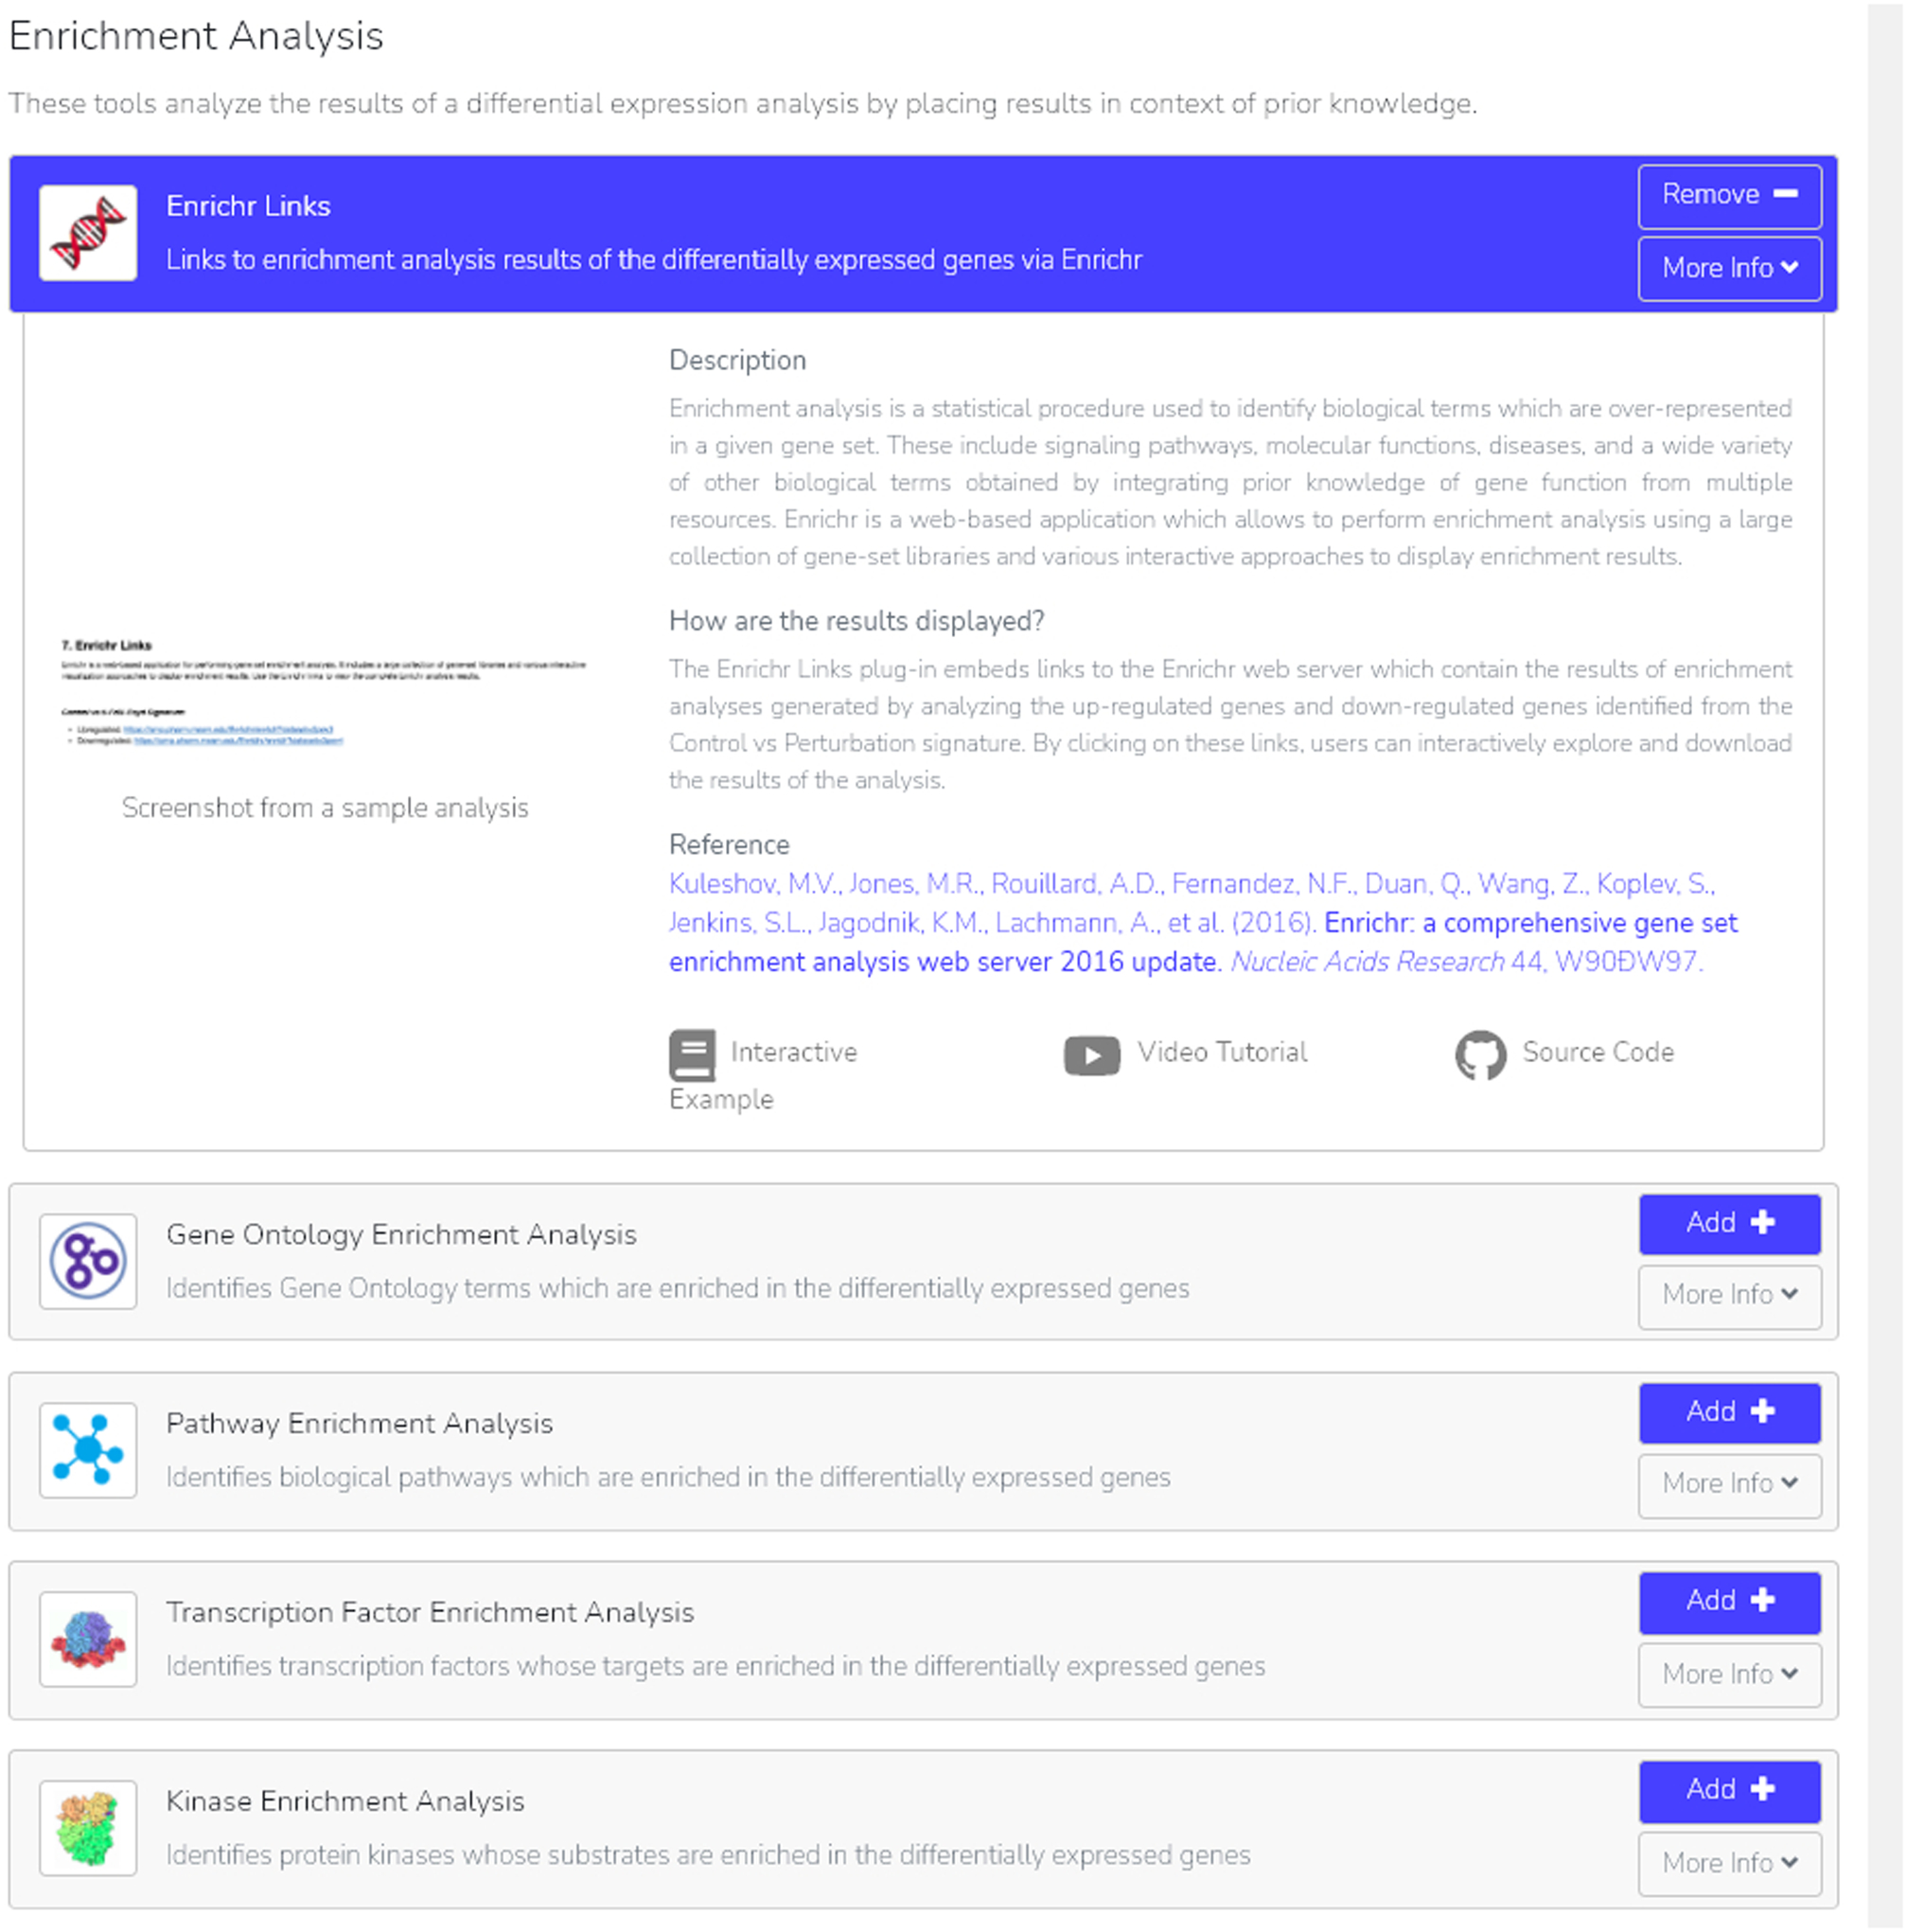
The “Enrichr Links” option is added to our BioJupies notebook. By selecting “More Info”, we are able to see additional information on Enrichr links, what and how to interpret the displayed results, a reference to the tool, plus both an interactive example and video tutorial.
Fig. 25.
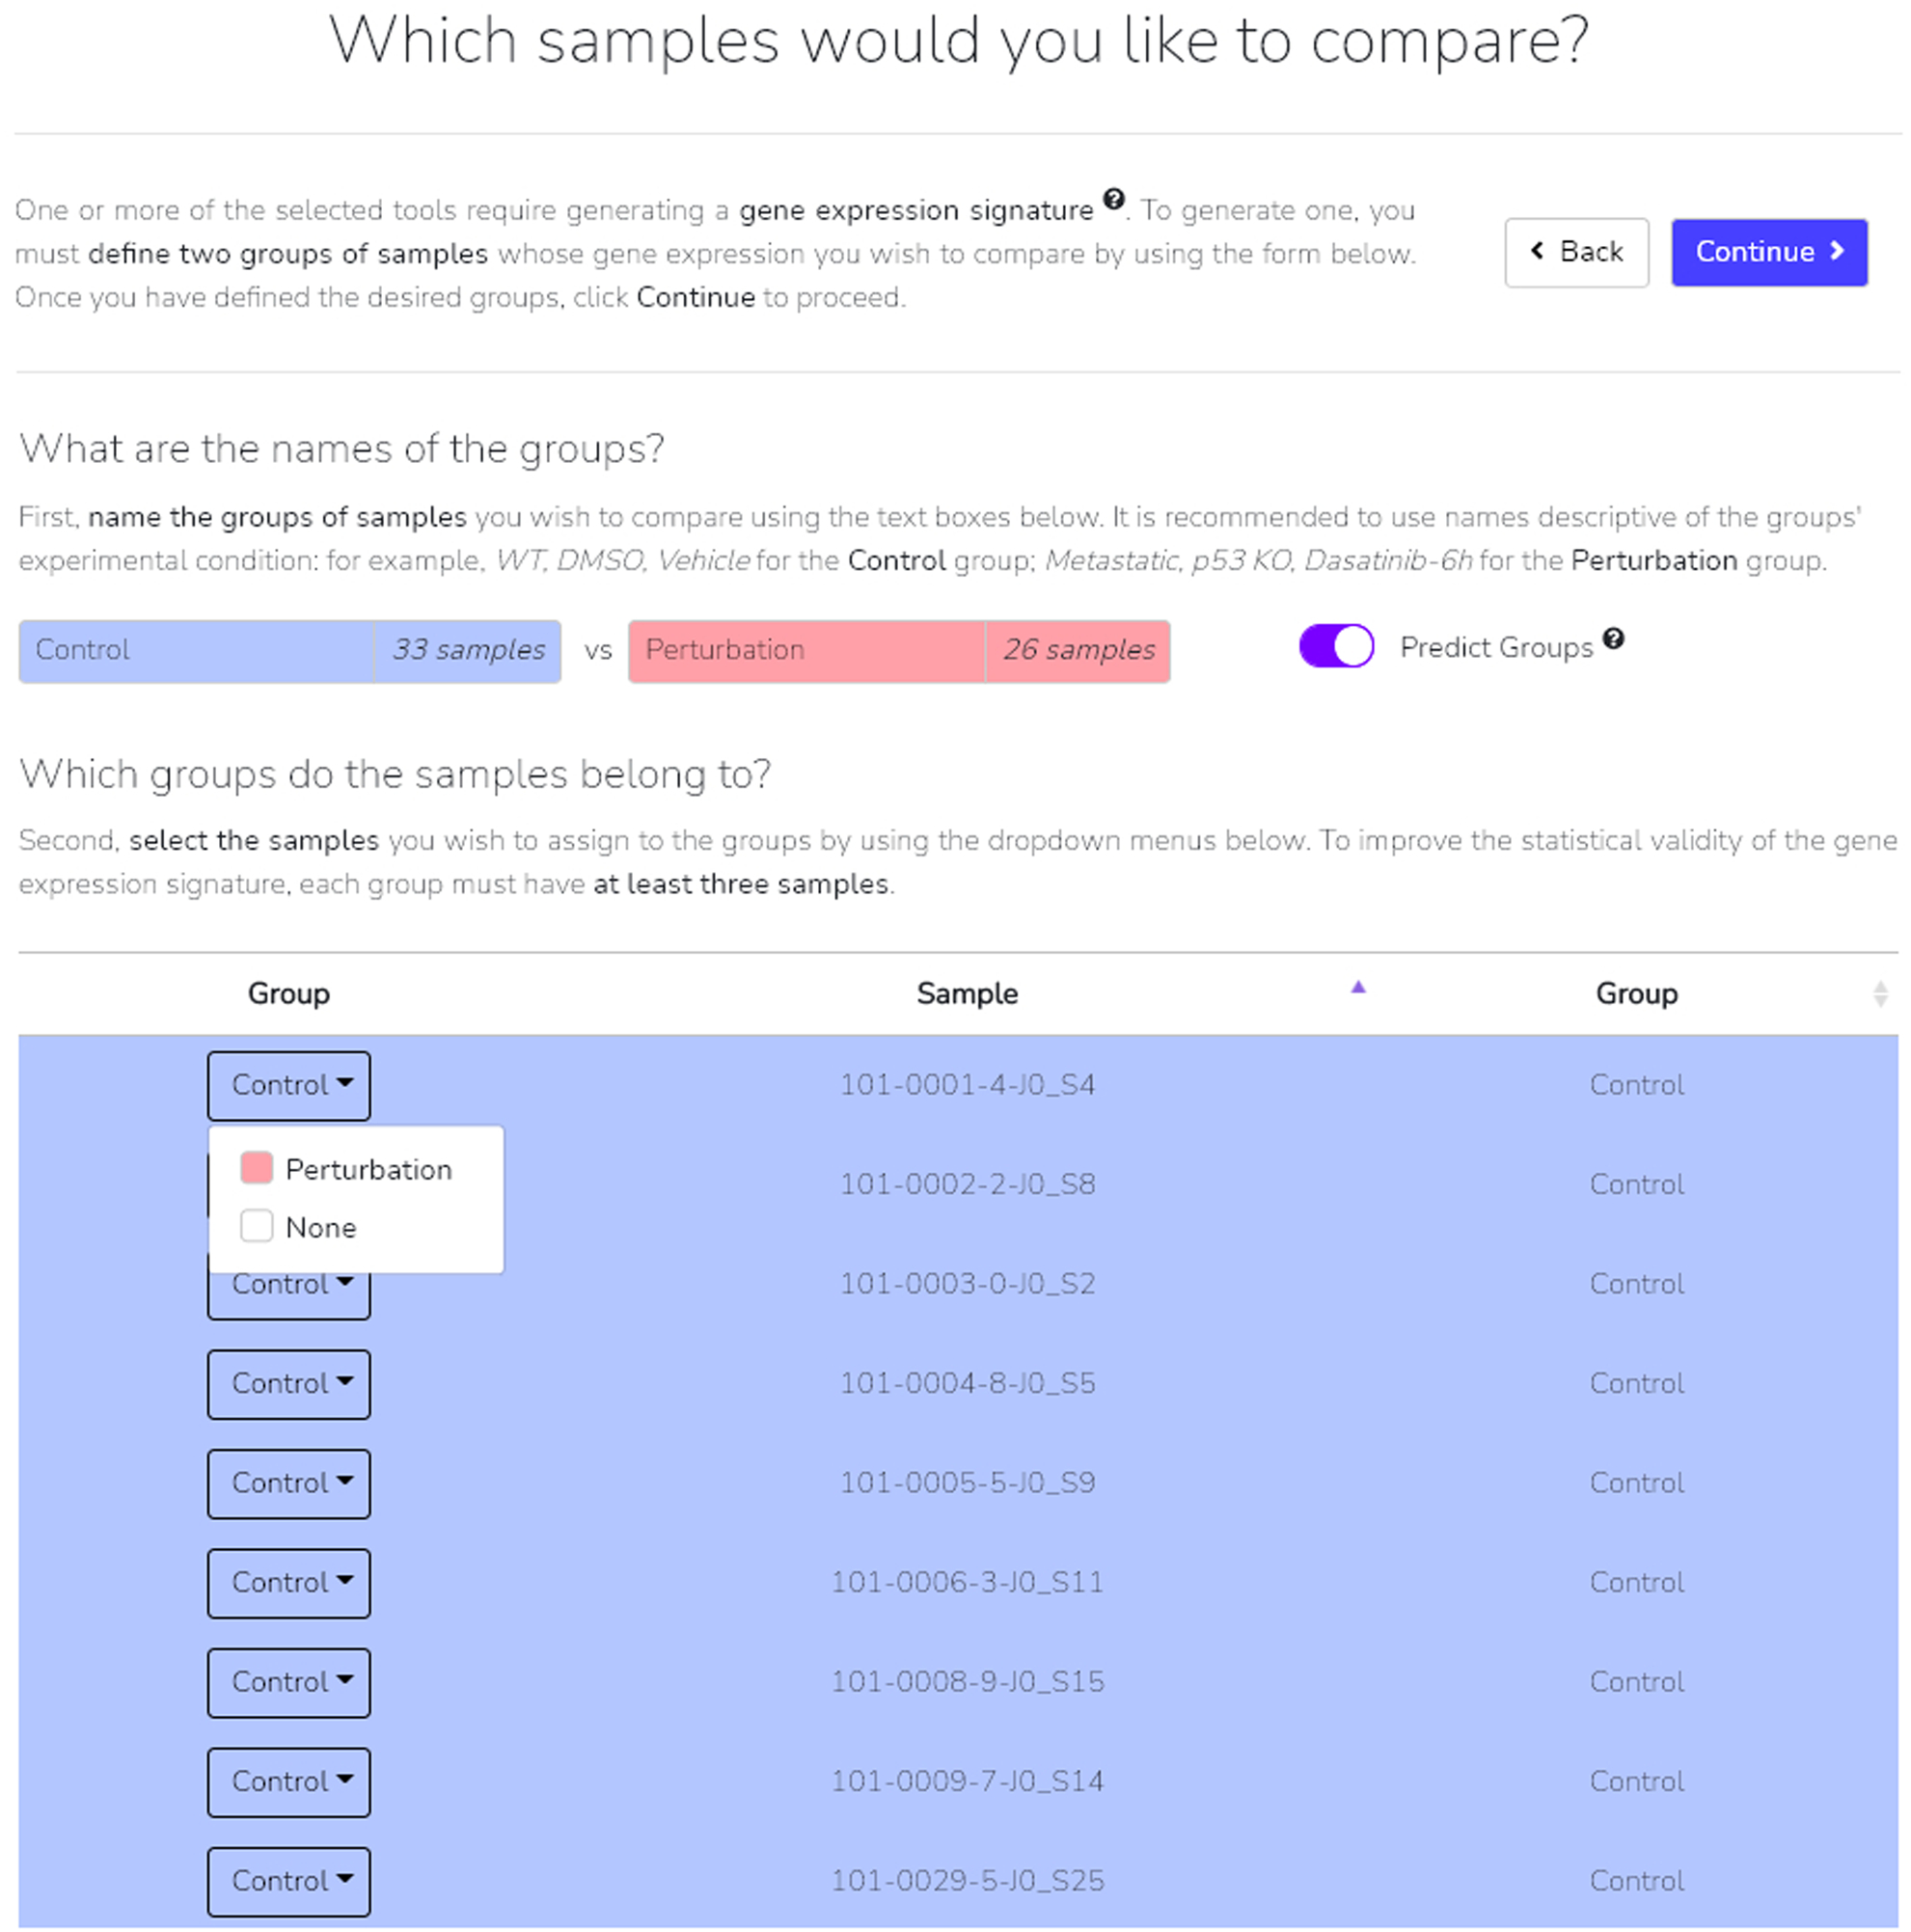
The “Predict Group” option is toggled on, commanding BioJupies to automatically assign each sample to one of two groups as specified near the top of the page. Clicking the drop-down on each row allows you to manually assign each sample.
Fig. 26.
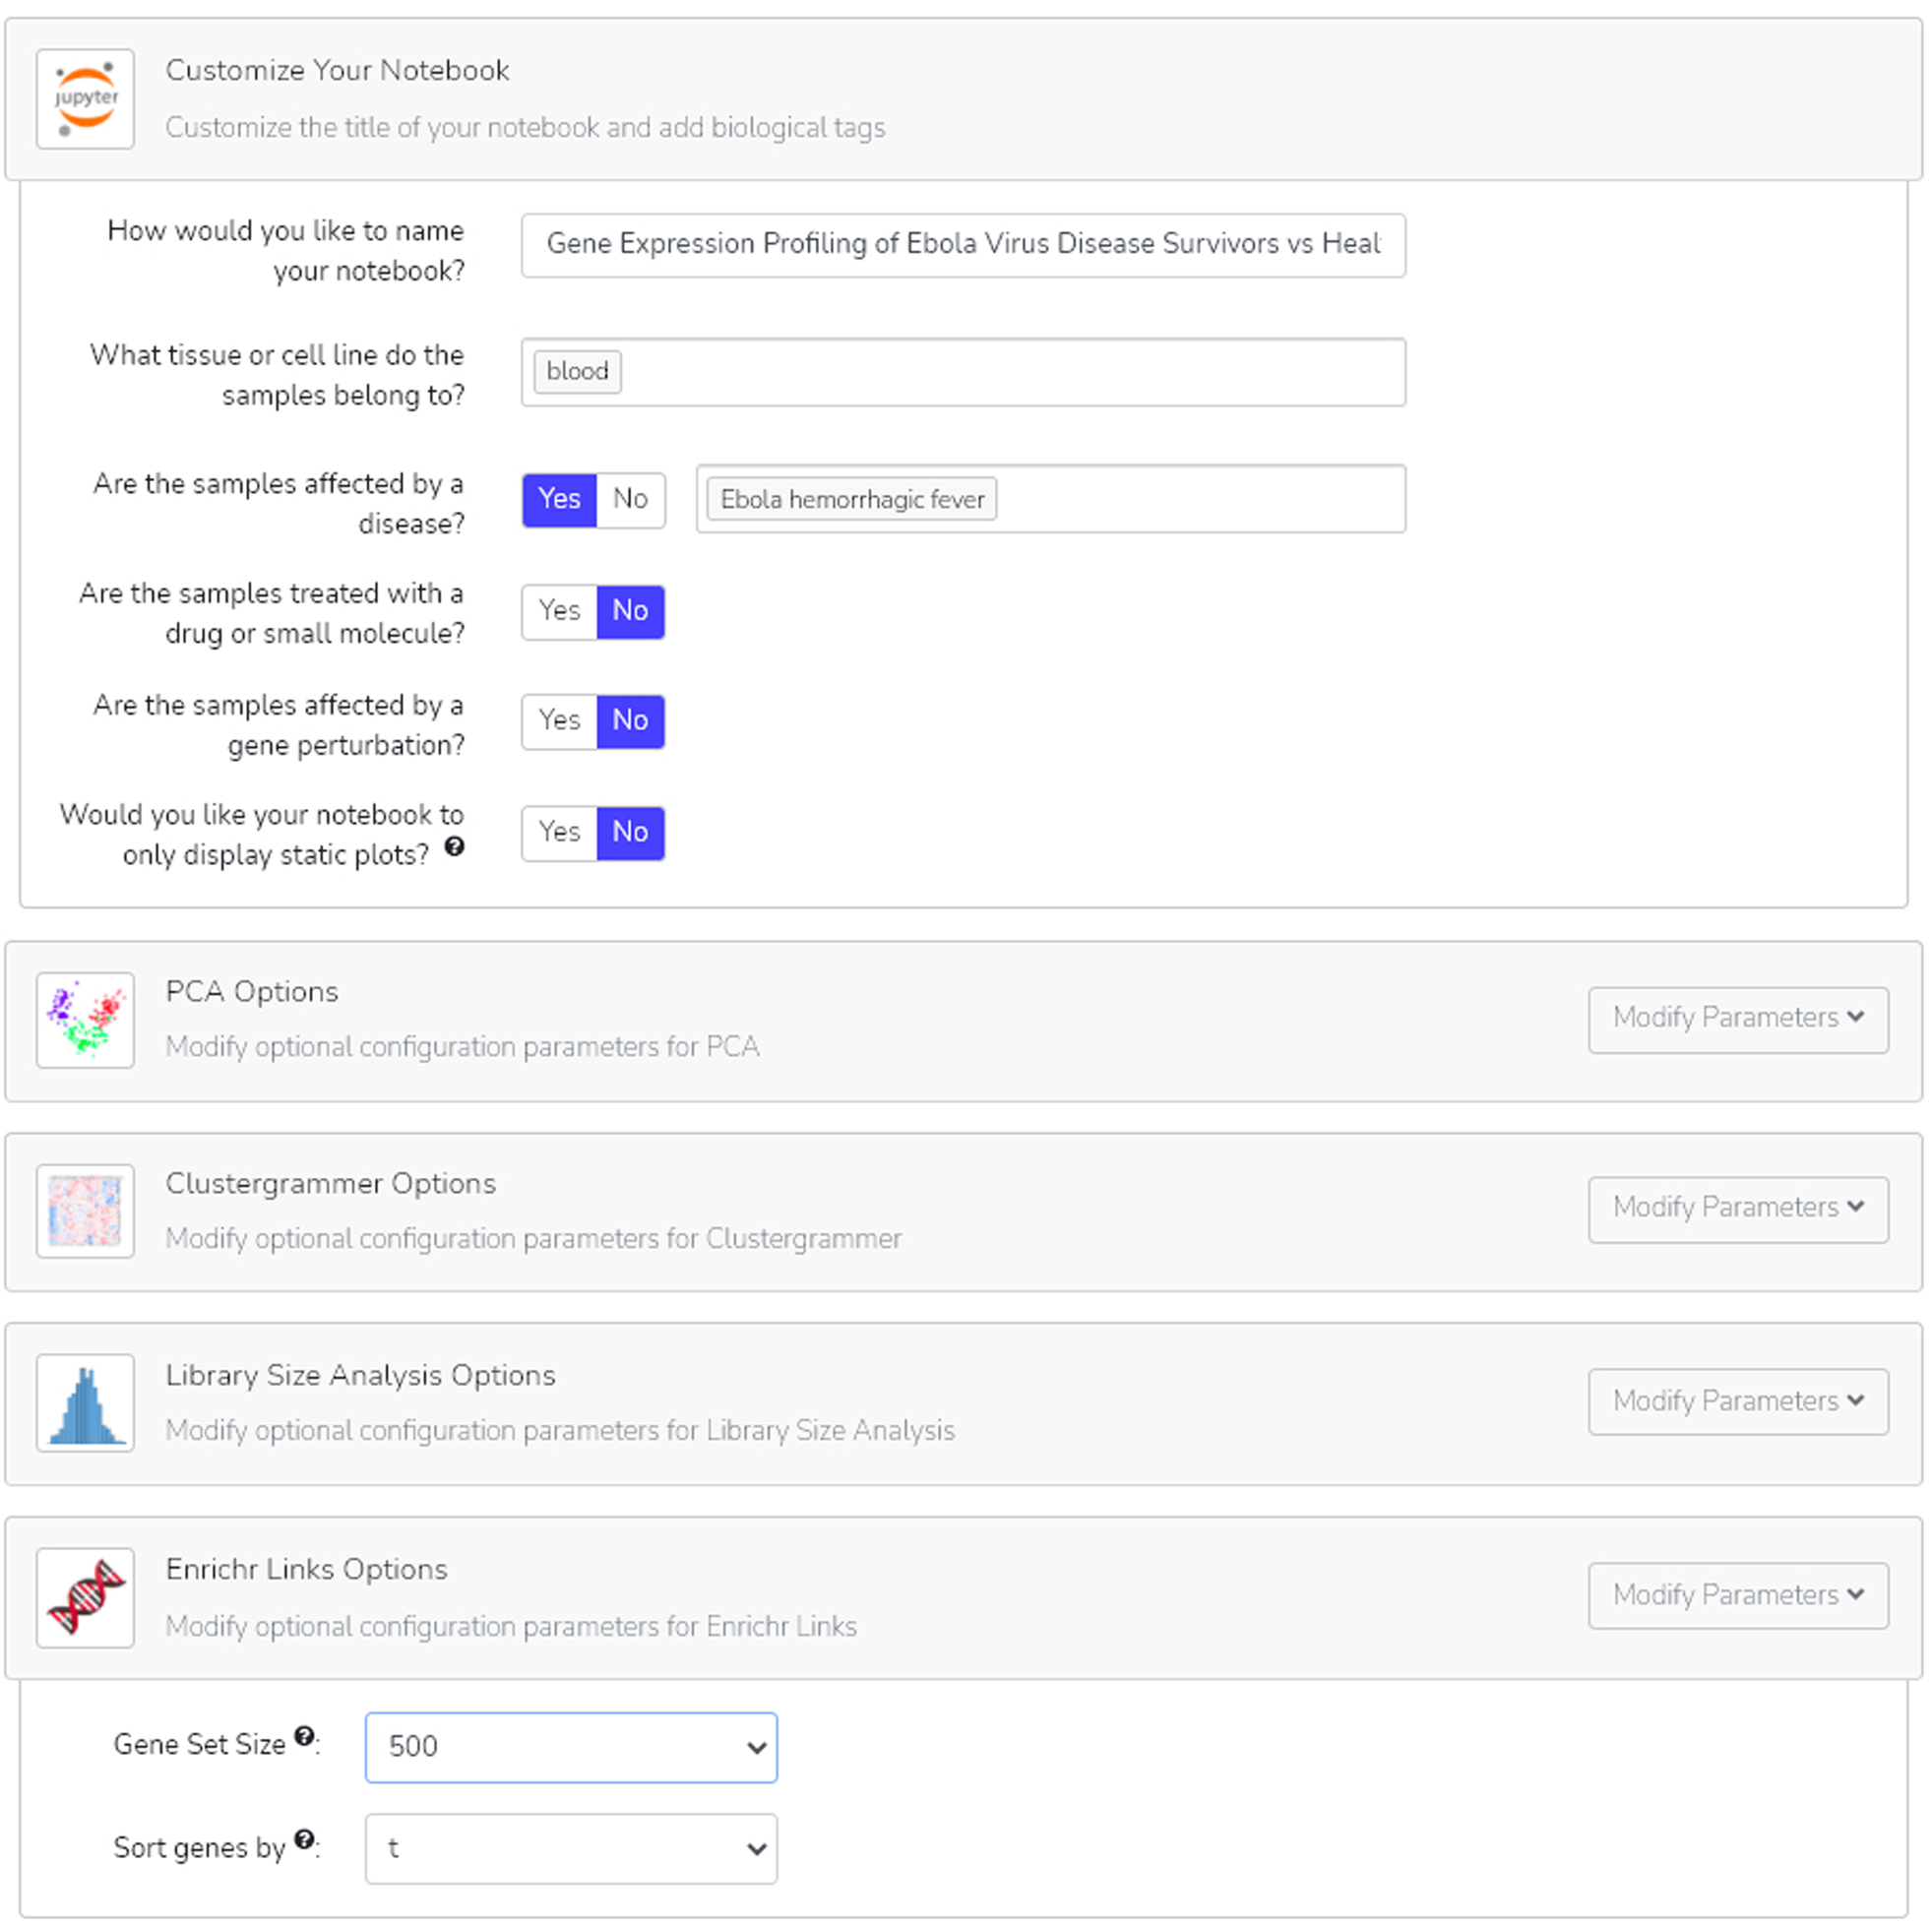
After customizing the title of our notebook and adding biotags, browse through the additional parameter options to specify the results of your analyses. For Enrichr links, both the gene set size and gene sort method can be modified.
Fig. 27.

The completed notebook can be opened a multitude of ways: clicking the notebook title name, clicking the “Open Notebook” button, or by clicking the thumbnail. Options to share the notebook or create a new notebook are also available at this point.
Fig. 28.
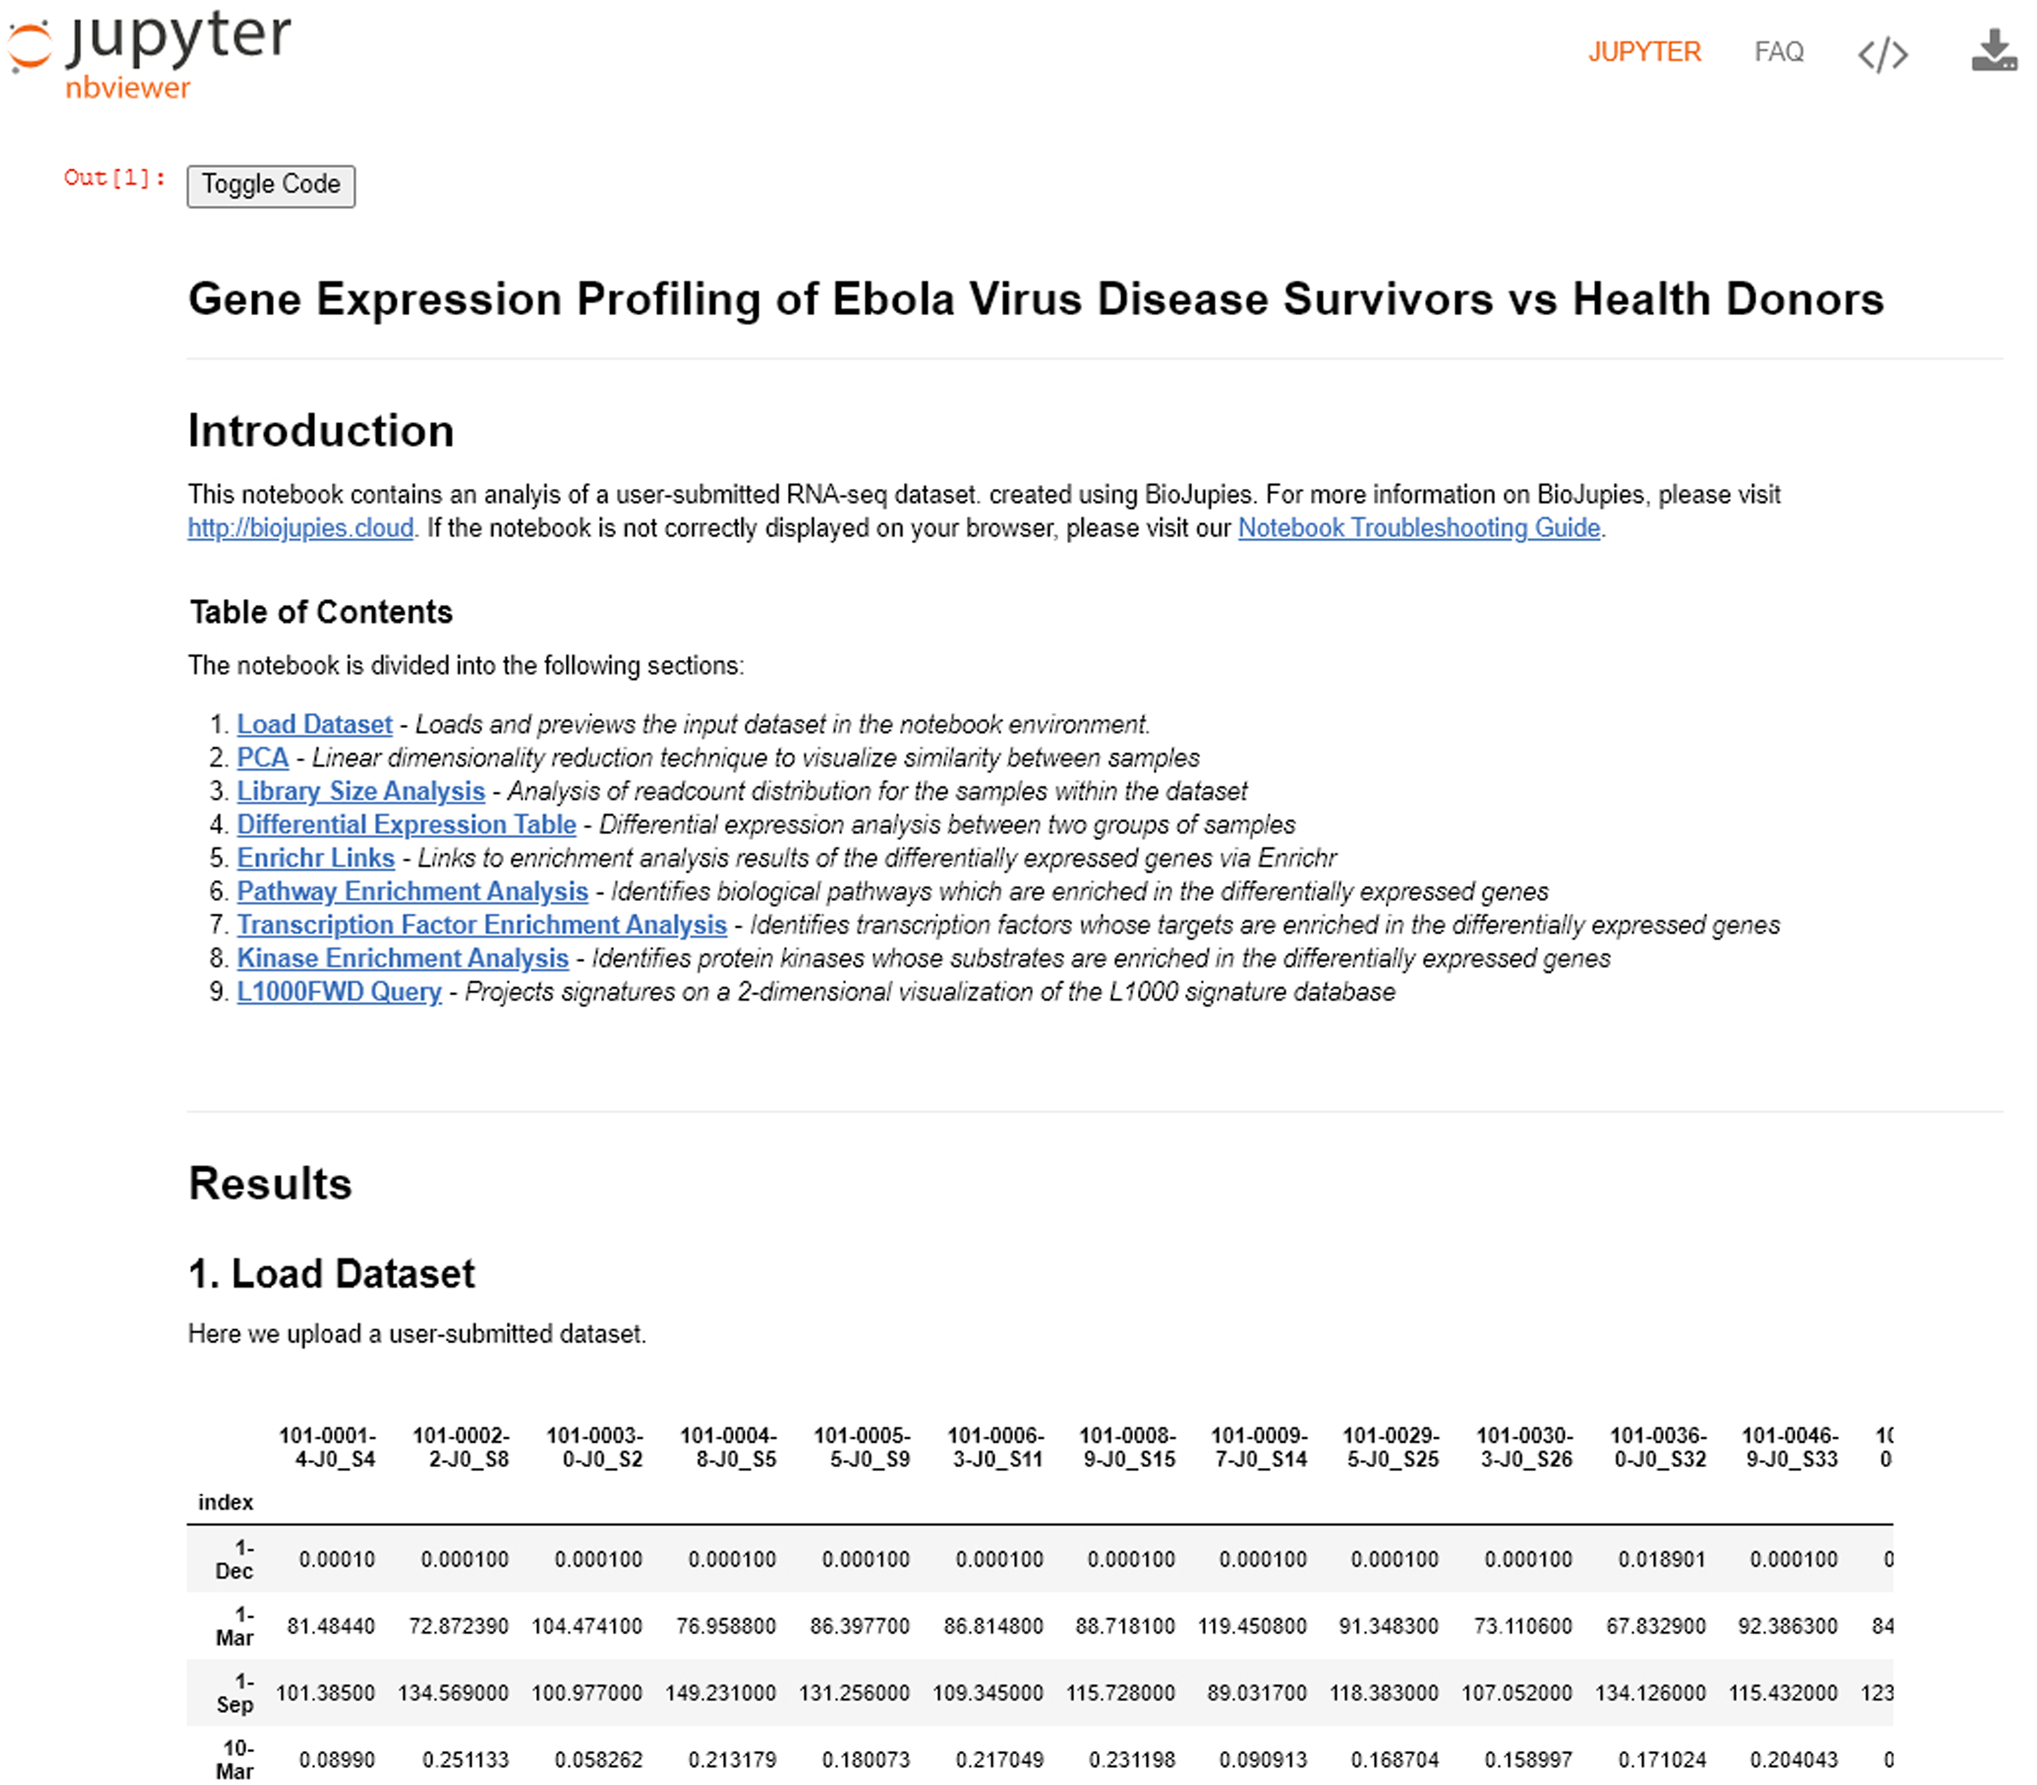
The newly-generated BioJupies notebook includes an introduction, table of contents, and the user-selected analyses sequentially listed. To access the Enrichr Links in this example, click the link presented in option 5 in the table of contents, or scroll down until you see the analyses.
Fig. 29.

The Enrichr links are broken down into differentially expressed up-regulated or down-regulated genes. Clicking the link brings the gene sets to Enrichr.
Basic Protocol 4
Analyzing gene sets for model organisms using modEnrichr
modEnrichr (https://maayanlab.cloud/modEnrichr/) (Kuleshov et al., 2019) is a suite of Enrichrs that includes enrichment analysis tools for the model organisms D. melanogaster (FlyEnrichr), S. cerevisiae (YeastEnrichr), C. elegans (WormEnrichr), and D. rerio (FishEnrichr). The various model organism tools operate identically to the original Enrichr. The modEnrichr homepage provides additional services including the ability to identify the origin organism of the gene set. Once identified, the gene set is automatically directed to the correct model organism Enrichr. modEnrichr also performs ortholog conversion between species.
Necessary Resources:
Hardware – Desktop or a laptop computer, or a mobile device, with a fast Internet connection
Software – An up-to-date web browser such as Google Chrome (https://www.google.com/chrome/), Mozilla Firefox (https://www.mozilla.org/en-US/firefox/), Apple Safari (https://www.apple.com/safari/), or Microsoft Edge (https://www.microsoft.com/en-us/edge).
Protocol steps and annotations:
-
1
Navigate to the modEnrichr homepage (https://maayanlab.cloud/modEnrichr/) (Figure 30).
-
2
If the model organism is known, select the appropriate enrichment analysis tool from the list on the right of the page (Figure 30).
Fig. 30.
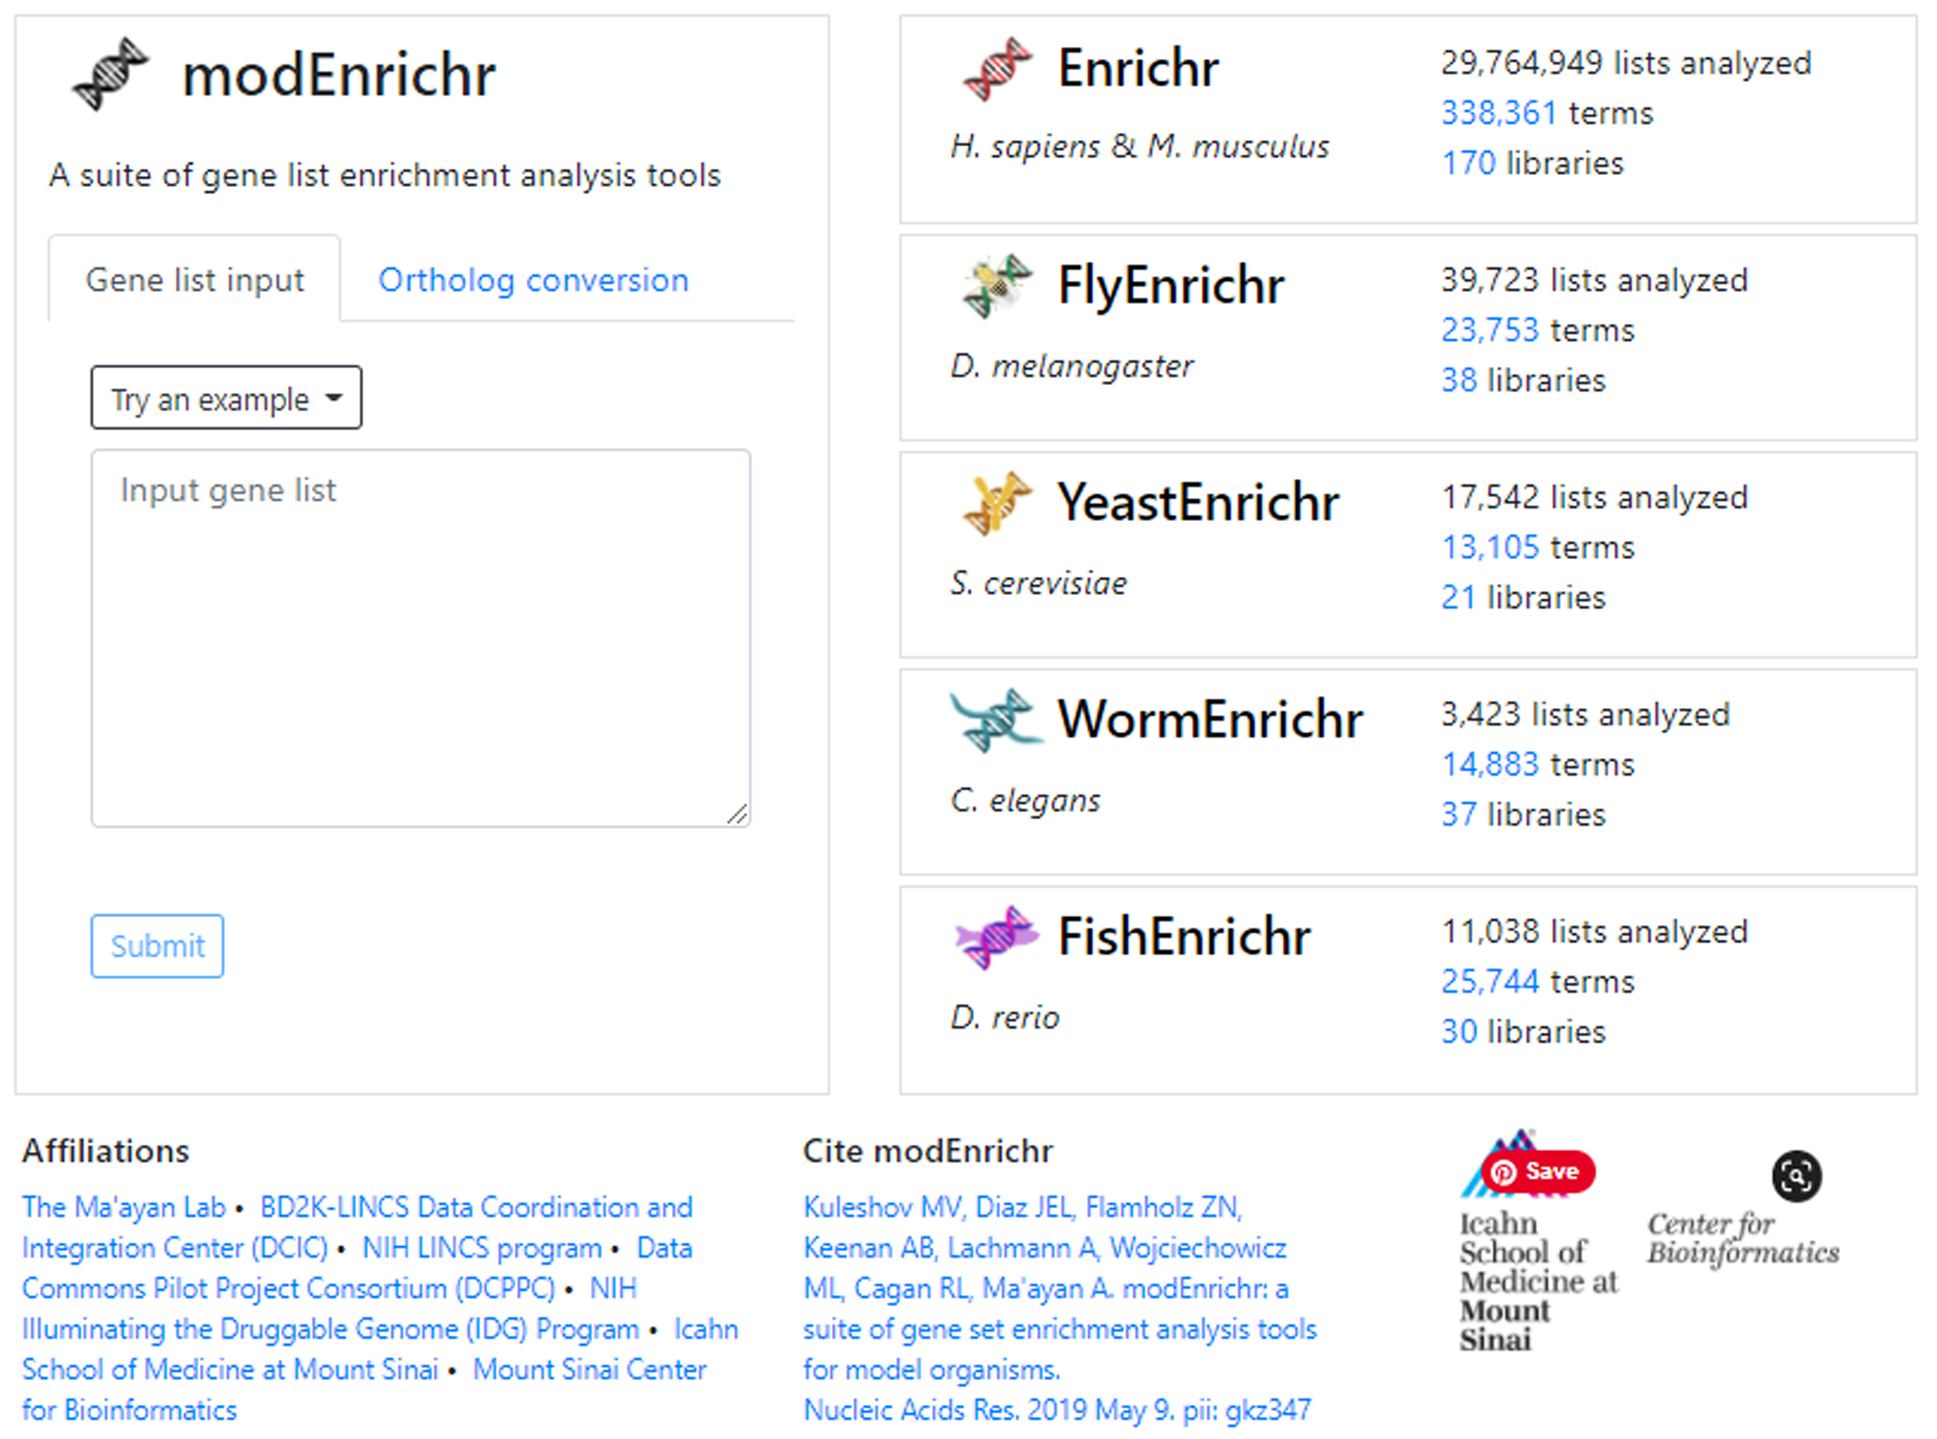
Homepage of modEnrichr. The various model organism enrichment analysis tools listed on the right are clickable and will bring you straight to their respective homepage.
Automatically identifying the model organism gene set origin
-
3
It is also possible not to specify the target model organism with modEnrichr, first ensure that the “Gene list input” tab is active. Paste a list of Entrez gene symbols in the provided text box. modEnrichr will automatically detect the organism and present the user with a link to the appropriate modEnrichr tool. Click the “Submit to…” button at the bottom of the text box to send the gene set to the automatically detected enrichment analysis page (Figure 31).
A minimum of 20 genes is recommended for better results. If a mixture of genes from differing organisms are inputted, modEnrichr will send you to the database of the most representative organism.
Fig. 31.
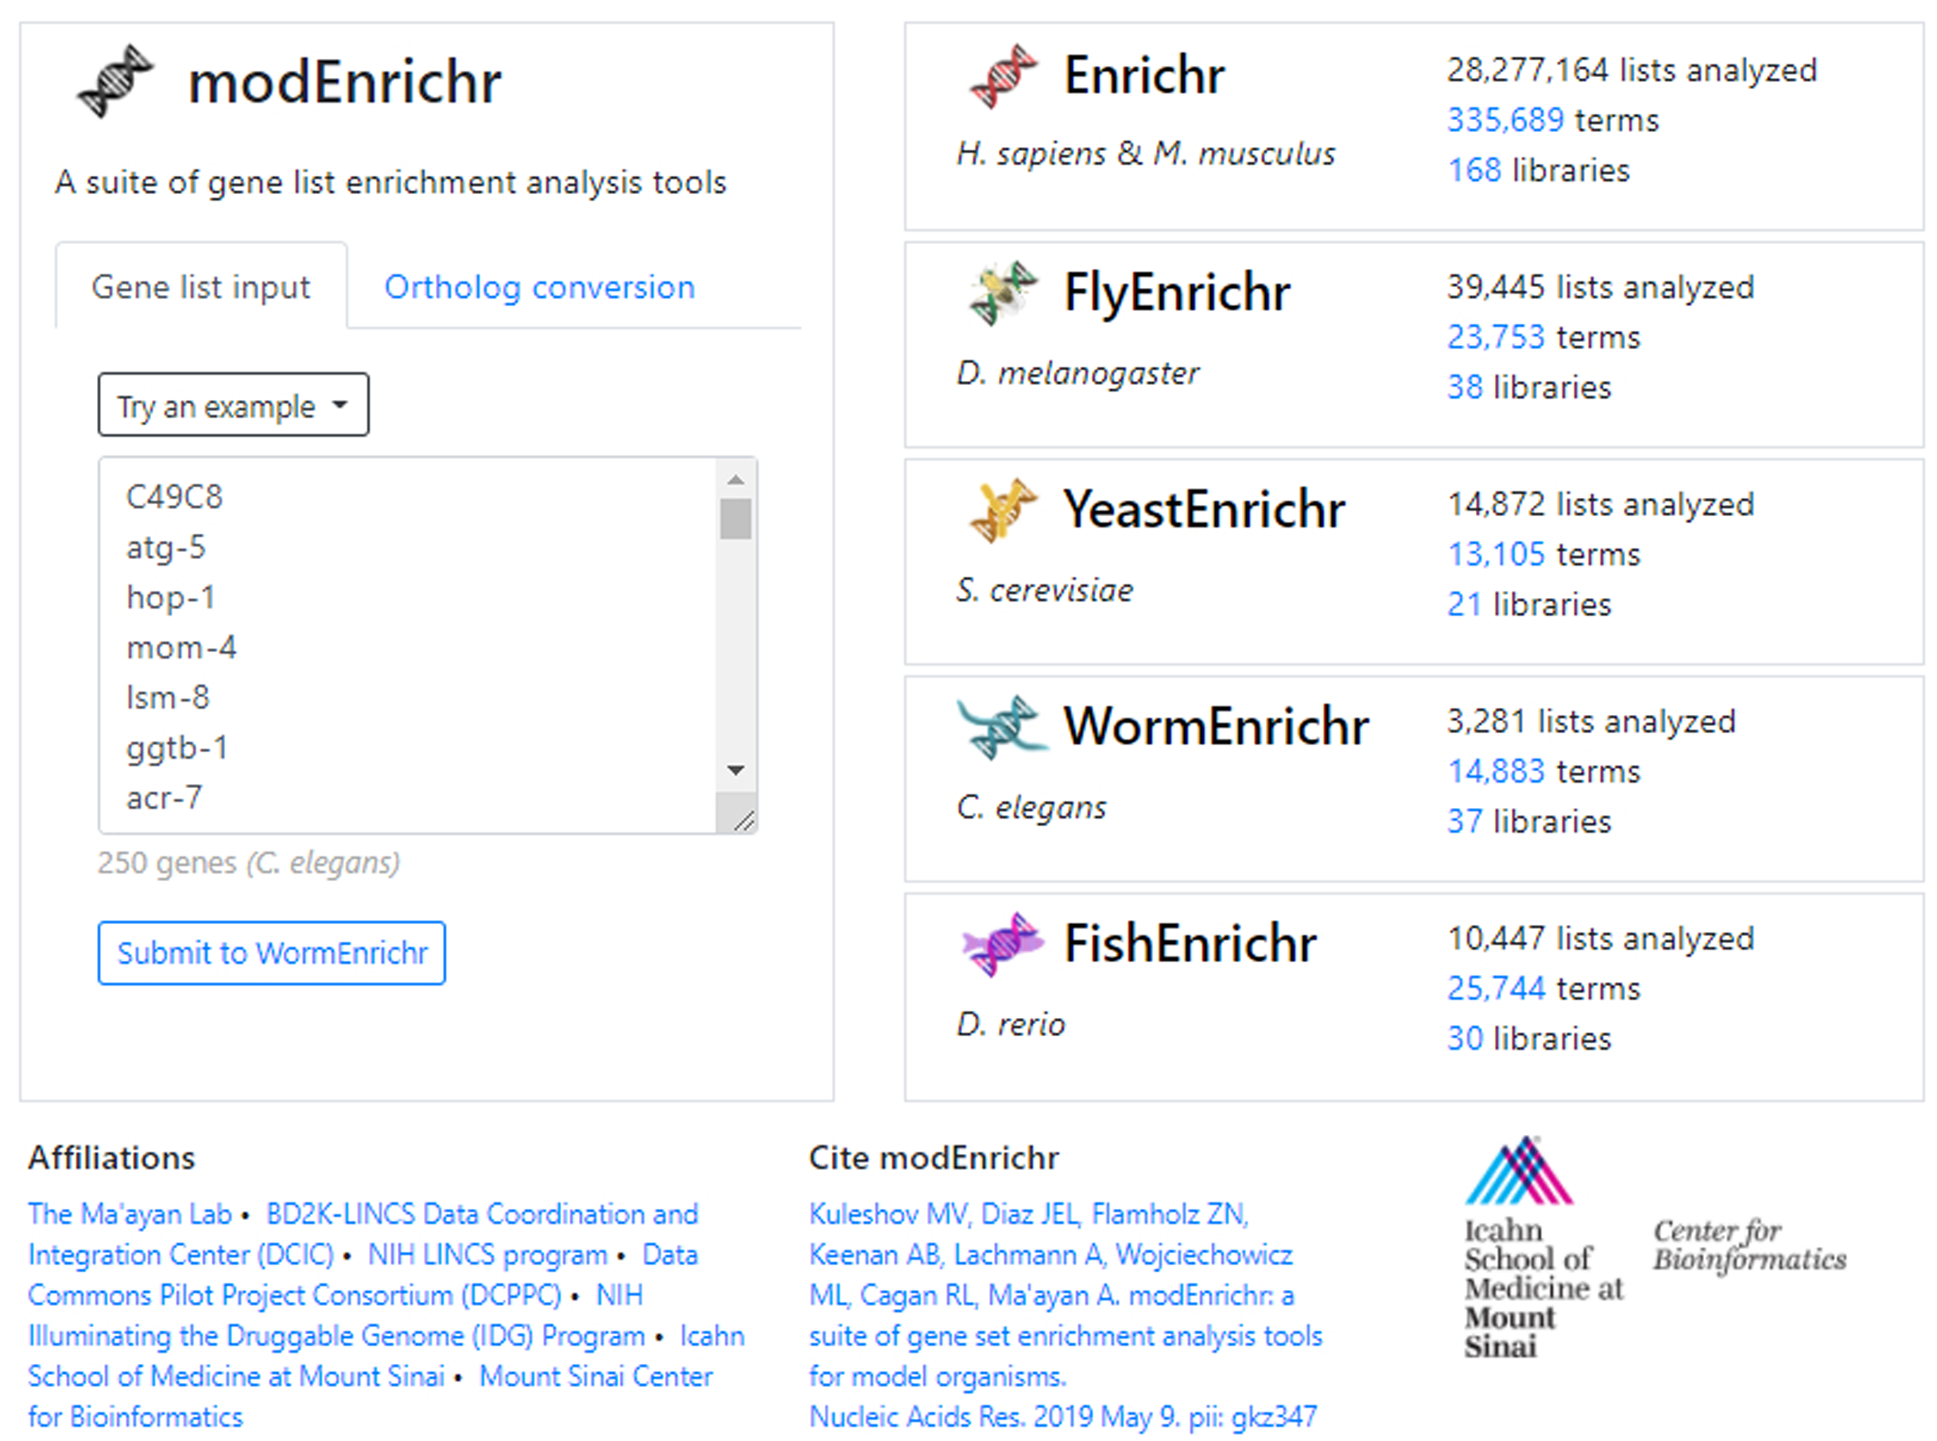
An unknown gene list was inputted into the text field. modEnrichr automatically detects the organism is C. elegans and generates a link to bring the user and their gene list to WormEnrichr.
Converting gene lists between model organisms
-
4
To convert a gene set list from one model organism to another, ensure that the “Ortholog conversion” tab is active. Paste the gene set list into the text box under “Input gene list”. Click the “Convert to:” button to select a target model organism. Upon selection of a target model organism, the right text box labeled “Orthologs” will autofill with the converted genes (Figure 32). A total count of the number of genes successfully converted will be shown. Select the “Submit to…” button to send the gene list to the appropriate enrichment analysis tool.
-
5
To understand the modEnrichr analysis results, please follow the same instructions of Basic Protocol 1 beginning at Step 4.
Fig. 32.
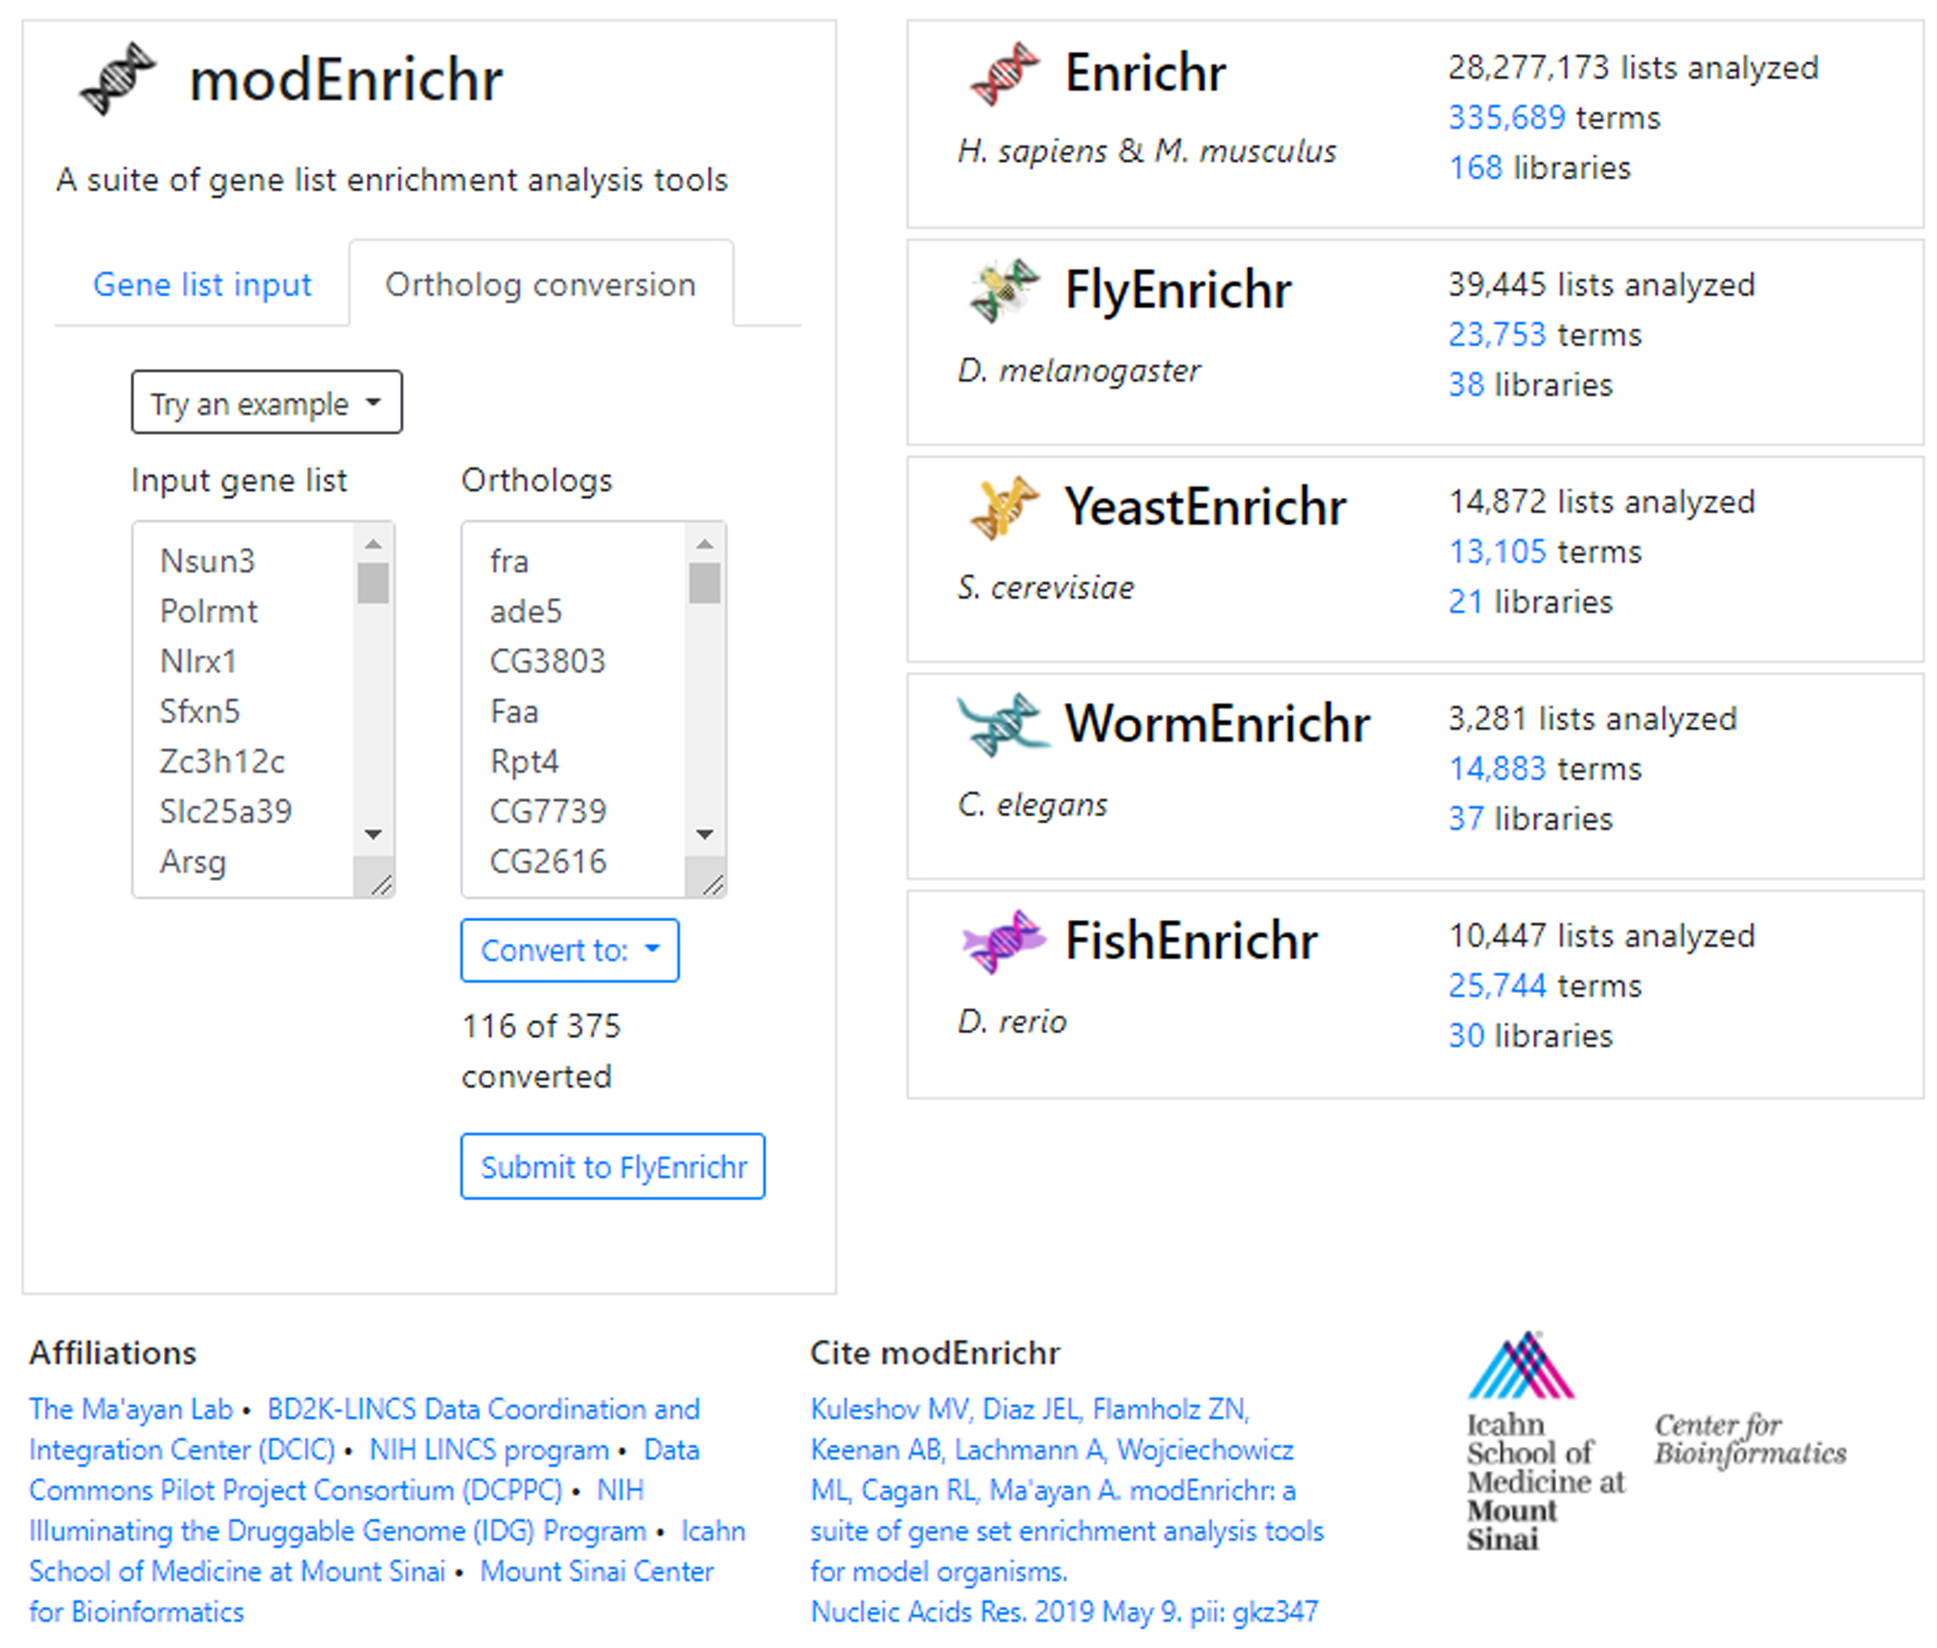
An example H. sapiens/M. musculus gene list has been converted to its D. rerio orthologs. The tool informs the user that 116 of 375 genes were successfully converted. The gene list can be sent to FlyEnrichr by clicking the auto-generated link.
Basic Protocol 5
Using Enrichr in Geneshot
Geneshot (https://amp.pharm.mssm.edu/geneshot/) (Lachmann et al., 2019) is a search engine that identifies genes associated with a search term by exploring co-mentions of genes and terms in existing literature. Geneshot can also predict gene-term associations with several gene-gene co-expression and co-occurrence resources. For a given term, Geneshot returns any gene sets known or predicted to be associated with the term; those gene sets can then be further analyzed with Enrichr.
Necessary Resources:
Hardware – Desktop or a laptop computer, or a mobile device, with a fast Internet connection
Software – An up-to-date web browser such as Google Chrome (https://www.google.com/chrome/), Mozilla Firefox (https://www.mozilla.org/en-US/firefox/), Apple Safari (https://www.apple.com/safari/), or Microsoft Edge (https://www.microsoft.com/en-us/edge).
Protocol steps and annotations:
-
1
Navigate to the Geneshot homepage (https://amp.pharm.mssm.edu/geneshot/) (Figure 33).
Fig. 33.
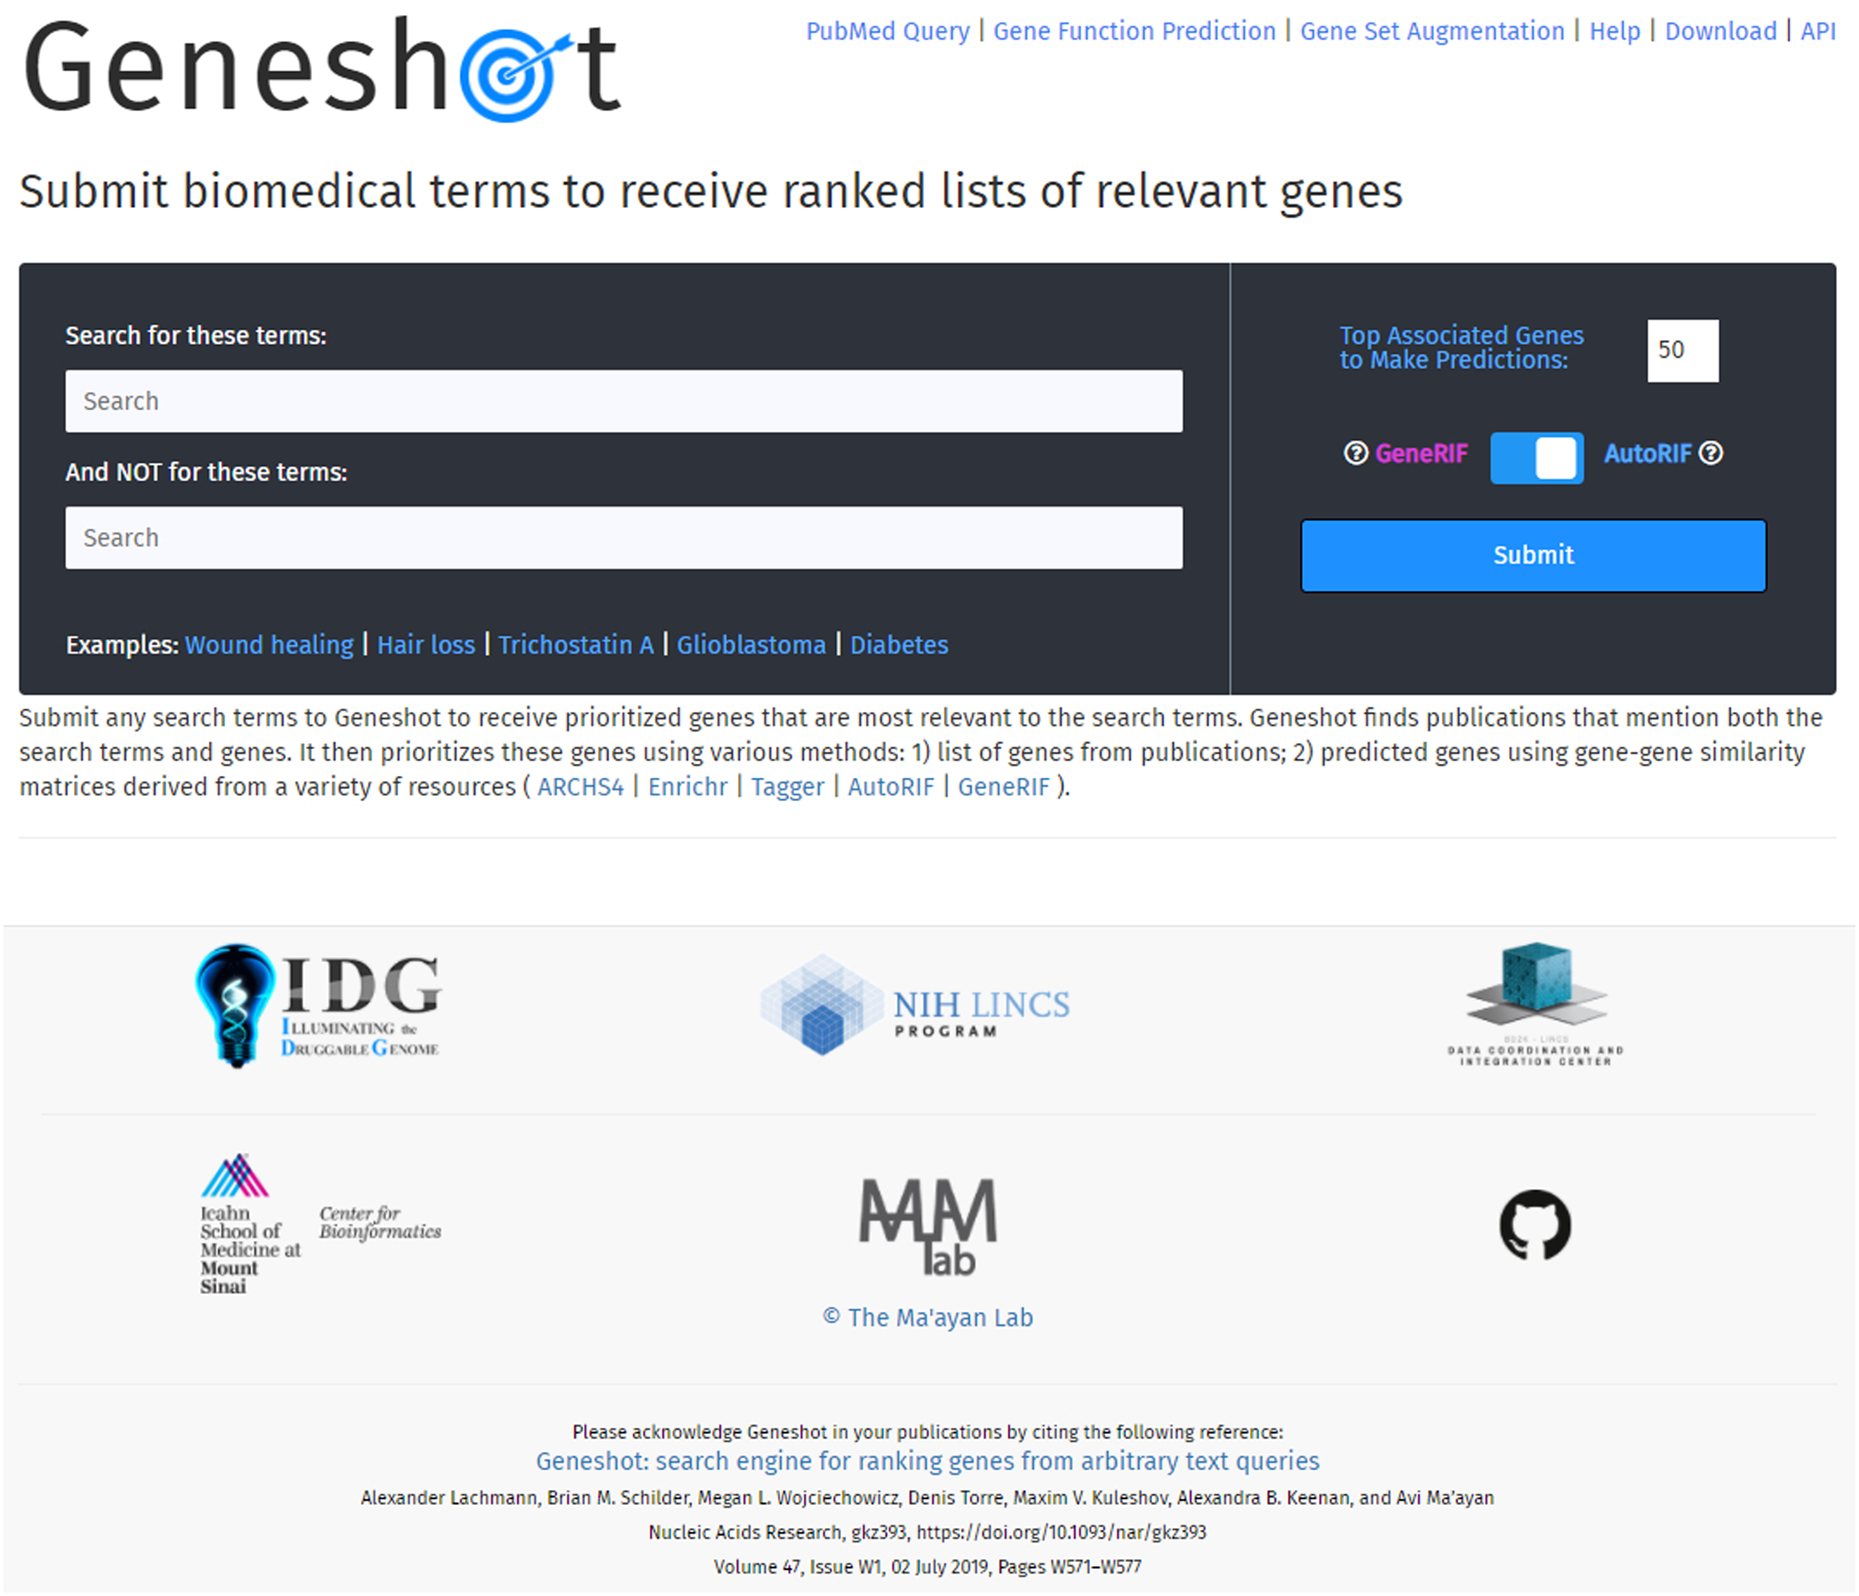
The homepage for Geneshot.
Searching for a biomedical term in Geneshot
-
2
Enter at least one biomedical term of interest in the first text box labeled “Search for these terms” (Figure 34). If any terms should be excluded from the search, enter those terms in the second text box labeled “And NOT for these terms.” Specify the number of top associated genes for use in the prediction analysis, as well as whether you wish to utilize the AutoRIF or GeneRIF resources to associate genes with publications. Click the “Submit” button to access the results.
Please refer to the Geneshot publication for further details about AutoRIF and GeneRIF. Separate terms with a comma; successful terms will be highlighted green. To remove a term from your search, click the small ‘X’ next to it.
Fig. 34.

Enter a search term you wish to explore in the first text box, and an optional term in the second text box you wish not be included into your query. In this demonstration, “coronavirus” will be searched but will not include any publications that also mention “MERS-CoV”. The number of top associated genes and choice of either GeneRIF or AutoRIF lies on the right-hand side.
Interpreting the scatter plot visualization produced by Geneshot
-
3
Scroll down to access the Geneshot results, which will appear below the input form. A link to share the Geneshot results page is located under the search box and before the results.
-
4
Scroll down to the scatter plot below the download link. Each point represents a gene related to the search term. The X-axis measures the number of publications containing the gene that also reference the search term, while the Y-axis shows the normalized fraction of publications, relative to the total number of publications, that reference the gene independent of the search term (Figure 35).
-
5
Click on a data point in the scatterplot to show the gene name, its X and Y values, and two different visualizations, a histogram, and a cumulative distribution plot (Figure 35). A tab above the graphs enables the user to switch between the two visualizations. Both the histogram and cumulative distribution plot display the number of publications associated with the specific gene, with and without the search term, over time.
Fig. 35.
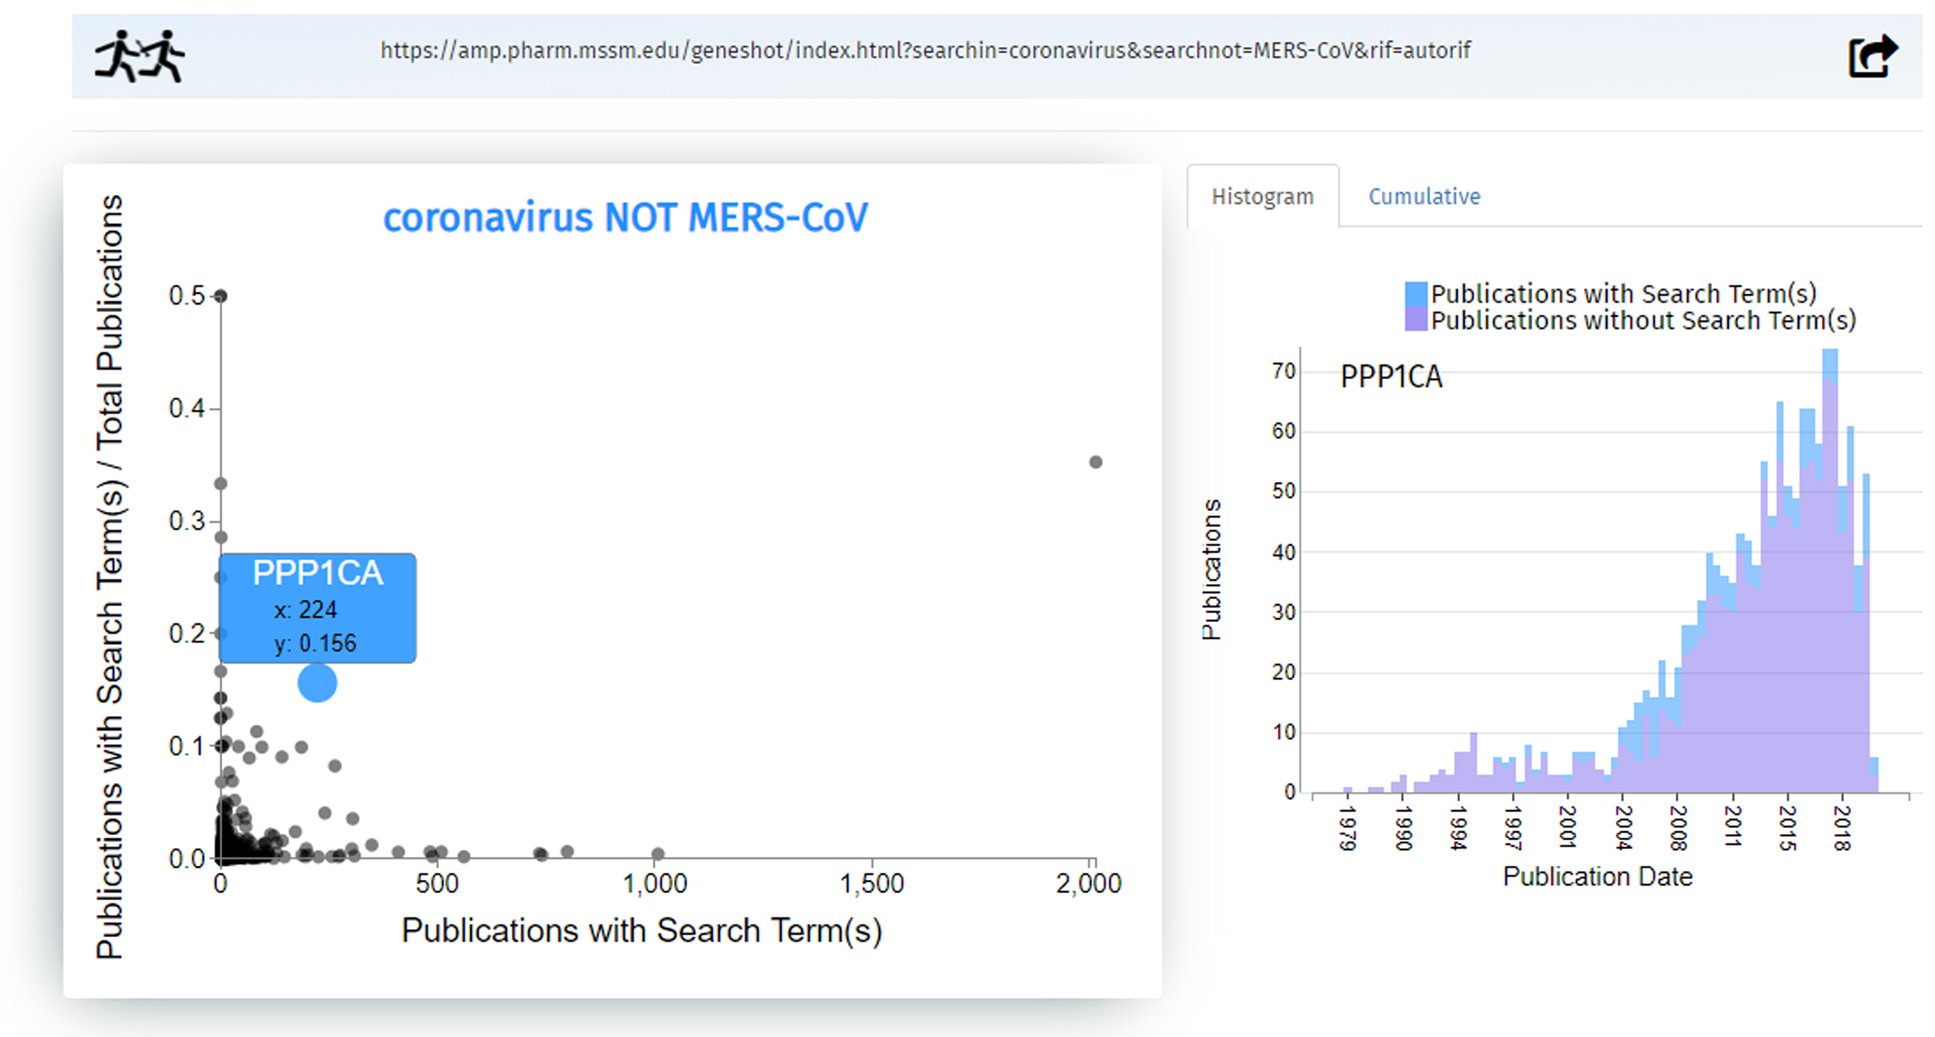
A link to the Geneshot results page is printed at the top. Continuing our search of “coronavirus NOT MERS- CoV”, a scatterplot generates genes related to the search term via publications. Clicking an individual data point brings up the gene name and additional information. “PPP1CA” is mentioned in 224 publications with the term coronavirus but not MERS-CoV, and has a normalized fraction of 0.156; that means out of all publications that mention the gene PPP1CA, 15.6% also mention coronavirus (but not MERS-CoV). The option to display either the histogram or cumulative distribution plot are on the right-hand side.
Interpreting the gene association results tables
-
6
Two tables appear below the scatter plot. These tables display gene associations either directly, based on the literature search, or predicted based on gene-gene co-expression or co-occurrence similarity (Figure 36). The option to modify the parameters and recalculate the predictions is located immediately above the tables. Use the slider to edit the number of top associated genes used for making predictions. You may also choose from the drop-down menu which dataset matrix of gene-gene co-expression or co-occurrence you would like to use to calculate the predictions.
Gene-gene similarity matrices include AutoRIF co-occurrence, GeneRIF co-occurrence, Enrichr co-occurrence, Tagger co-occurrence, and ARCHS4 co-expression.
-
7
The left table shows the same information as the scatter plot: it lists genes associated with the search term in publications, the number of publications which include the search term, and the fraction of all publications which include both the gene and the search term (Figure 36). You may use the search bar above the table to look for a particular gene. You may also filter the results to a specific gene family by clicking one of the six buttons above the chart: Kinases, Dark kinases, GPCRs, Dark GPCRs, Ion Channels, and Dark Ion Channels. Clicking on a gene name allows you to access Geneshot’s gene function prediction page; clicking on the number of publications leads to a list on PubMed of all included publications.
Dark genes are determined by their inclusion on lists produced by the NIH Illuminating the Druggable Genome Commons Fund project (https://druggablegenome.net/).
-
8
The table on the right ranks genes by similarity with the literature identified genes, using the co-occurrence or co-expression matrices specified from the drop-down menu from Step 6. The predicted genes in this table are determined based on the genes from the “Genes associated by literature” table (Figure 36). Clicking on a gene name leads to Geneshot’s gene function prediction page. Hovering over the gene score displays a pop-up informing the user about the top 10 genes that contributed to the gene’s score. Clicking on one of the six buttons above the charts filters the list by gene family.
-
9
Download the gene list from either table using the respective buttons below each table (Figure 36). Import the gene lists into Enrichr by clicking the Enrichr buttons. To understand the Enrichr analysis results, please follow the instructions of Basic Protocol 1 beginning at Step 4.
Fig. 36.
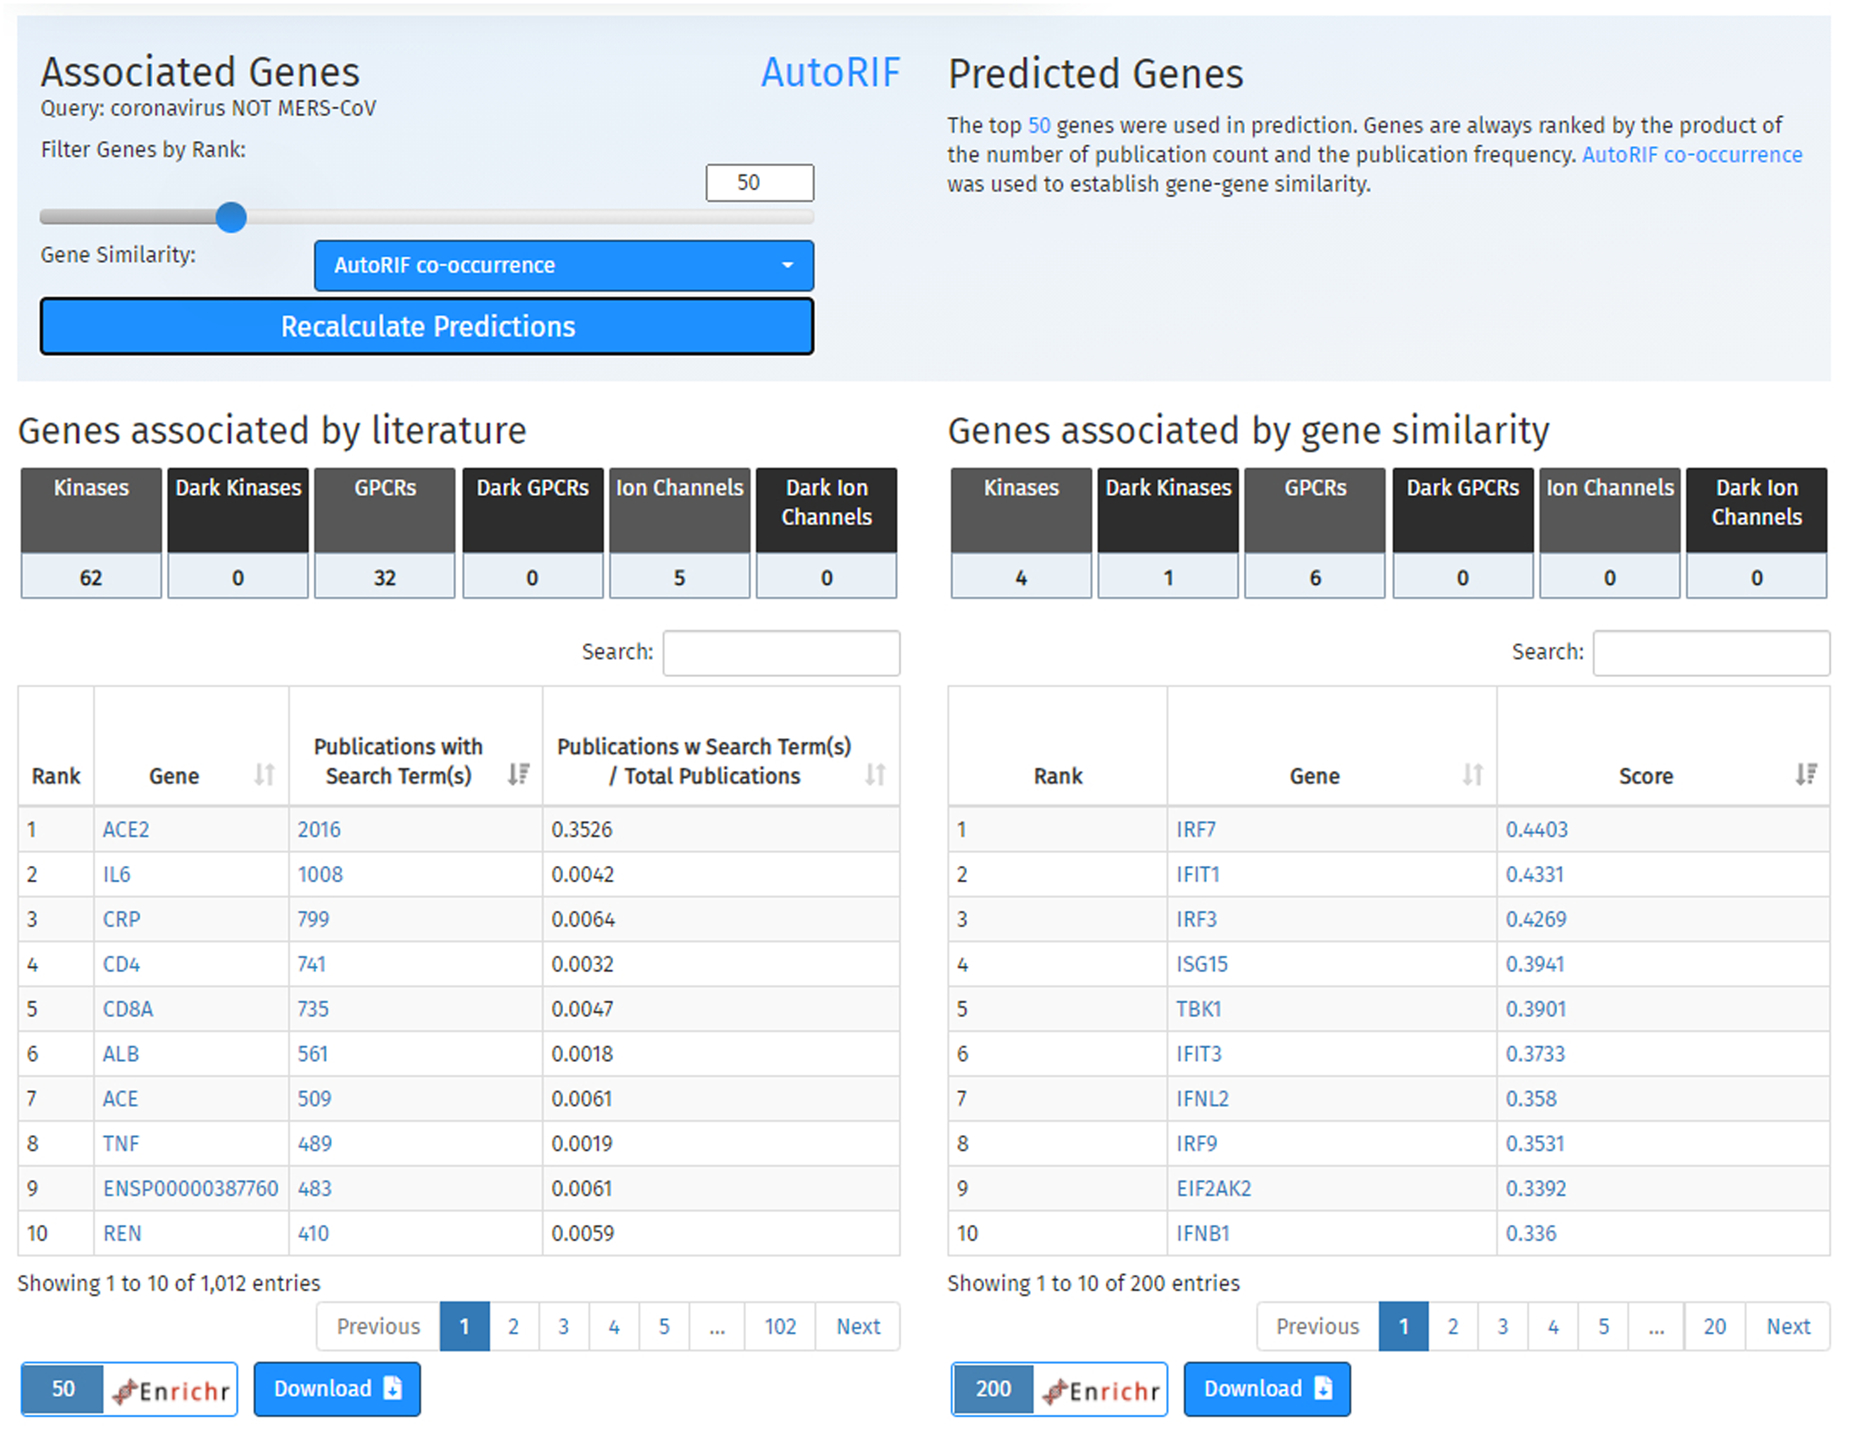
The option to modify the associate genes and predicted genes tables is located immediately below the scatterplot in a light-blue box. Following are six buttons used to filter the table results by gene family categories. The plot on the left displays a ranked list of genes associated by publications, and the table on the right displays a ranked list of genes associated by gene similarity using a specified co-occurrence matrix. Buttons to import the results into Enrichr or download the gene list are located below the tables.
Basic Protocol 6
Using Enrichr in ARCHS4
ARCHS4 (https://maayanlab.cloud/archs4/) (Lachmann et al., 2018) is a repository for serving processed RNA-seq data from human and mouse samples. To create ARCHS4, we aligned data from the NIH Gene Expression Omnibus (GEO), converting the raw FASTQ files into the form of gene-level counts. The massive database includes robust search features such as browsing metadata, visualizing gene and sample spaces in 3-D, and discovering gene sets for importing into Enrichr for enrichment analysis.
Necessary Resources:
Hardware – Desktop or a laptop computer, or a mobile device, with a fast Internet connection
Software – An up-to-date web browser such as Google Chrome (https://www.google.com/chrome/), Mozilla Firefox (https://www.mozilla.org/en-US/firefox/), Apple Safari (https://www.apple.com/safari/), or Microsoft Edge (https://www.microsoft.com/en-us/edge).
Protocol steps and annotations:
-
1
Navigate to the ARCHS4 homepage (https://maayanlab.cloud/archs4) (Figure 37). Click the blue “Get Started” button to proceed to the data search page (Figure 38).
Fig. 37.
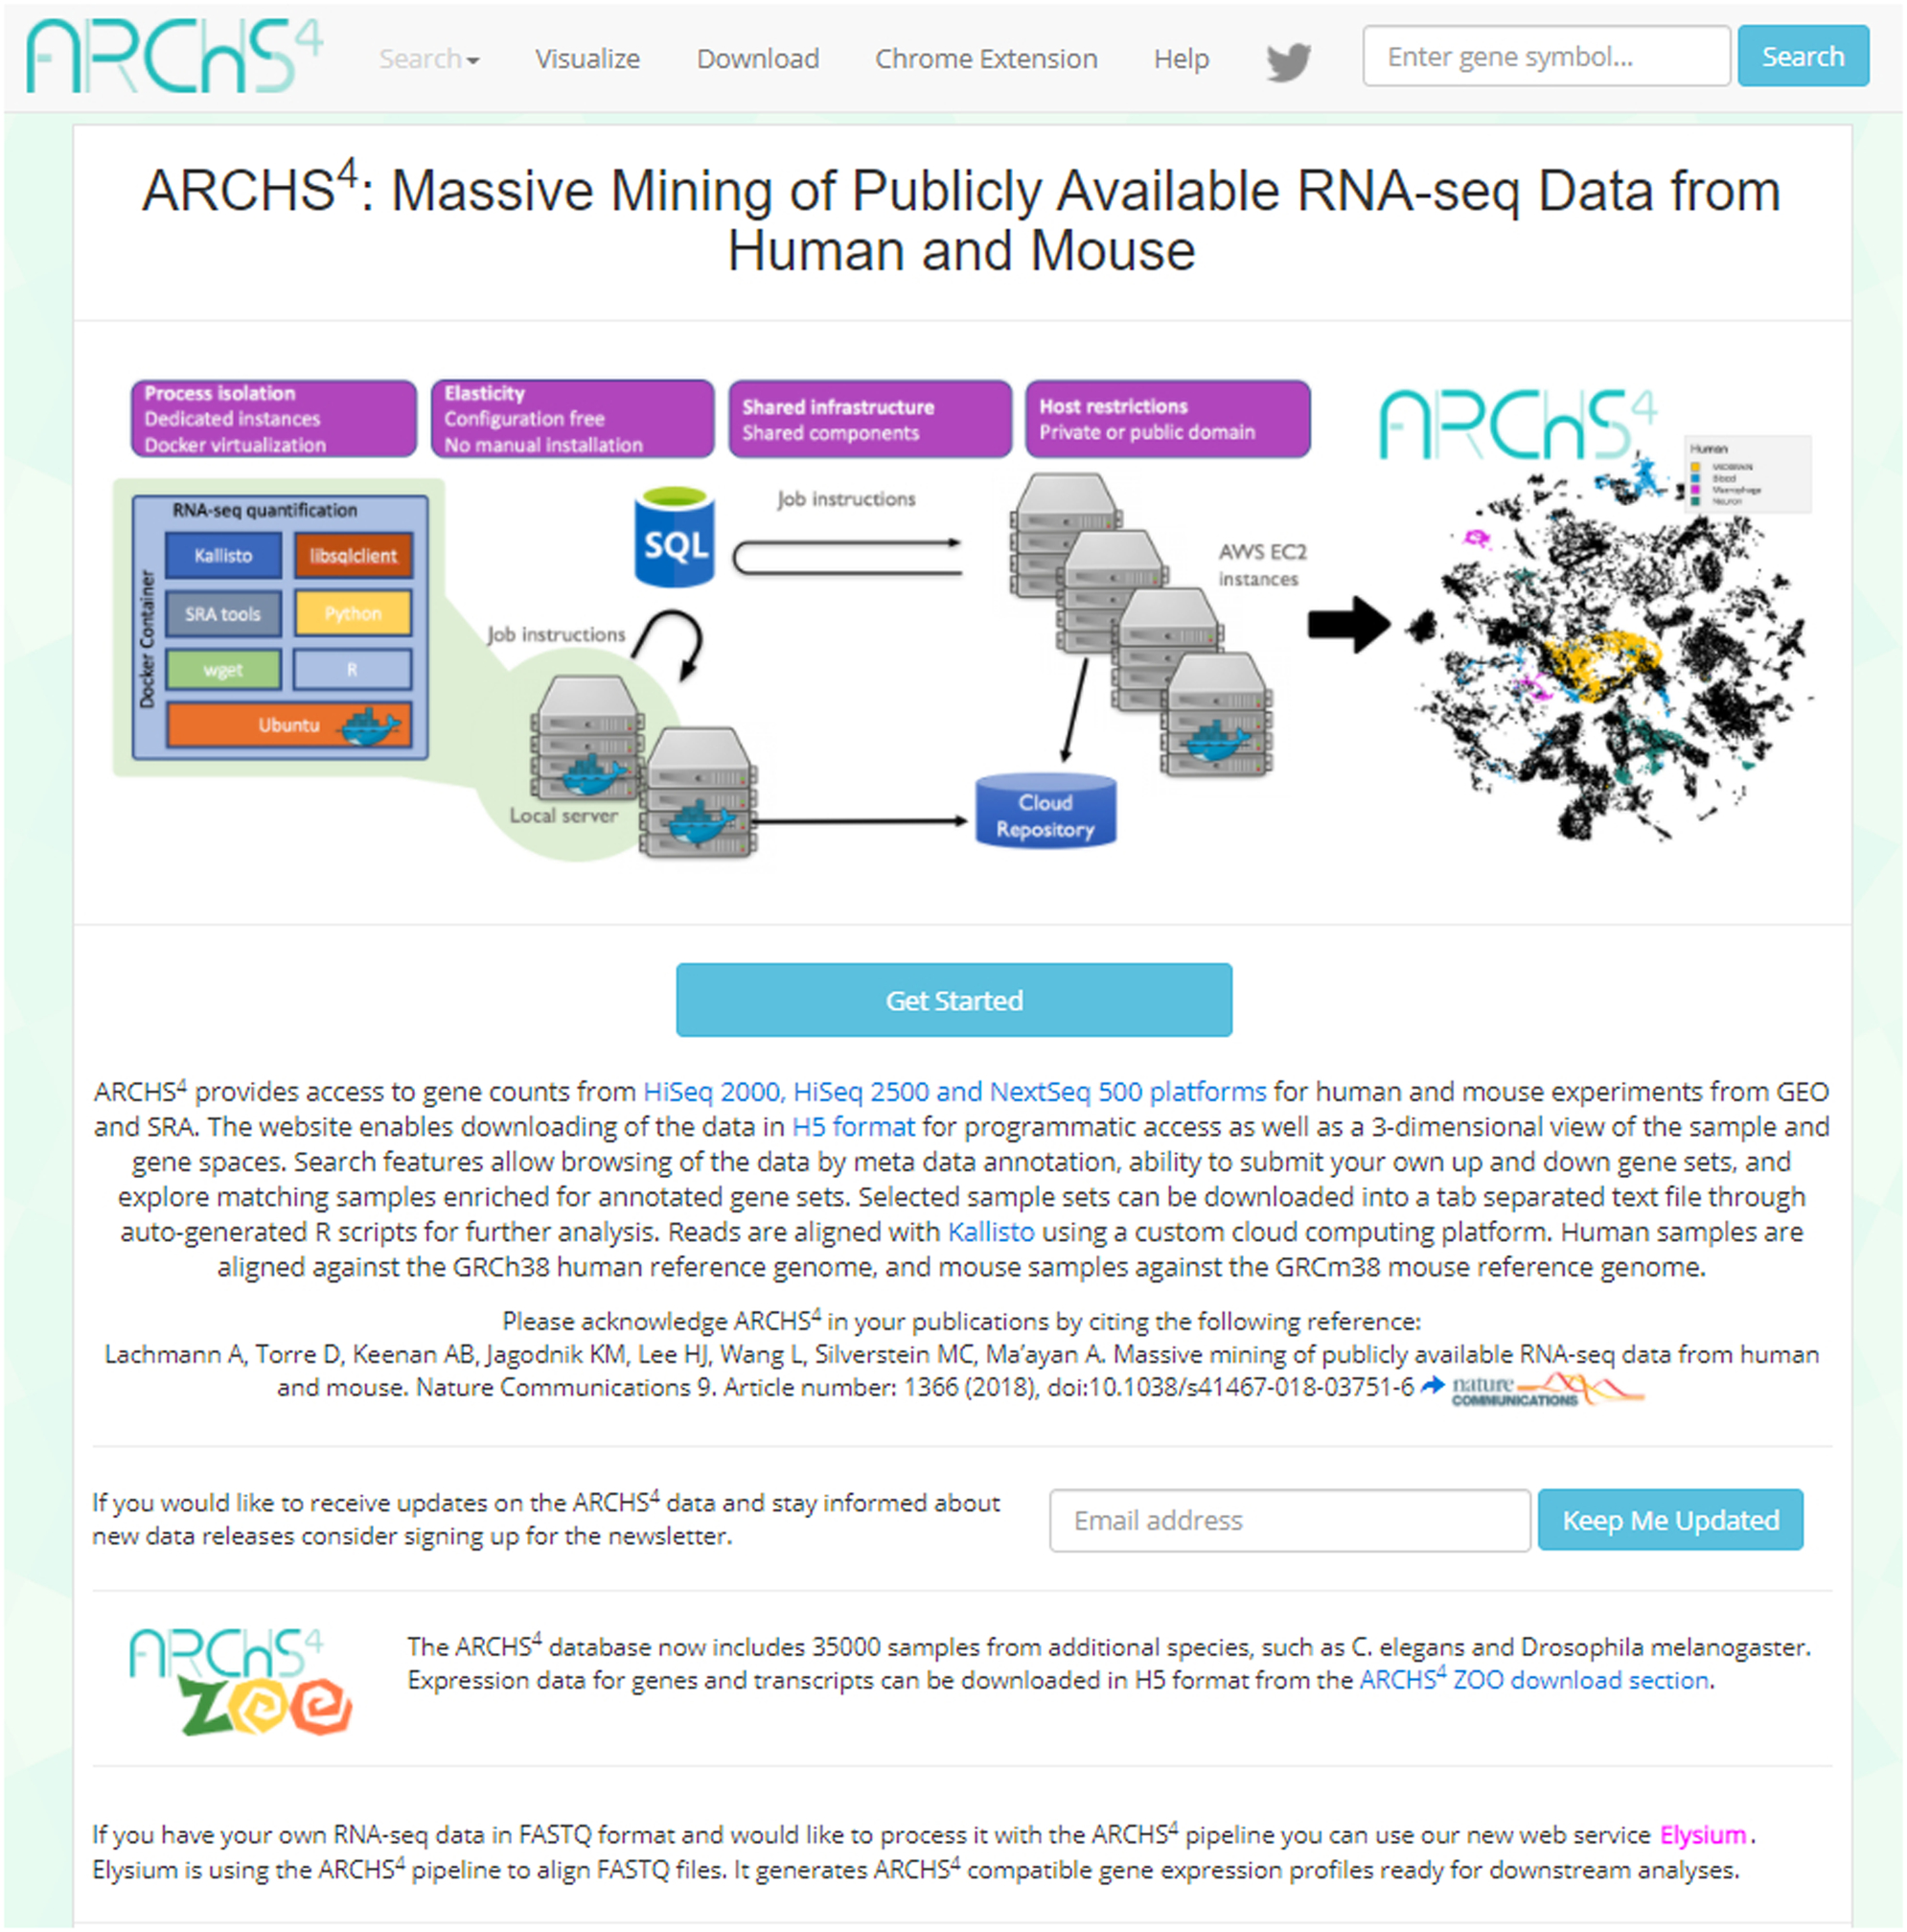
The homepage of ARCHS4.
Fig. 38.
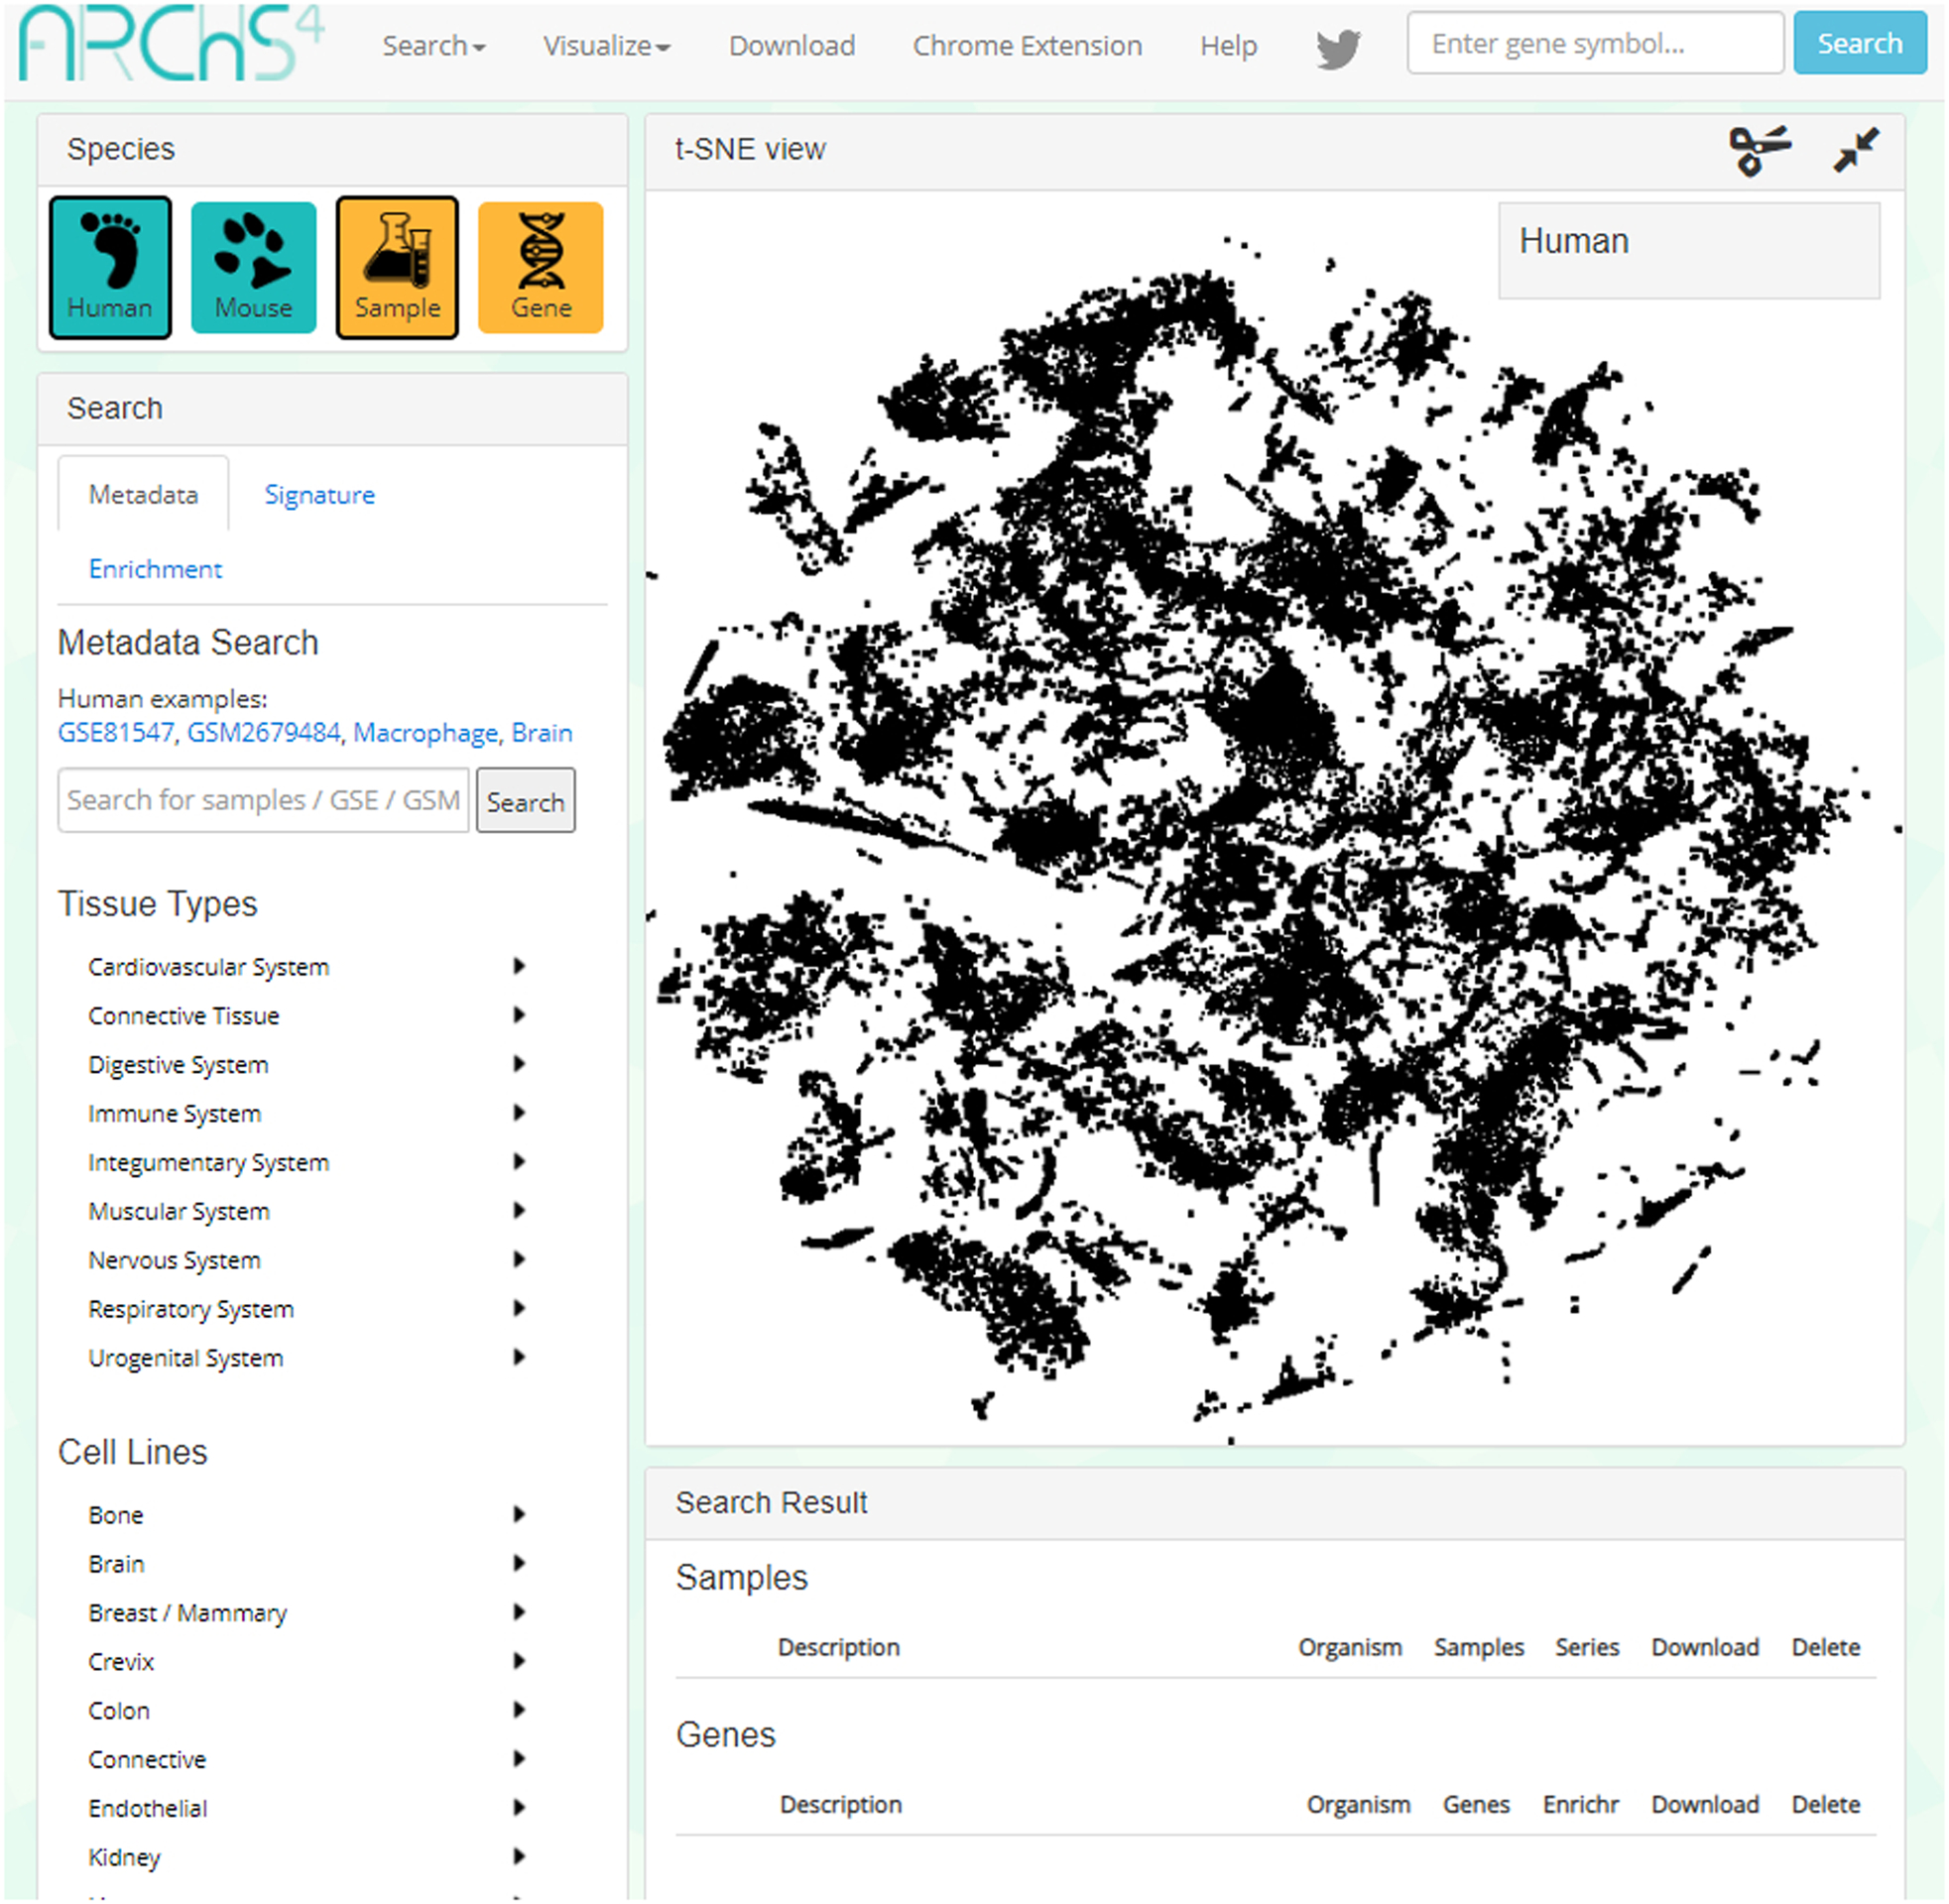
The data search page of ARCHS4. For this example, the species selected is human and we are searching for metadata by selecting “Sample”.
Searching for a specific gene
-
2
To search for a particular gene, locate the “Species” box on the left side of the page, and select the yellow “Gene” button in the upper-right corner (Figure 39). Specify your species of interest, either human or mouse, by choosing one of the teal species buttons.
-
3
Type your gene symbol into the first text box in the left sidebar under the header “Search gene by gene header” (Figure 40). An auto-complete functionality can aid you in finding your gene of interest. Click “Search”.
-
4
A new window will appear with information and tables pertinent to the input gene, including gene description, predicted biological processes, predicted upstream transcription factors, predicted mouse phenotypes, predicted human phenotypes, predicted kinase interactions, predicted pathways, similar genes based on co- expression, tissue expression, and cell line expression (Figure 41).
-
5
Scroll to the section labeled “Most similar genes based on co-expression.” To upload the generated list of similar genes to Enrichr, click the “Upload to Enrichr” button to the right of the section heading (Figure 41). To understand the Enrichr analysis results, please follow the instructions of Basic Protocol 1 beginning at Step 4.
Fig. 39.
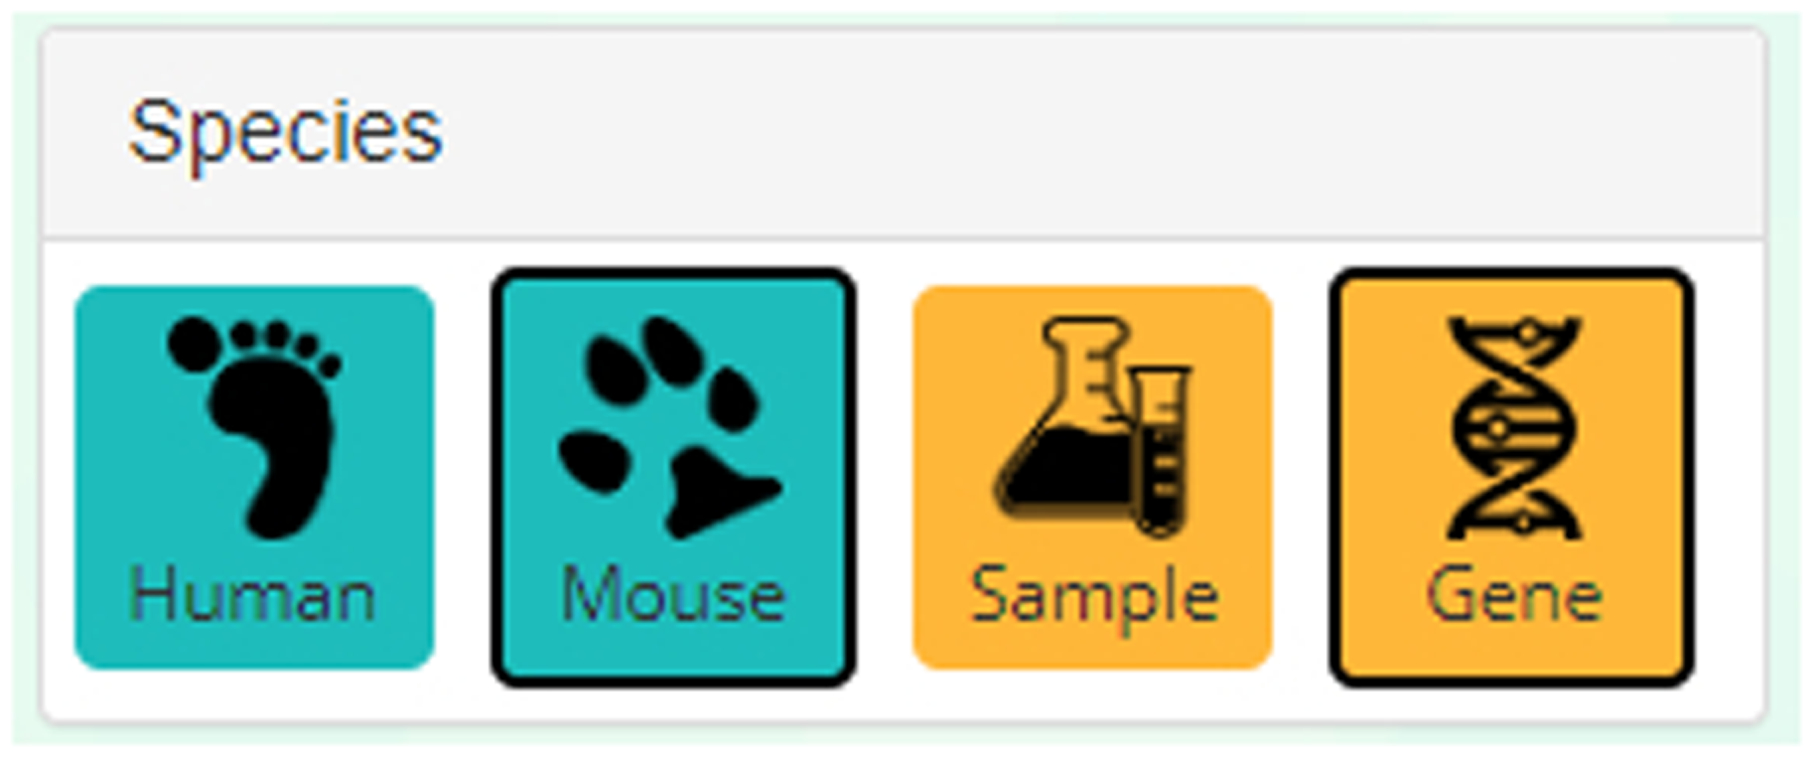
The “Gene” button in the top-right corner of the page must be selected. Choose between either human or mouse depending on your species of interest.
Fig. 40.
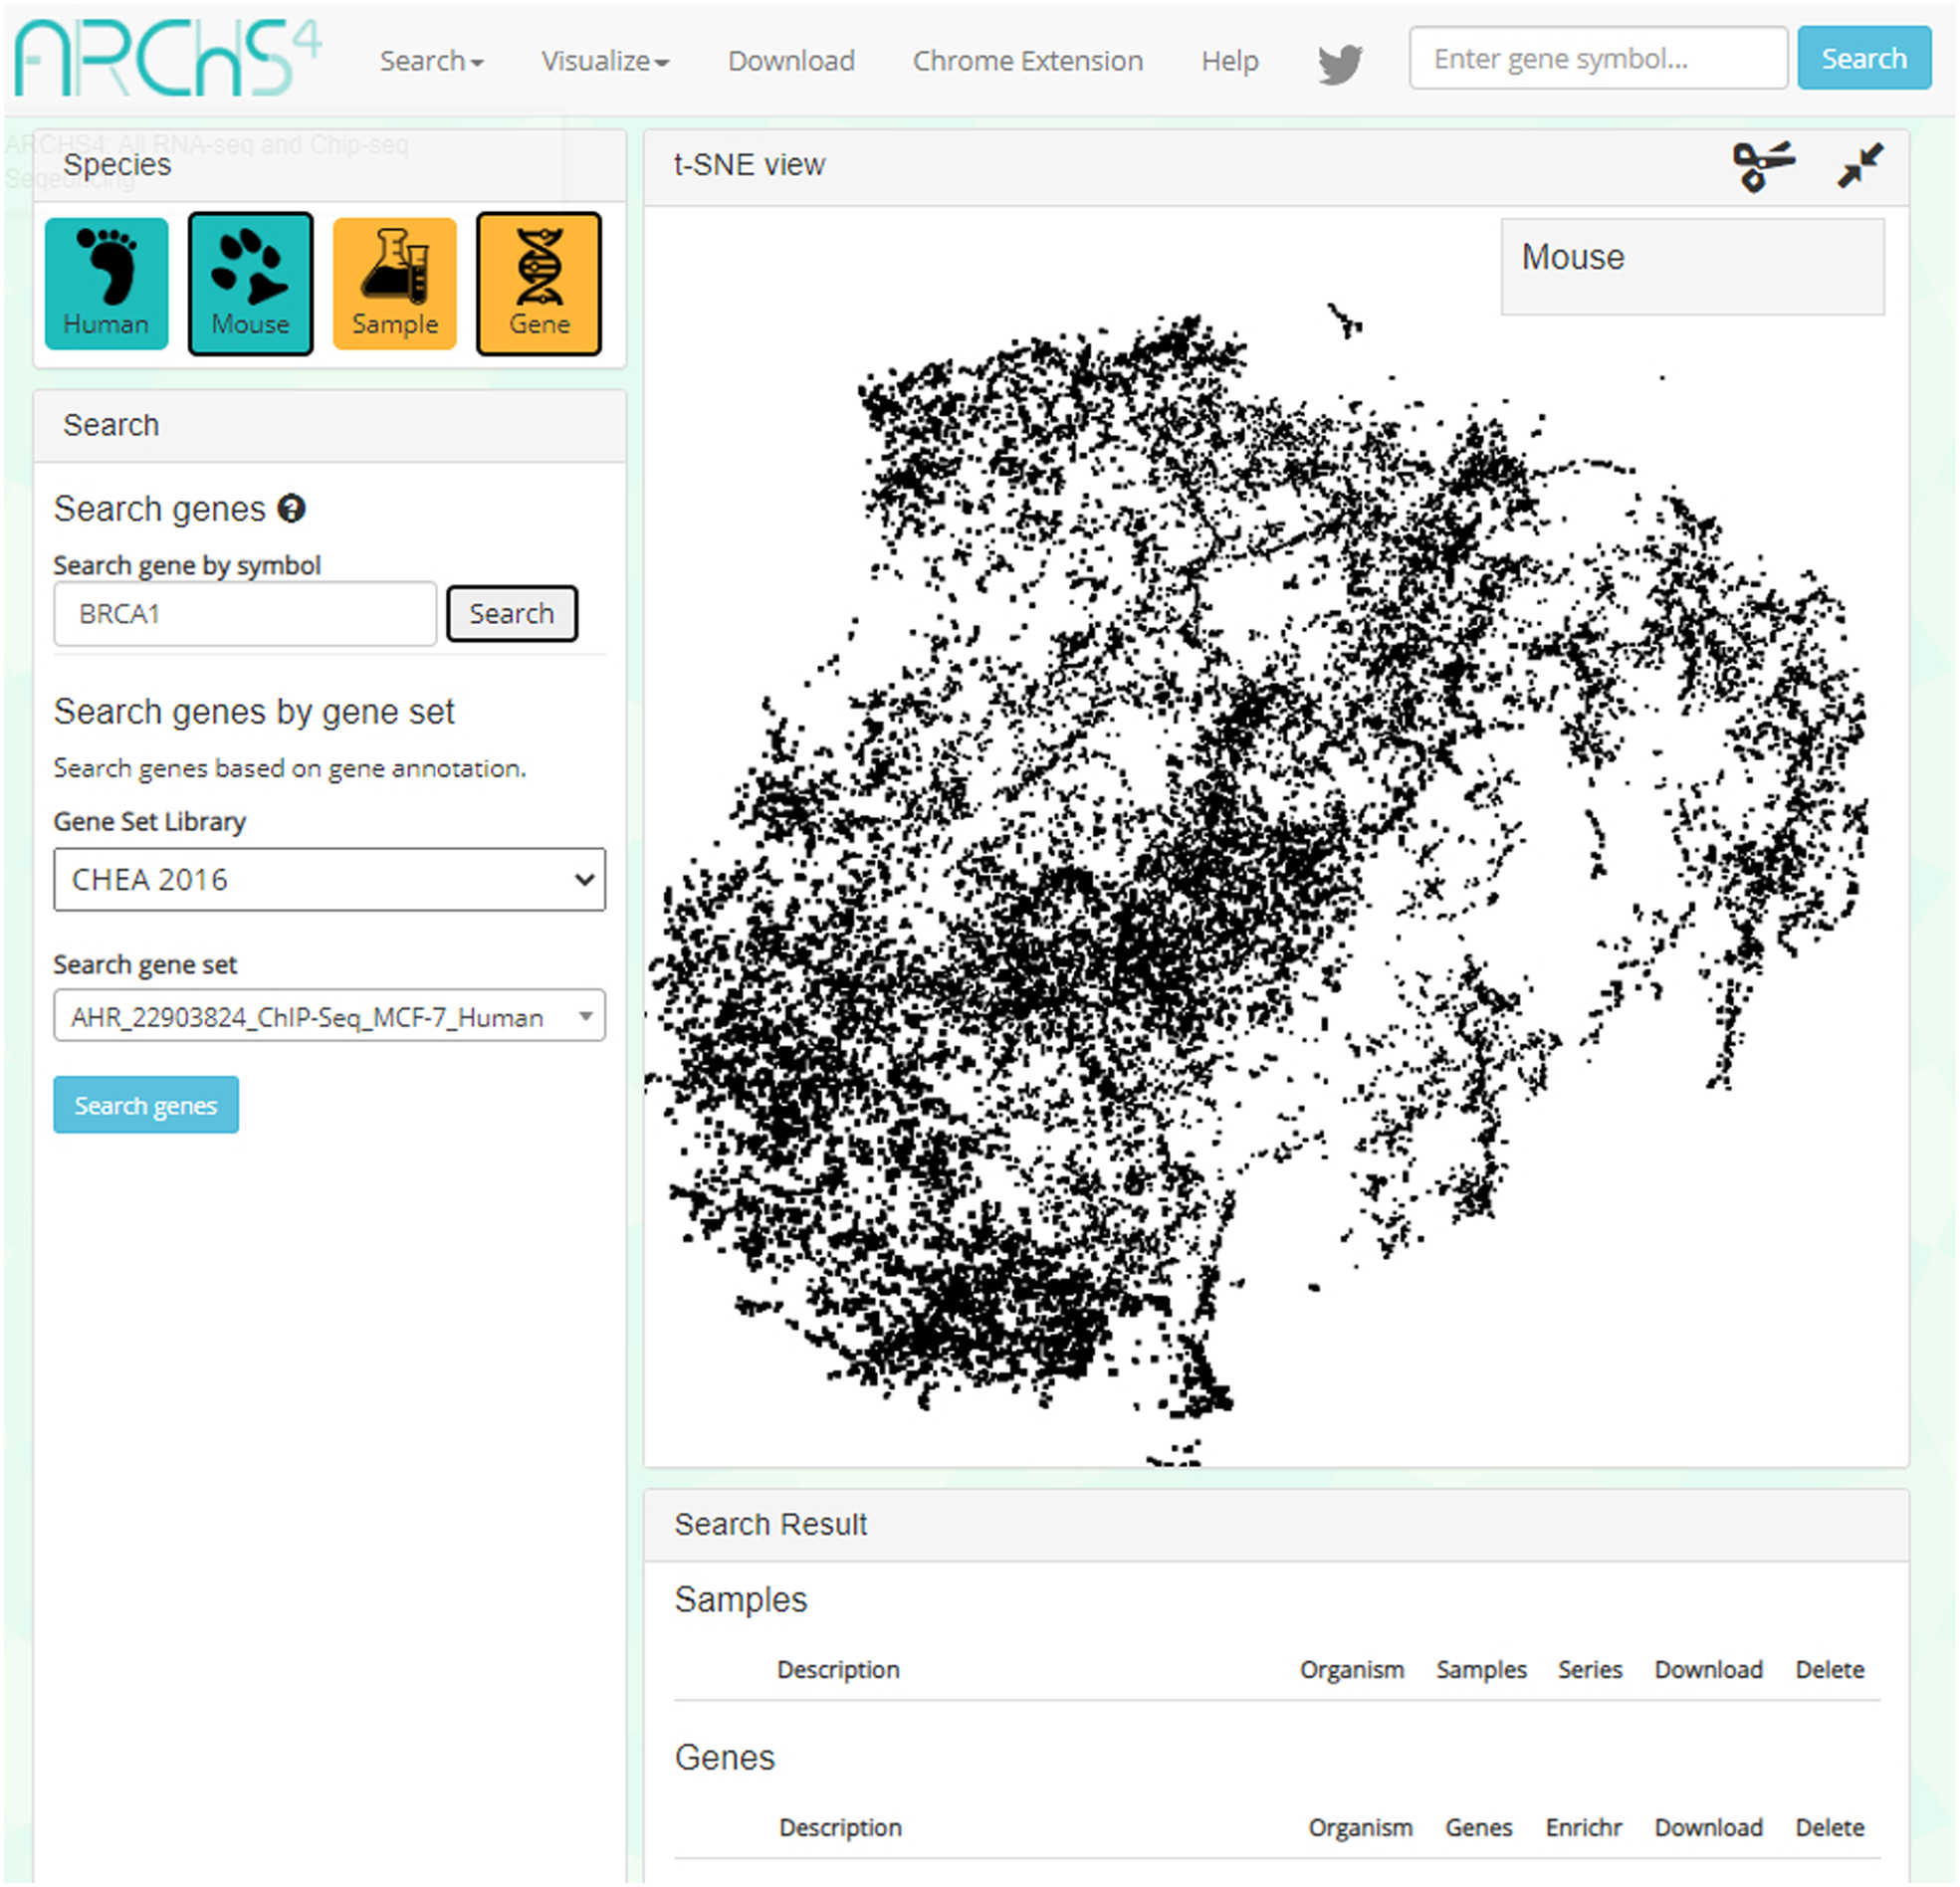
This example demonstrates how to search for the “BRCA1” gene. Insert the gene ID into the top-right textbox under the “Search gene by symbol” header.
Fig. 41.

Detailed description page – in this example, for “BRCA1”. A list of genes most similar to the gene of interest based on co-expression is located lower on the page. Click the Enrichr icon on the right to send the gene list to Enrichr.
Searching for a gene set
-
6
To search for a gene set, select the yellow “Gene” button in the “Species” box on the upper-left corner of the homepage. In addition, specify your species of interest, either human or mouse, by using the teal buttons (see Figure 39).
-
7
In the left sidebar, select a gene set library from the drop-down menu under the header “Search genes by gene set” (Figure 42). Choose a gene set from the “Search gene set” menu or search for a gene set using the search bar above the drop-down. Once a gene set is selected, click the “Search genes” button to proceed.
Gene set libraries to select from include CHEA 2016, GO Biological Process, KEA 2016, KEGG Pathways 2016, and MGI Mammalian Phenotype Level 4.
-
8
The gene set will be illustrated in the t-SNE plot (Figure 43). Information on the gene set, including description and identification color, can be found in a table located below the plot, in the “Genes” subsection. View the list of genes in the set by clicking on the total number of genes listed under the “Genes” column. In addition, you can download the gene set by clicking on the download icon under the “Download” column.
-
9
To upload the results to Enrichr for enrichment analysis, click the Enrichr logo under the “Enrichr” column in the “Genes” subsection table (Figure 43). To understand the Enrichr analysis results, please follow the instructions of Basic Protocol 1 beginning at Step 4.
Fig. 42.
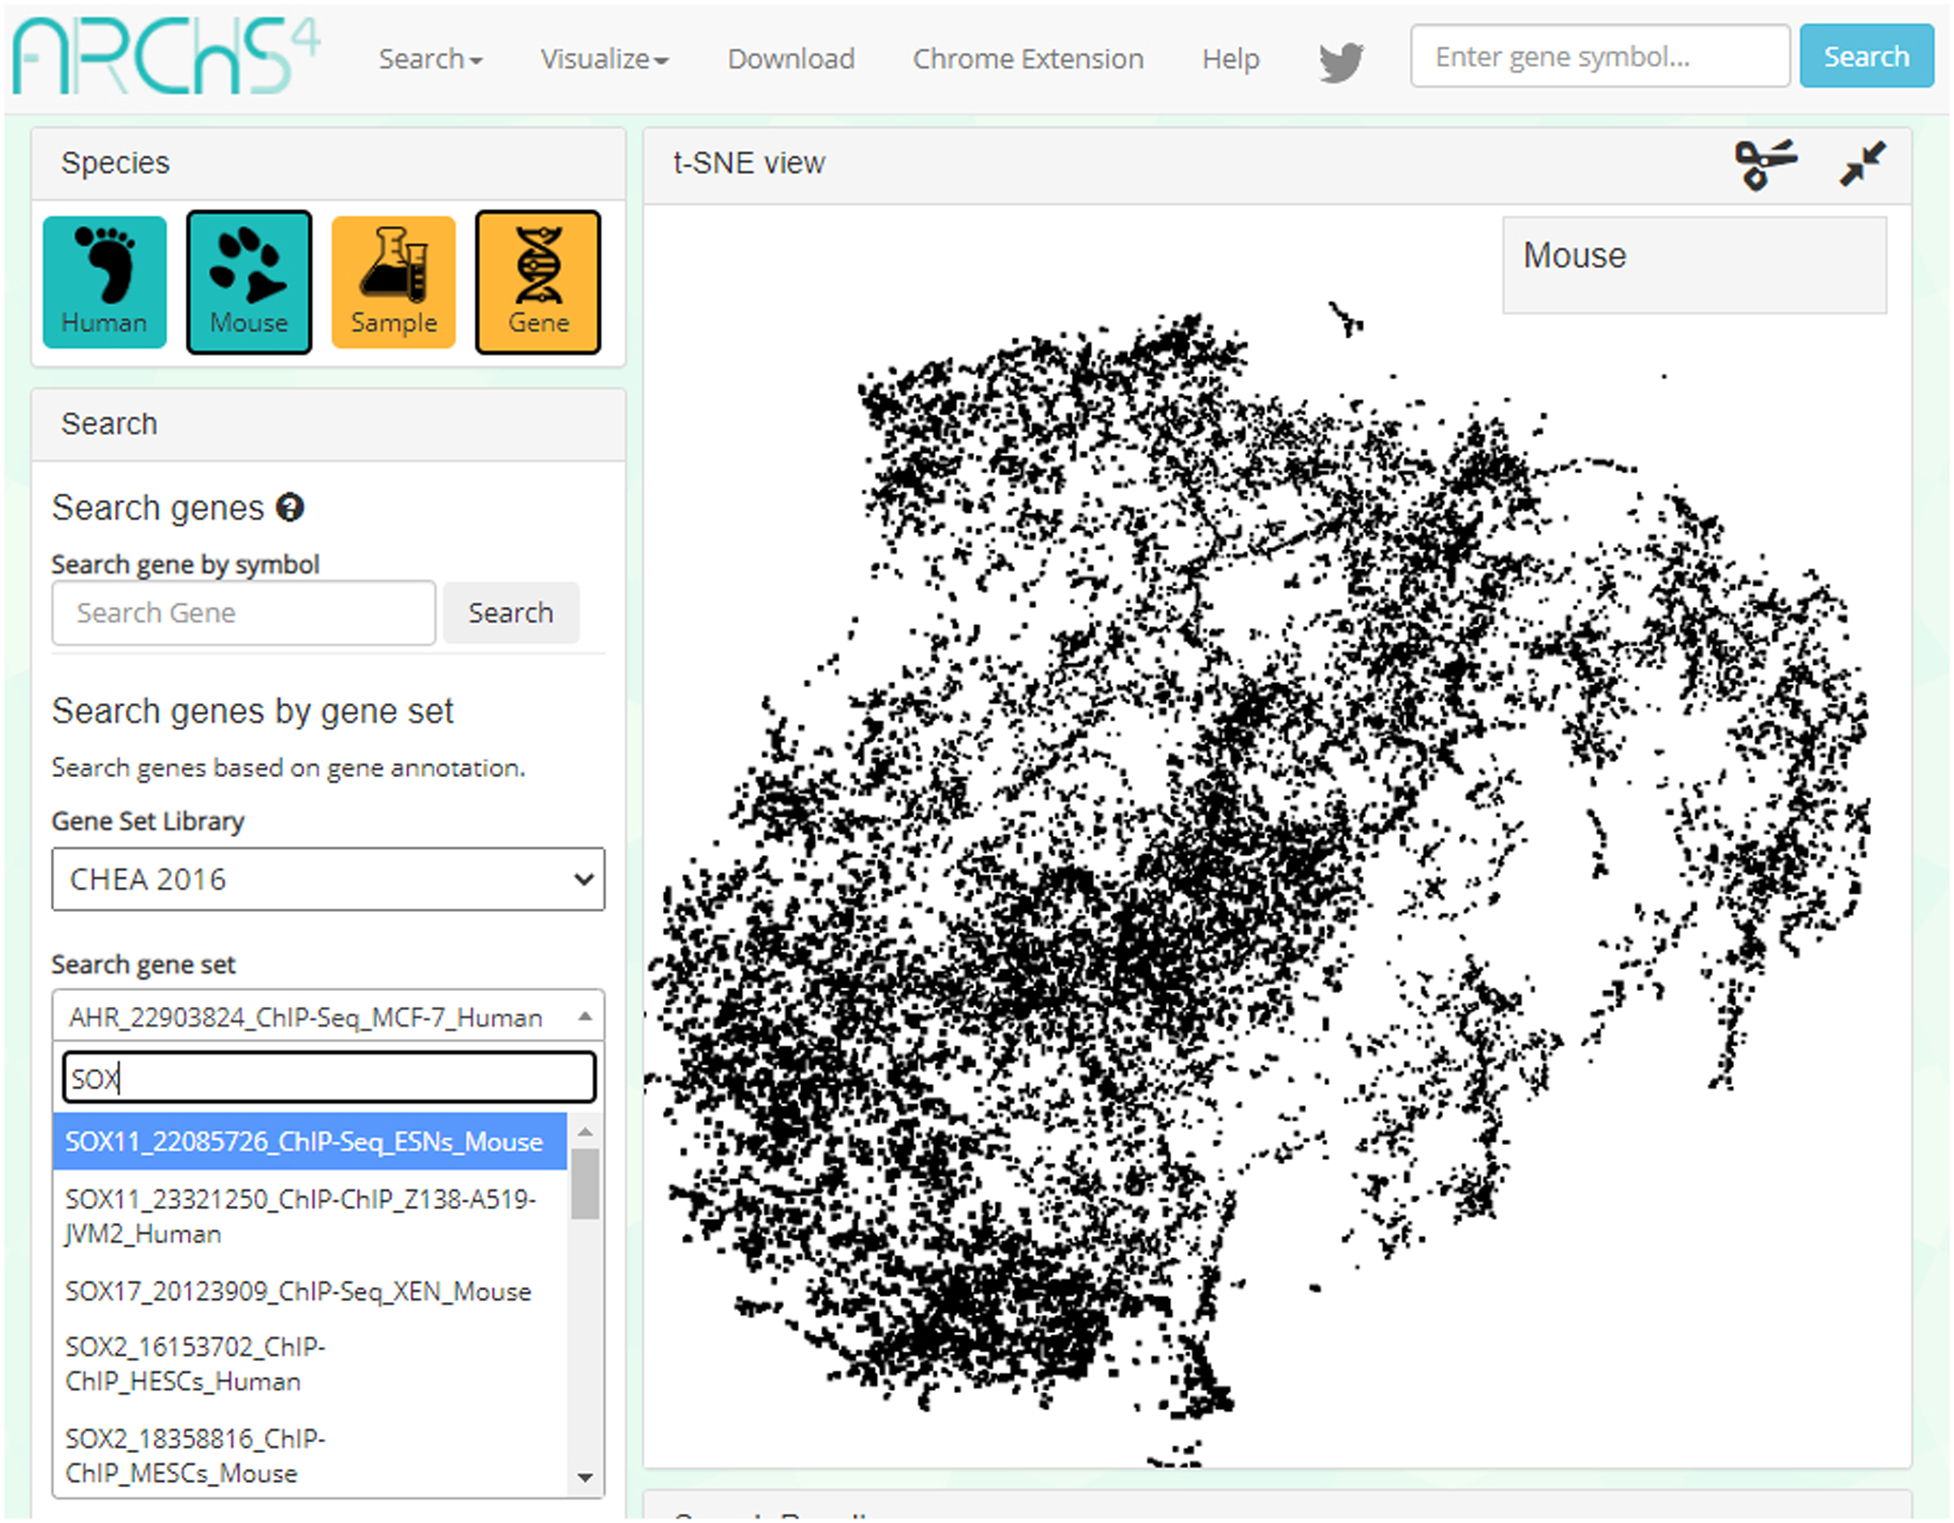
Users first need to select a gene set library from five different options. To find a gene set, the user may search using the search bar, or browse through the listed options.
Fig. 43.
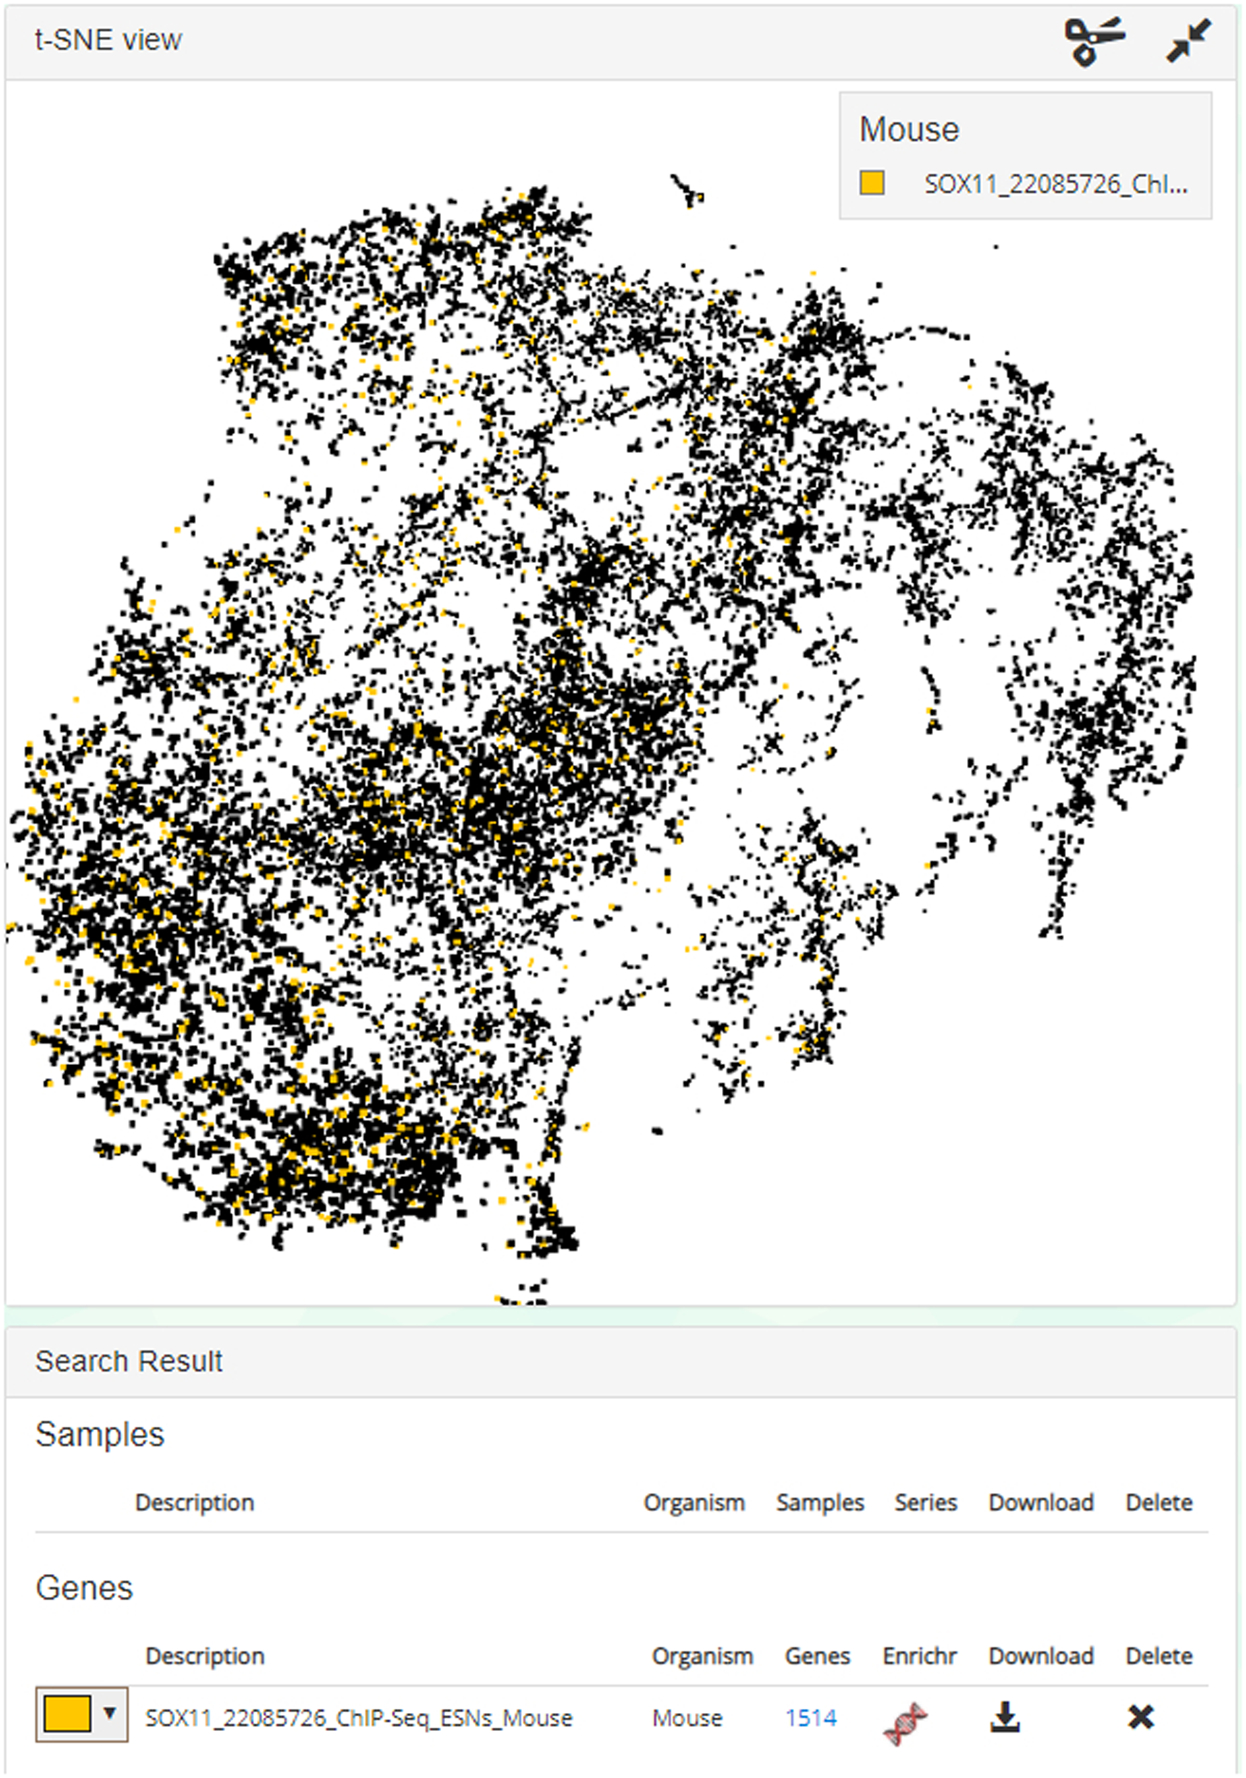
In this demonstration, the gene set is illuminated in yellow in the t-SNE plot. The color can be changed using the left-most drop-down menu. 1514 genes exist in the set and can be viewed if clicked. Click the Enrichr icon to import the gene set list to Enrichr, or you may choose to download the gene set using the download icon.
Basic Protocol 7
Using the Enrichment Analysis Visualization Appyter to visualize Enrichr results
The Enrichment Analysis Visualization Appyter is a Jupyter Notebook-based web application which enables users to automatically create visualizations of their enrichment results in the form of a scatter plot, a bar chart, a hexagonal canvas plot, and a Manhattan plot. These figures are produced within a Jupyter Notebook report with source code included, which can then be downloaded, shared, modified, and executed on other platforms. The Appyter can be accessed programmatically through Enrichr or independently from the Appyter Catalog.
Necessary Resources:
Hardware – Desktop or a laptop computer, or a mobile device, with a fast Internet connection
Software – An up-to-date web browser such as Google Chrome (https://www.google.com/chrome/), Mozilla Firefox (https://www.mozilla.org/en-US/firefox/), Apple Safari (https://www.apple.com/safari/), or Microsoft Edge (https://www.microsoft.com/en-us/edge).
Protocol steps and annotations:
Getting enrichment analysis results
-
1
To understand how to input a gene list into Enrichr for enrichment analysis, please follow the instructions of Basic Protocol 1 from Step 1 to Step 7.
-
2
Click on a gene set library, such as ChEA 2016, on the Enrichr results page to access a more detailed analysis page (see Figure 4). To understand the bar graph, table, grid, network, and clustergram visualization tabs, please follow the instructions of Basic Protocol 1, Step 10 to Step 15.
Running the Appyter programmatically directly from Enrichr
-
3
Click on the “Appyter” tab, then click on the red “Open Appyter” button above the visualization explanations (Figure 44). This brings you to the Enrichment Analysis Visualization Appyter execution page (Figure 45). A small blue box at the top of the page shows the status of the Appyter execution and should read “Queued successfully” when the Appyter first initializes. A queue position of 1 or more means your notebook will be executed once it reaches the head of the queue.
There is no input form for this Appyter because the inputs have been automatically filled in based on the gene library selected in Step 3, and the gene list input in Step 2.
-
4
The notebook will begin to automatically execute shortly after your position in the queue reaches 1, at which point the blue status box will display the text “Executing…” (Figure 46), and you will begin to see the output appearing in real time.
-
5
When the notebook has finished executing, the blue status box will read “Success” (Figure 47). At this point, you can scroll down to view all outputs and visualizations.
Fig. 44.
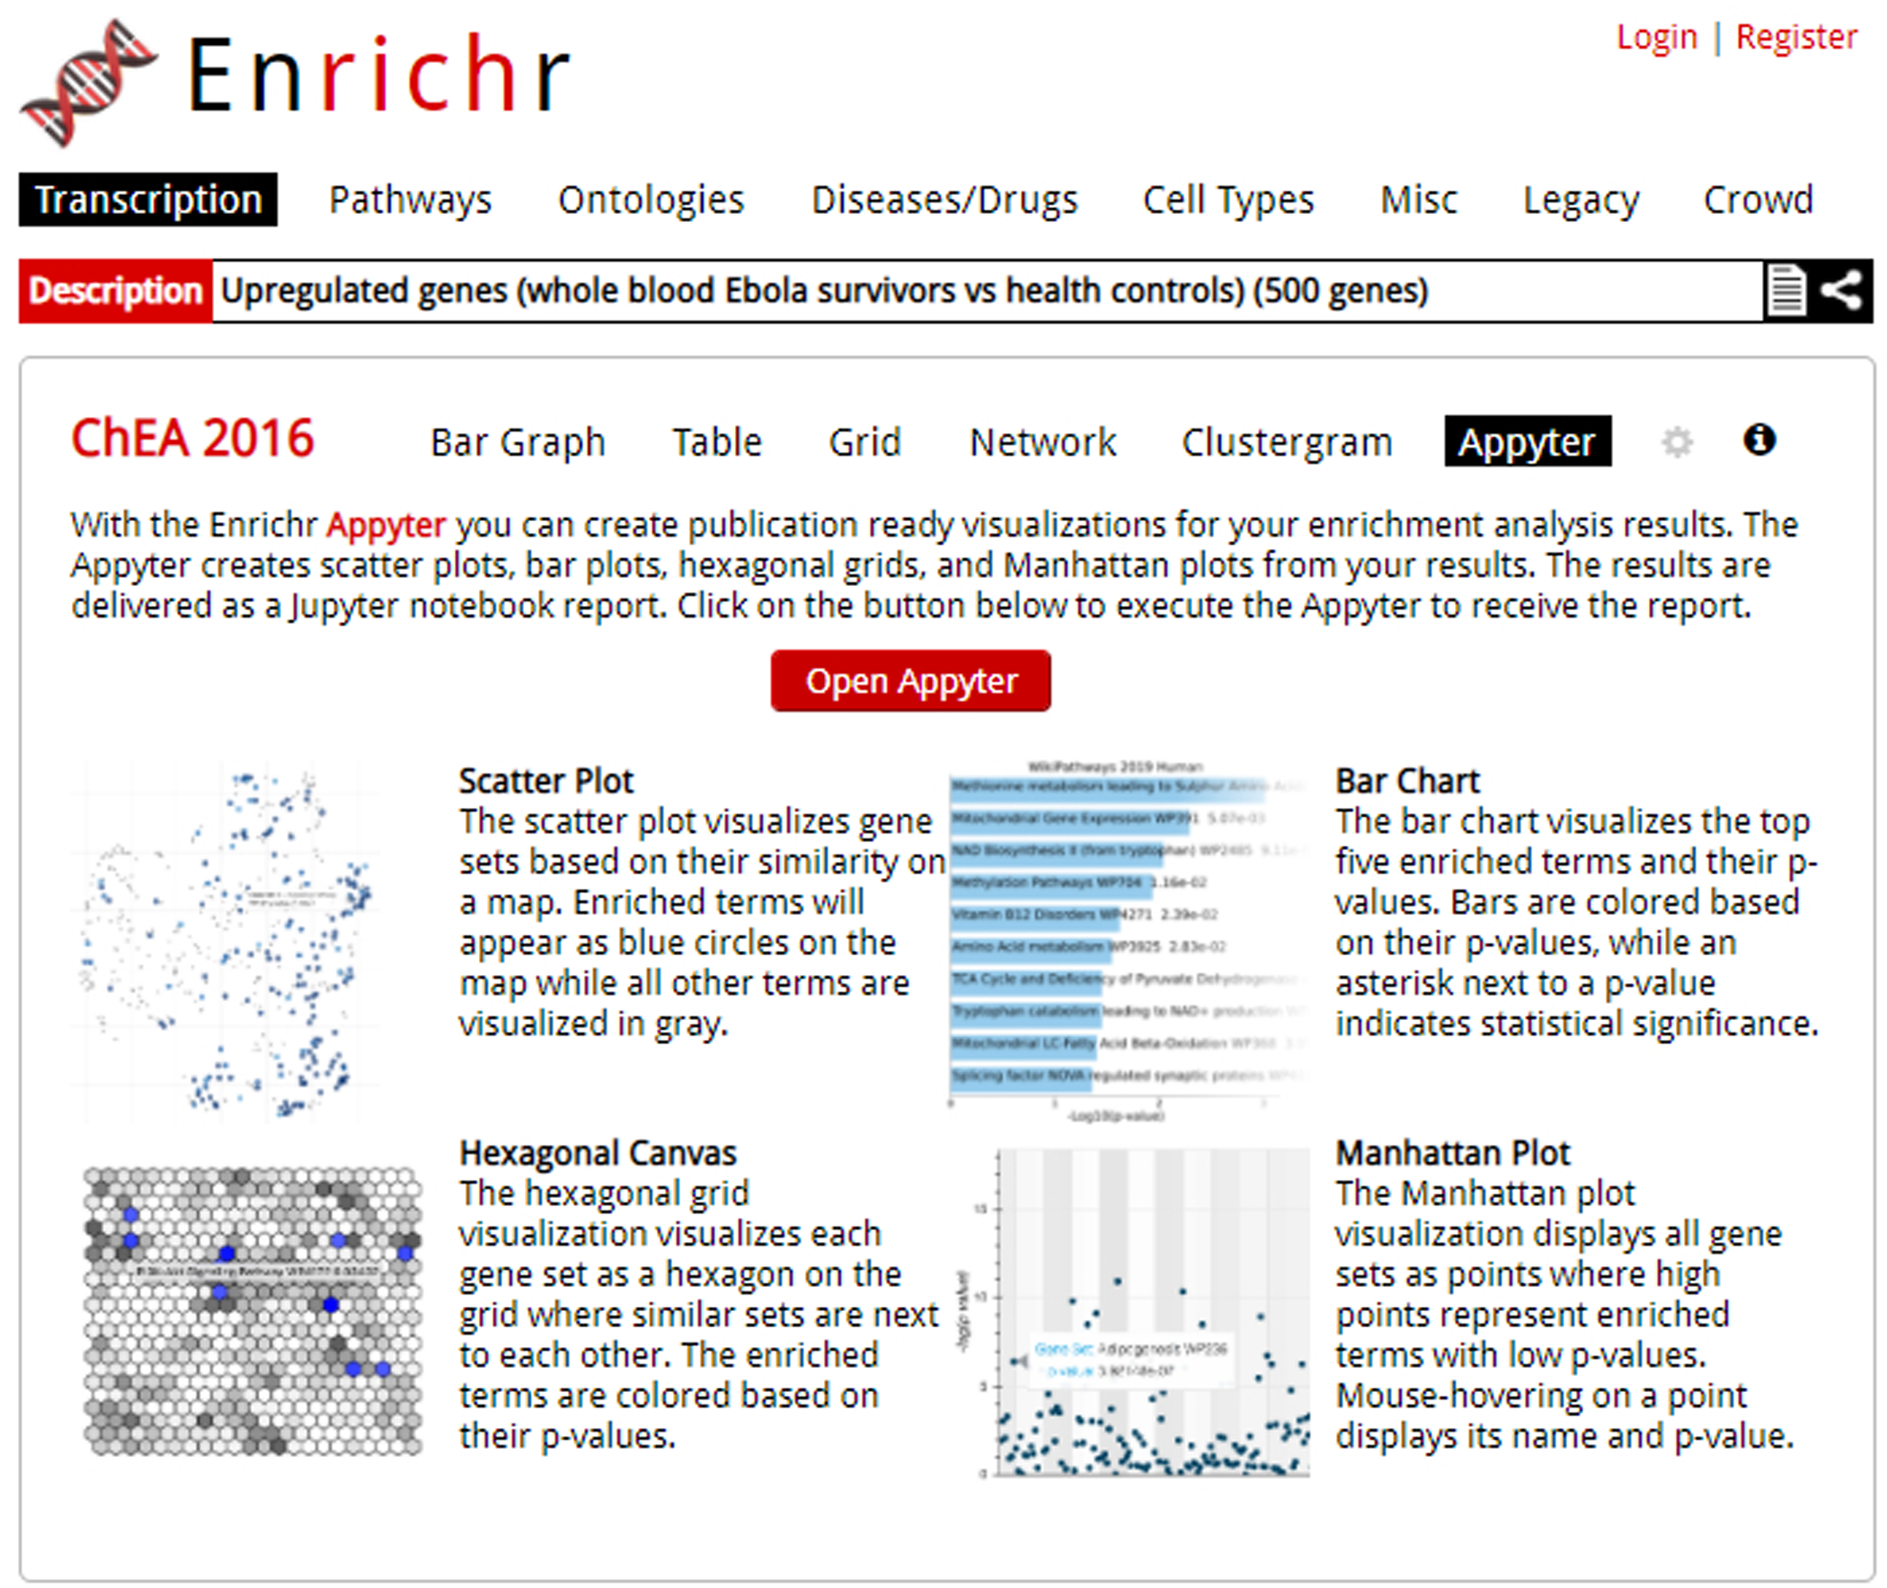
The Appyter launch screen from Enrichr.Appyter is launched upon clicking the red button in the middle of the page.
Fig. 45.
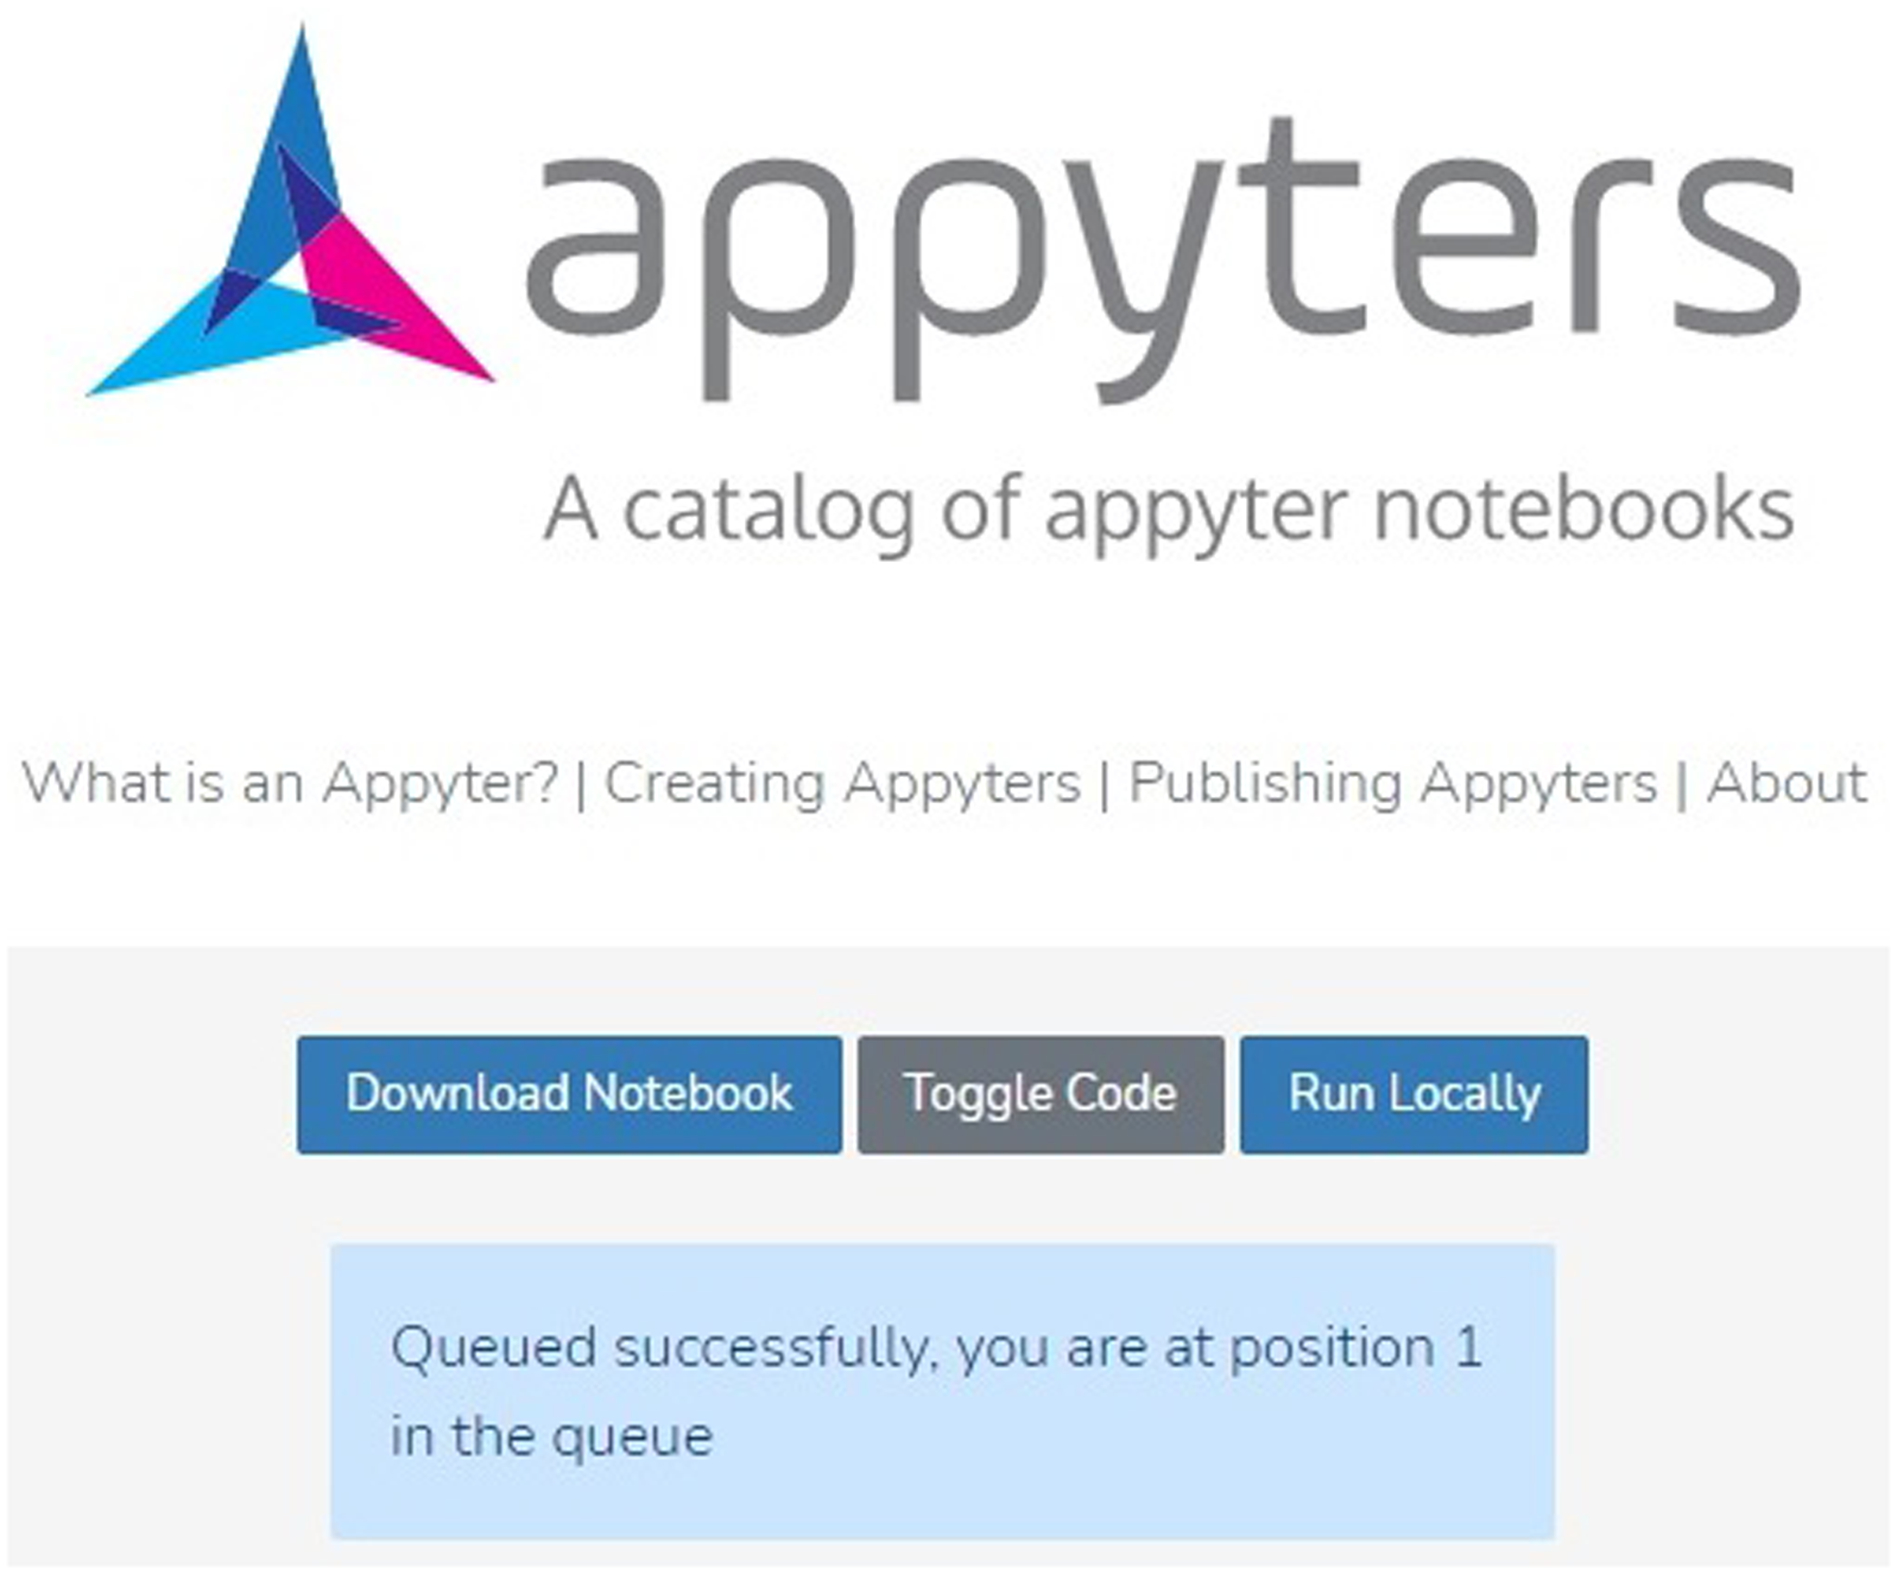
The execution page of the Enrichment Analysis Visualization Appyter when it is first opened programmatically from Enrichr. The blue status box may tell the user their position in the execution queue.
Fig. 46.
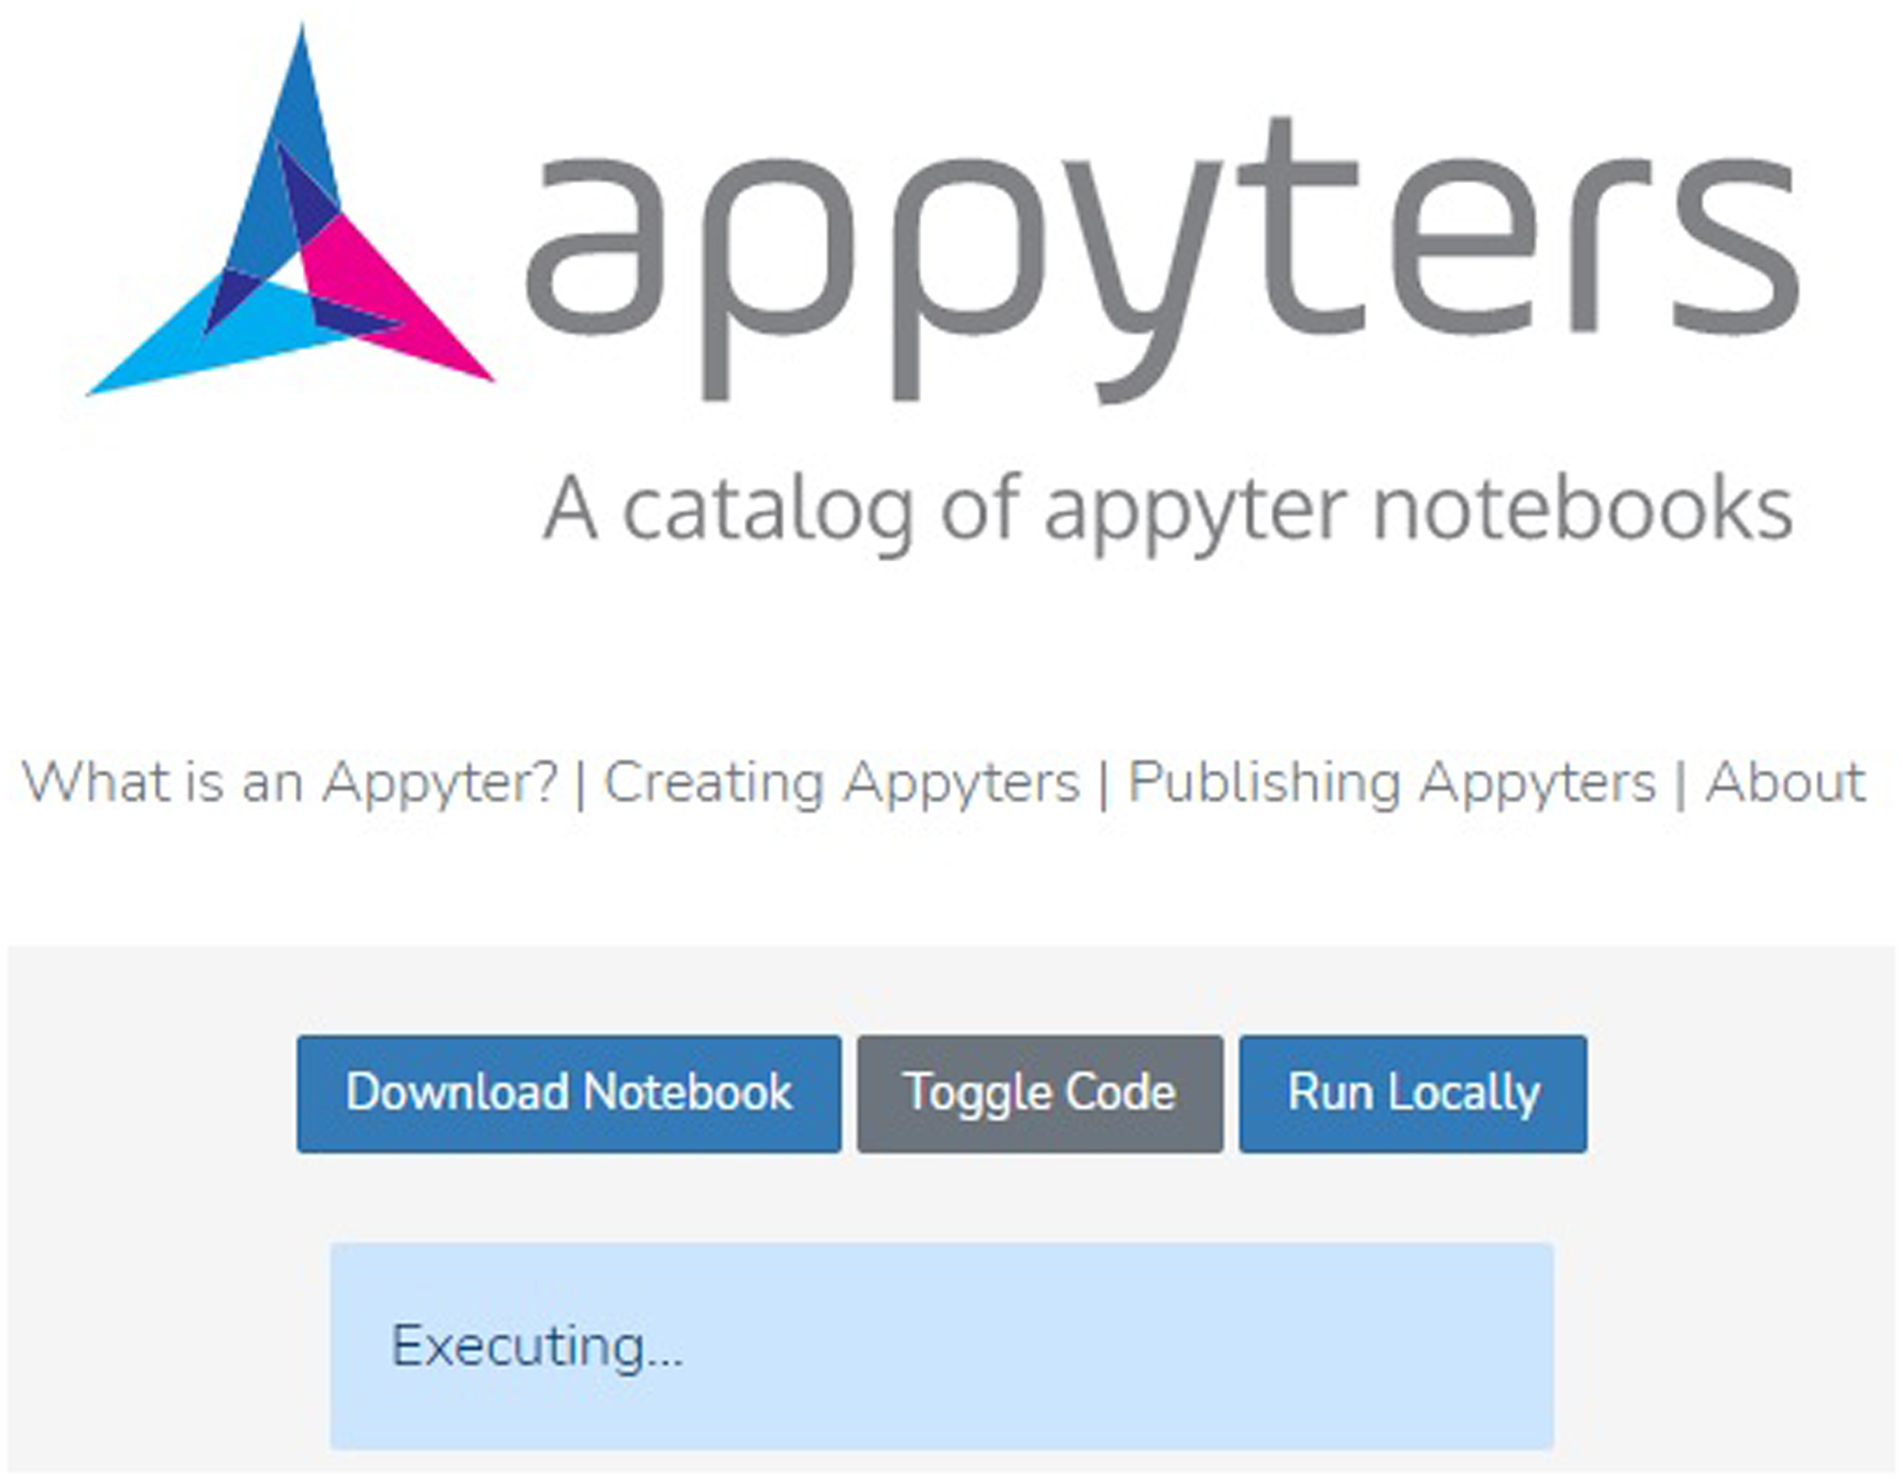
The Appyter during execution of the notebook, as indicated by the blue status box at the top. Outputs will appear in the notebook as the execution progresses.
Fig. 47.
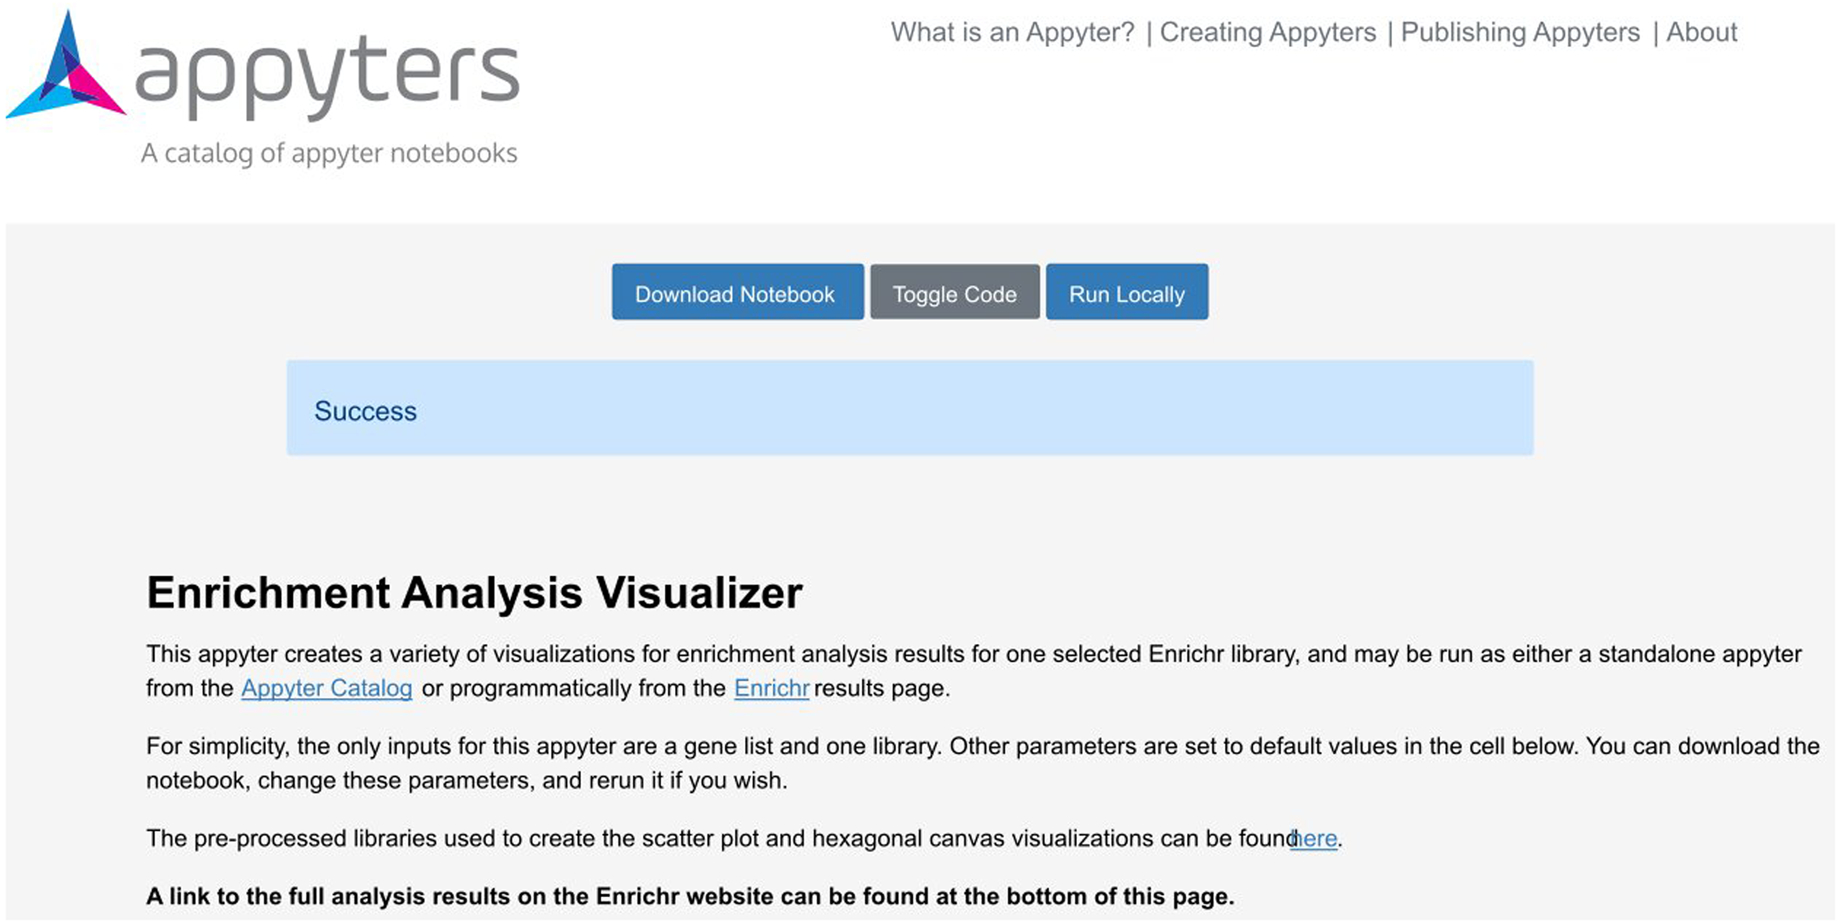
The Appyter after all code has been successfully executed, as indicated by the blue status box.
Viewing enrichment analysis visualizations in the Appyter
-
6
Scroll down to the “Scatter Plot” section to see the scatter plot visualization (Figure 48). Each term from the library is represented by a point on the plot: the larger blue terms are significantly enriched, with darker color indicating higher significance and smaller p- value. Hover over individual points to display the associated gene set name and p-value. Click and drag the plot to pan around the graph area. Use the toolbar on the right side of the plot to zoom in, reset the plot to its original size, or save the plot as an SVG file.
Hover over any of the icons on the toolbar to display the function corresponding to that icon. The pan, wheel zoom, and point-hover functionalities can be toggled on and off.
-
7
Scroll down to the “Bar Chart” section to see the bar chart visualization (Figure 49). The bars display the name and p-value corresponding to the top 10 enriched terms in the chosen library, with the most enriched term at the top. Blue bars correspond to significantly enriched terms. An asterisk indicates the term also has a significant adjusted p-value. Download the bar chart as a PNG or SVG file using the “Download png” and “Download svg” links, respectively, located below the bar chart.
-
8
Scroll down to the “Hexagonal Canvas” section to see the hexagonal canvas plot (Figure 50). Each hexagon represents a gene set from the selected library. Gene sets are grouped by similarity to each other, and brighter-colored gene sets have a higher Jaccard similarity to the input gene list. Hover over a hexagon to display the name of the gene set and the associated similarity index.
-
9
Scroll down to the “Manhattan Plot” section to see the Manhattan plot visualization (Figure 51). The x-axis denotes the gene sets from the library, and the y-axis measures the −log(p-value) of each gene set. Hover over any point to display the name of the gene set and its original p-value. Click and drag the plot to pan around the graph area. Use the toolbar on the right side of the plot to zoom in, reset the plot to its original size and view, or save the plot as an SVG file.
-
10
Scroll down to the “Volcano Plot” section to see the volcano plot visualization (Figure 52). Each point represents a single gene set from the library, with its x-axis position measuring the odds ratio and its y-axis position measuring the −log(p-value) calculated from enrichment analysis against the input gene list. Hover over a point to display the name of the gene set, its original p-value, and its odds ratio. Click and drag the plot to pan around the graph area. Use the toolbar on the right side of the plot to zoom in, reset the plot to its original size, or save the plot as an SVG file.
-
11
Scroll down to the “Table of significant p-values” section (Figure 53). This table lists every significantly enriched term from the selected library along with its corresponding p-value and q-value. The table heading includes the name of the selected library. Download the table as a CSV file by clicking the “Download CSV file of this table” link below the table.
-
12
Scroll down to the “Link to Enrichr” section at the bottom of the Appyter. Click the link to return to the detailed analysis page (Figure 4) and view the full results for each library from the original enrichment analysis query. Repeat Step 2 to Step 11 for a different library to view the enrichment results for that library in the Appyter.
Fig. 48.
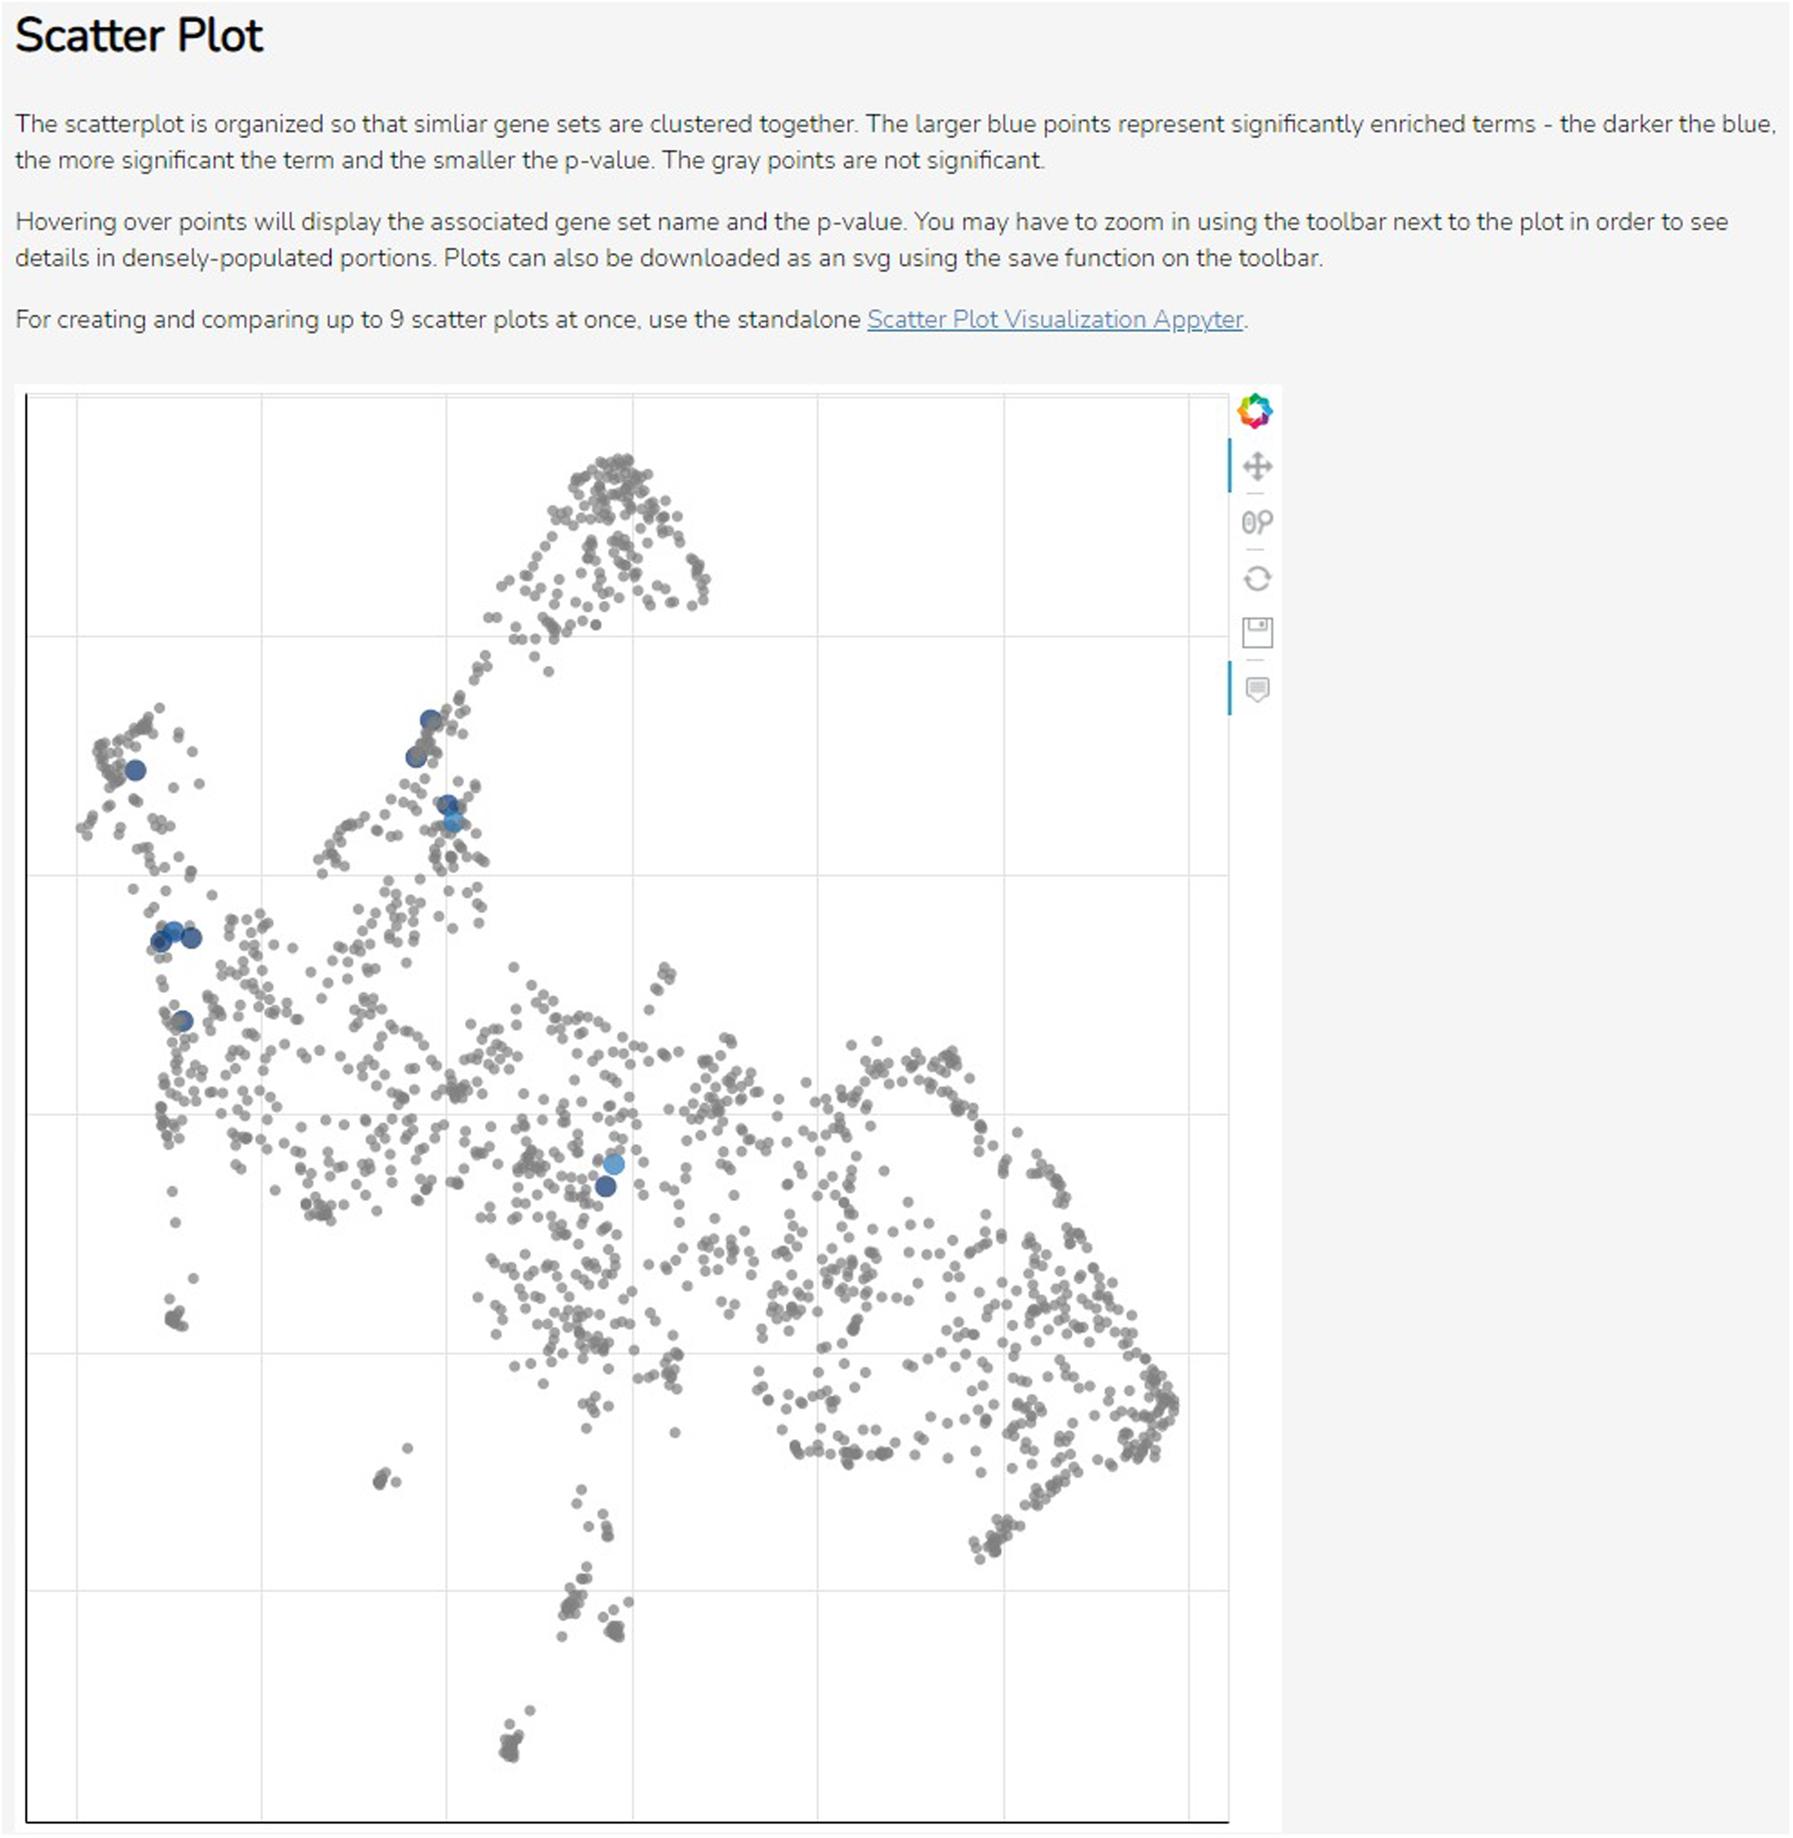
The scatter plot visualization. Each point is a term from the selected library, clustered by similarity, with large blue points being significantly enriched terms. The toolbar on the right can be used to navigate or download the plot.
Fig. 49.
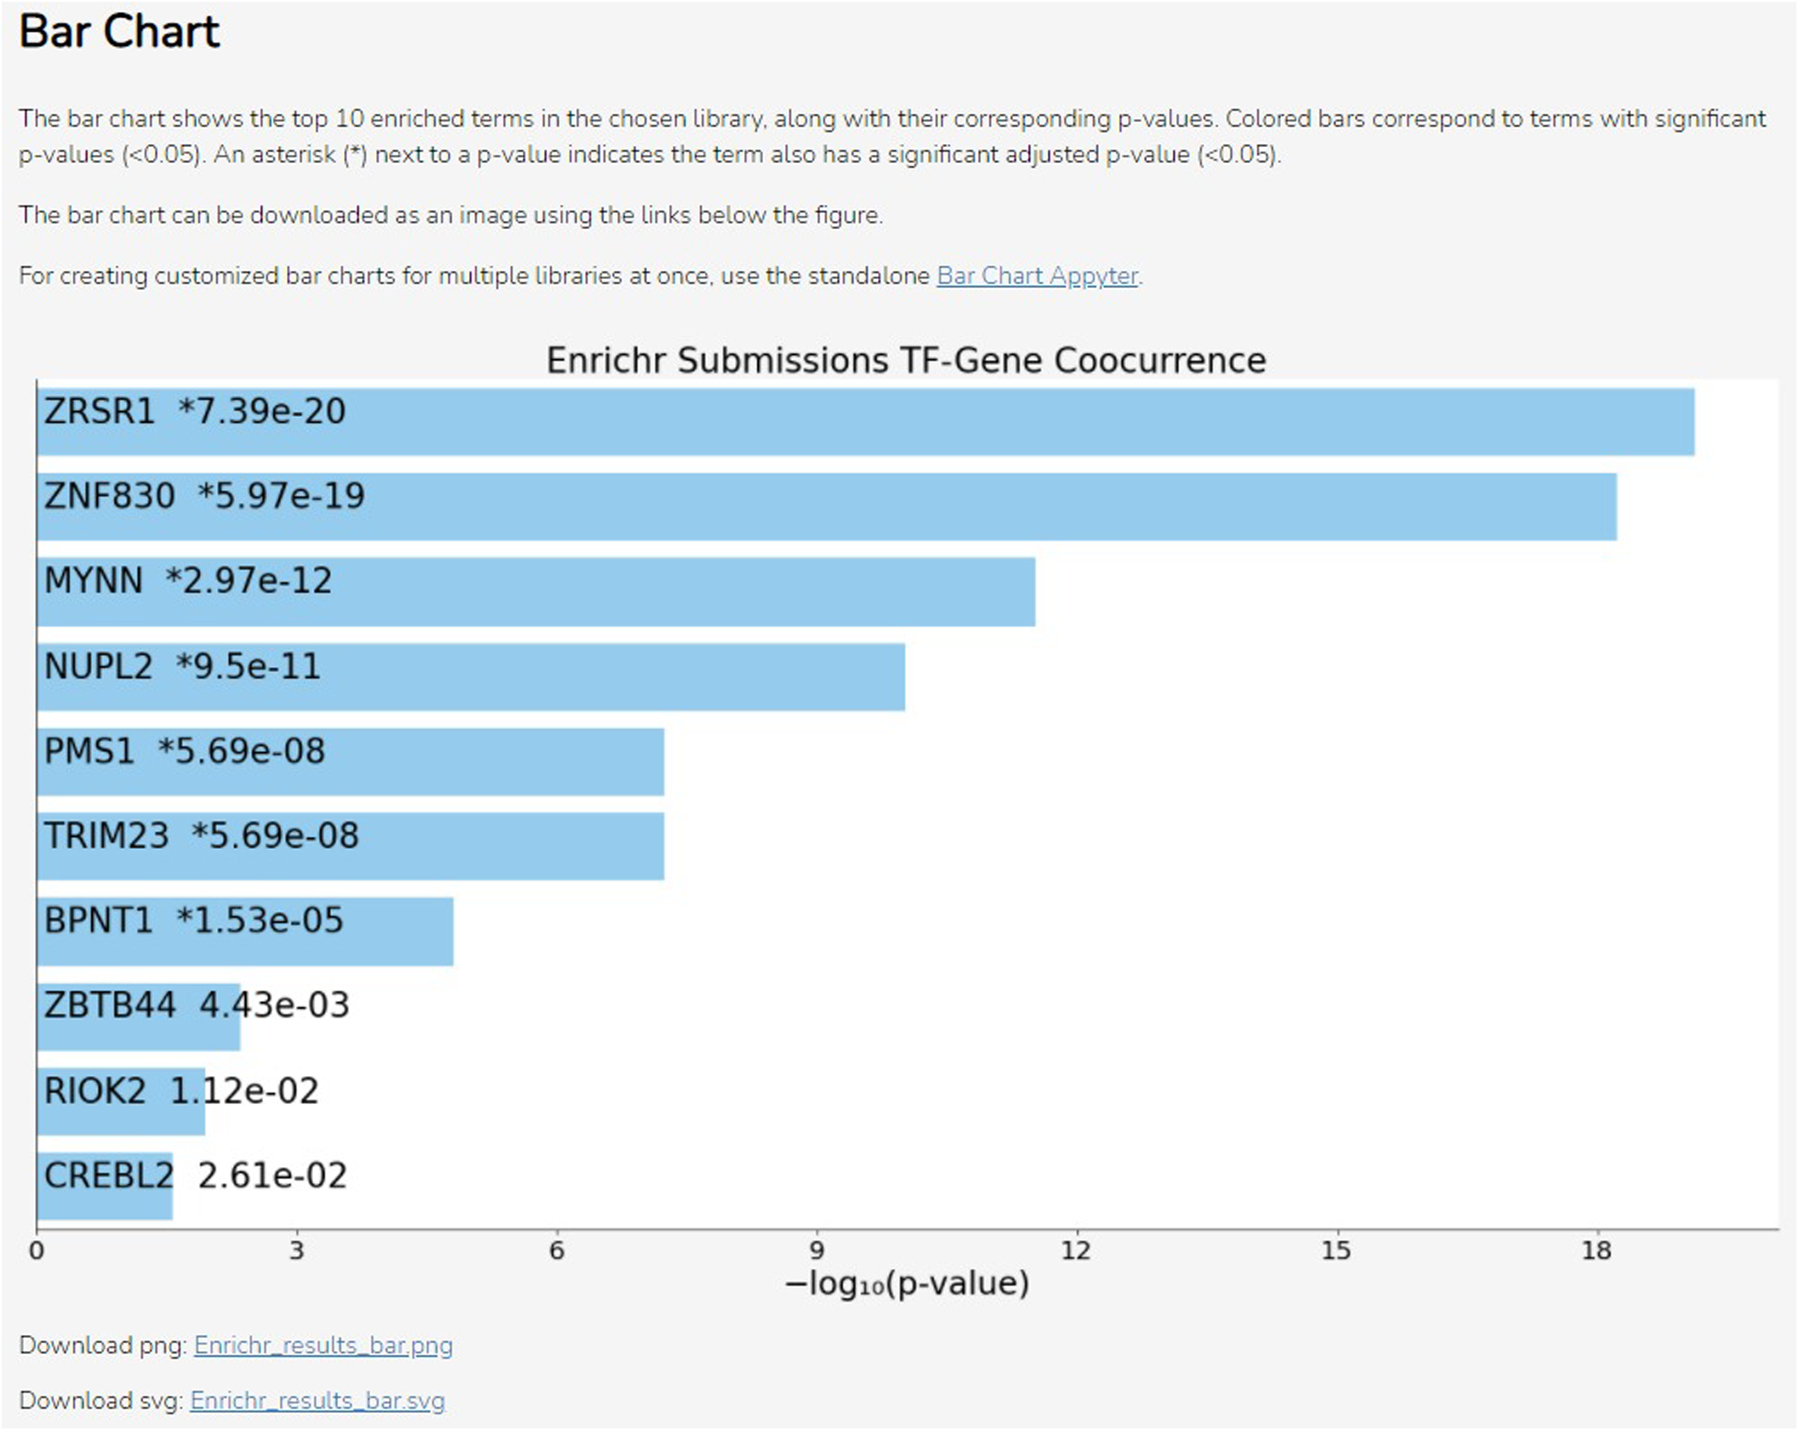
The bar chart visualization. The title of the chart is the selected library. Each bar is ordered by rank and labeled with the name of the term it represents from the library and the corresponding p-value. Blue-colored bars indicate significantly enriched terms. Links for download are below the chart.
Fig. 50.
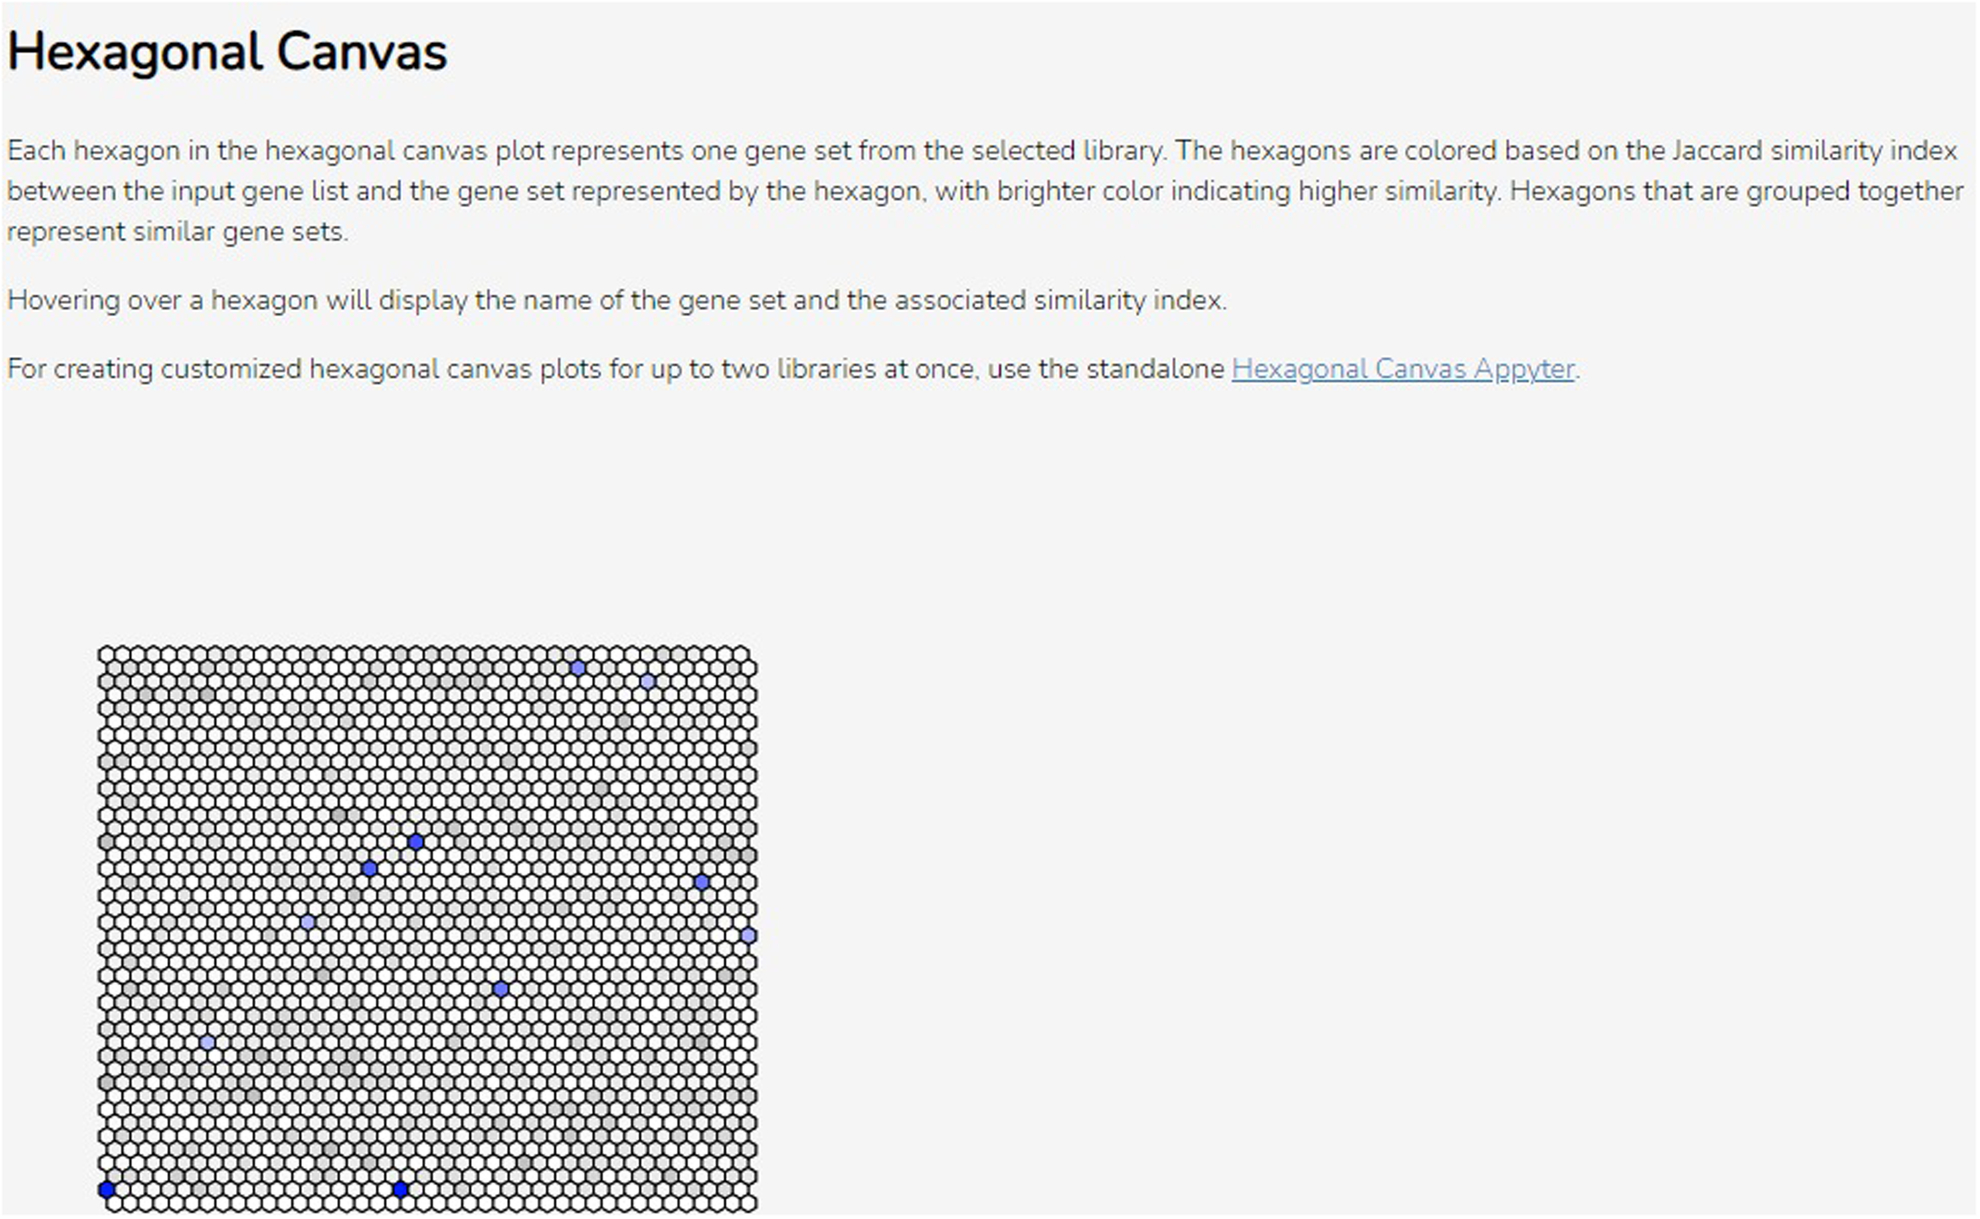
The hexagonal canvas plot. Each hexagon represents a gene set, with brighter colors indicating higher similarity to the input gene list. Similar gene sets are clustered together.
Fig. 51.
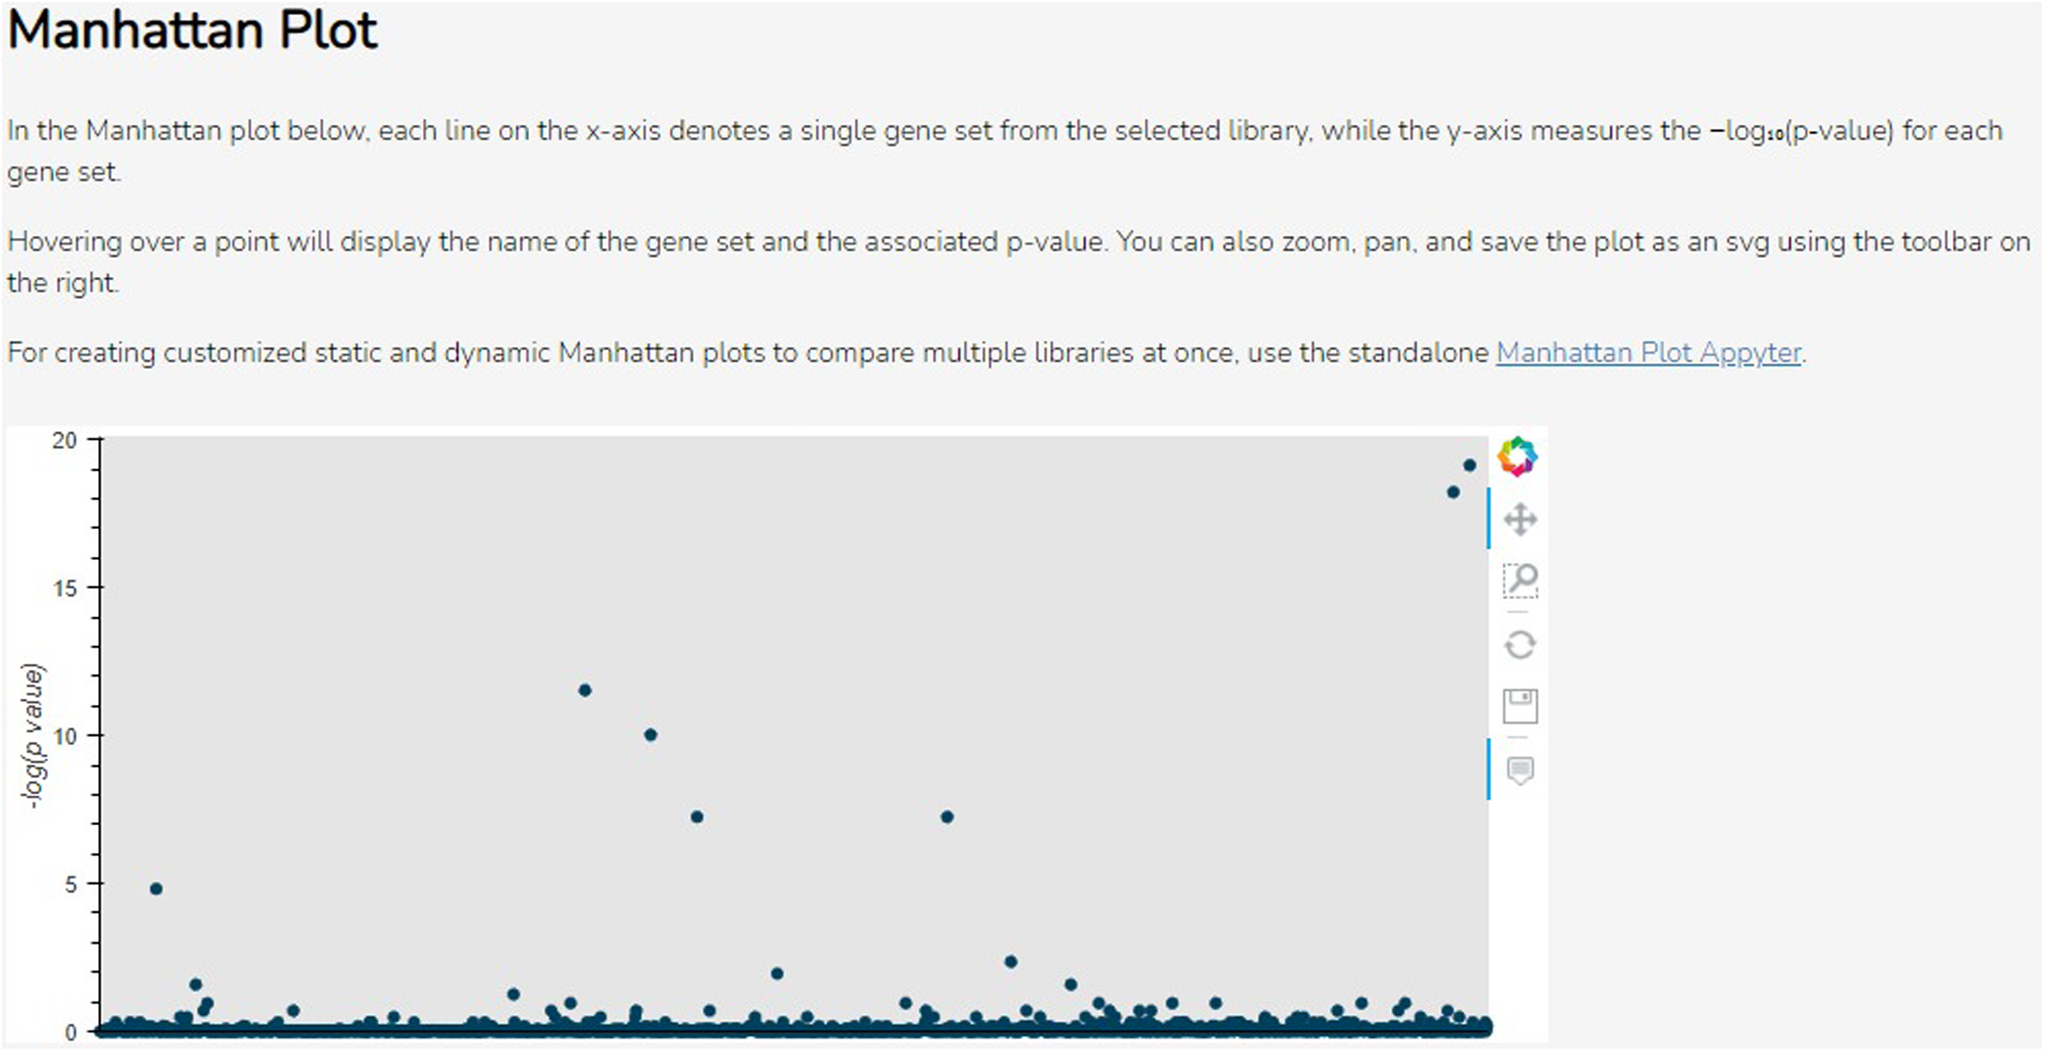
The Manhattan plot. Each point gives the −log(p-value) (y-axis) of a single gene set (x-axis) in the library. The toolbar on the right can be used to navigate or download the plot.
Fig. 52.
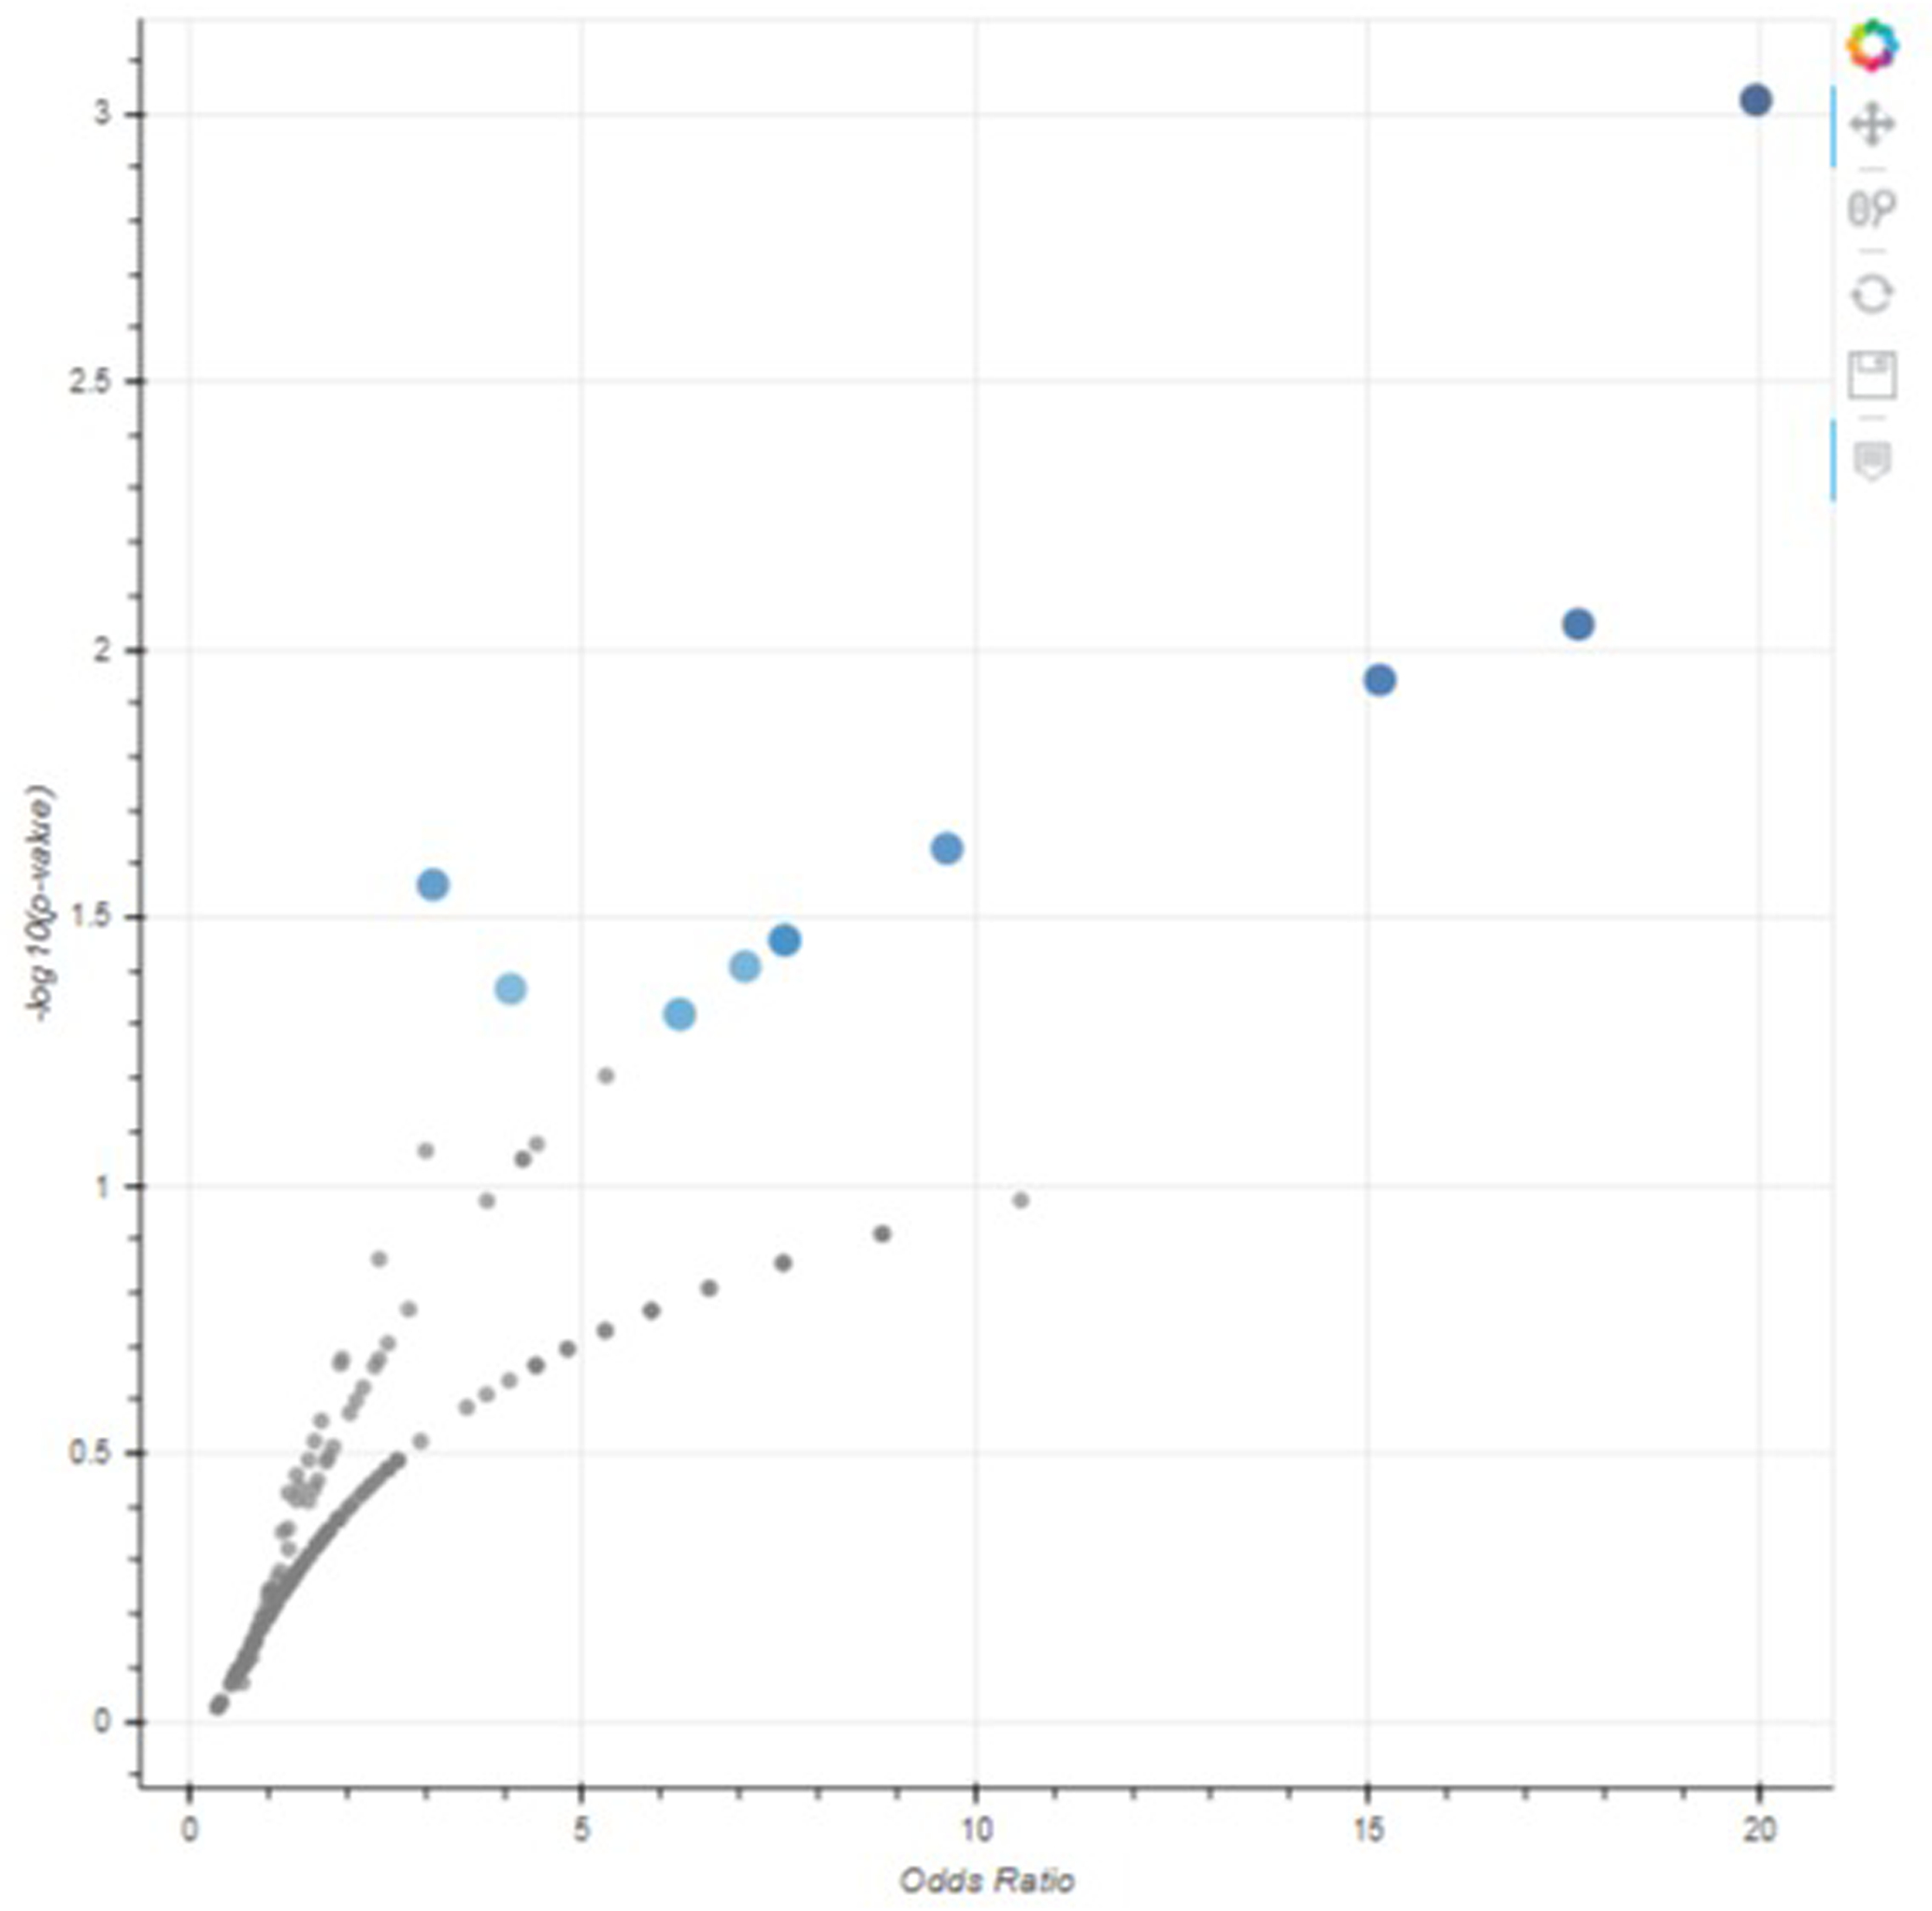
The volcano plot. Each point represents a gene set, with the x-position being the odds ratio and the y-position being the −log(p-value). The toolbar on the right can be used to navigate or download the plot.
Fig. 53.
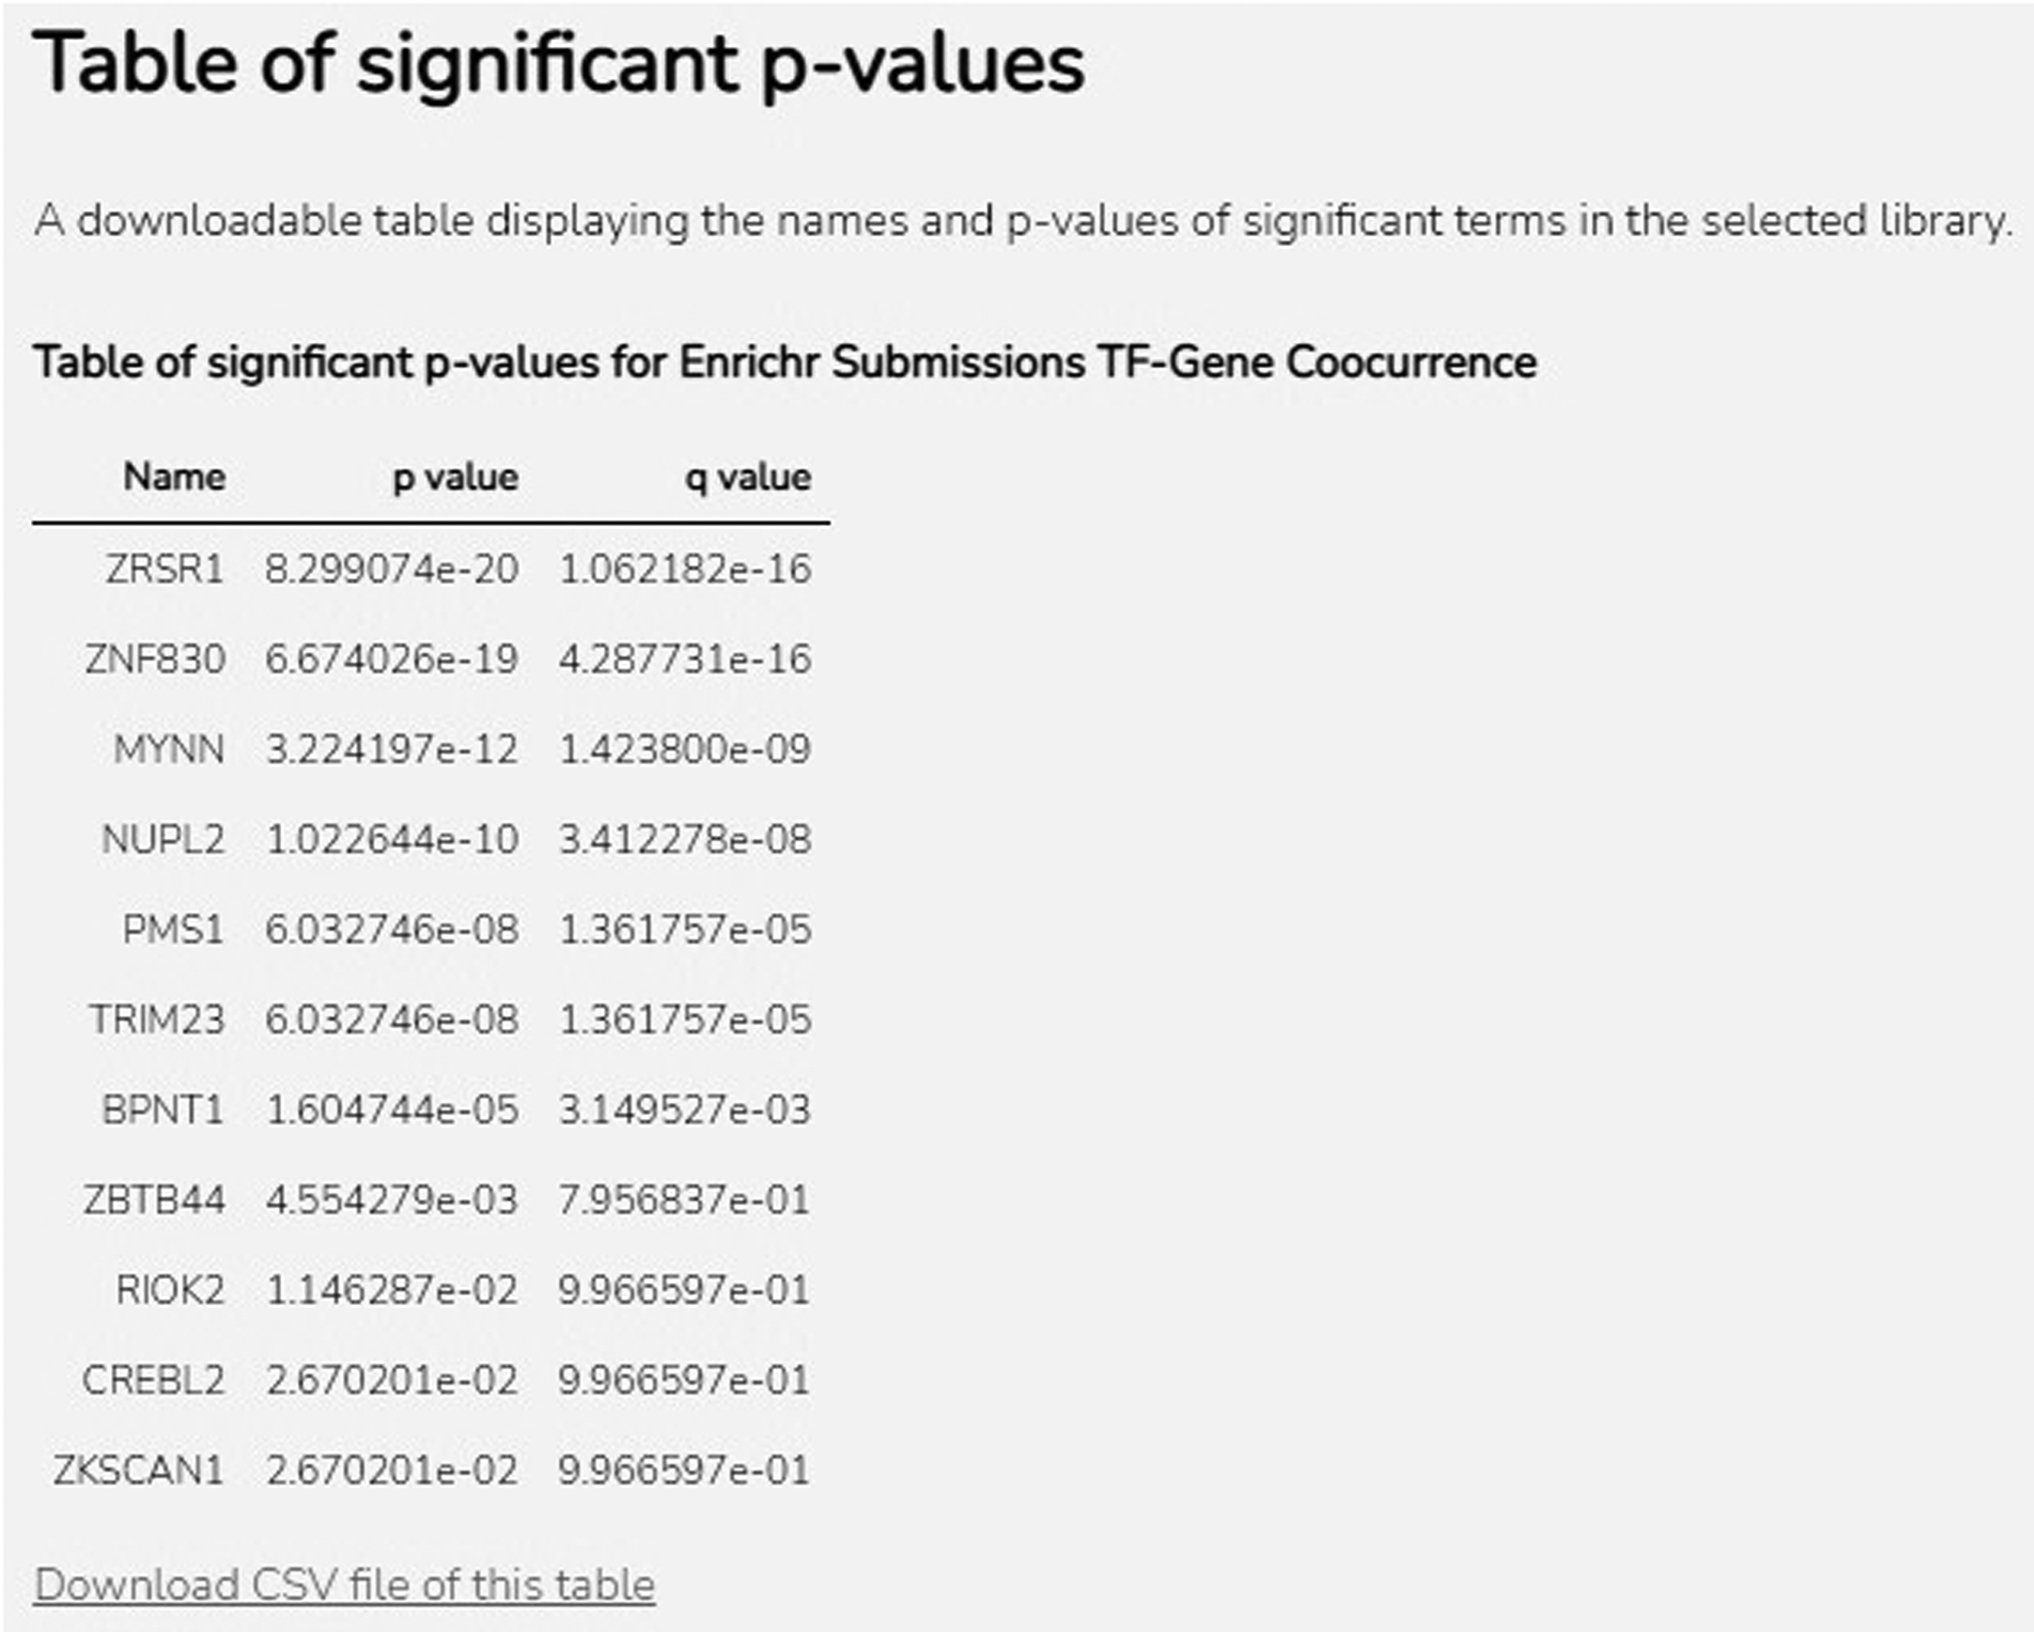
Table displaying all significantly enriched terms, as well as corresponding p-values and q-values for the selected library. A download link is available as well.
Downloading the Appyter results
-
13
To view the source code of the Appyter, scroll to the top of the page and click on the gray “Toggle Code” button above the blue status bar to display the Python code cells in the notebook (Figure 54). Click it again to hide the source code.
-
14
Click the blue “Download Notebook” button at the top of the page to download the Appyter analysis as a Jupyter Notebook (.ipynb) file, including all source code, outputs, and visualizations. You may now edit, re-execute, or share the notebook locally on your own system.
Fig 54.
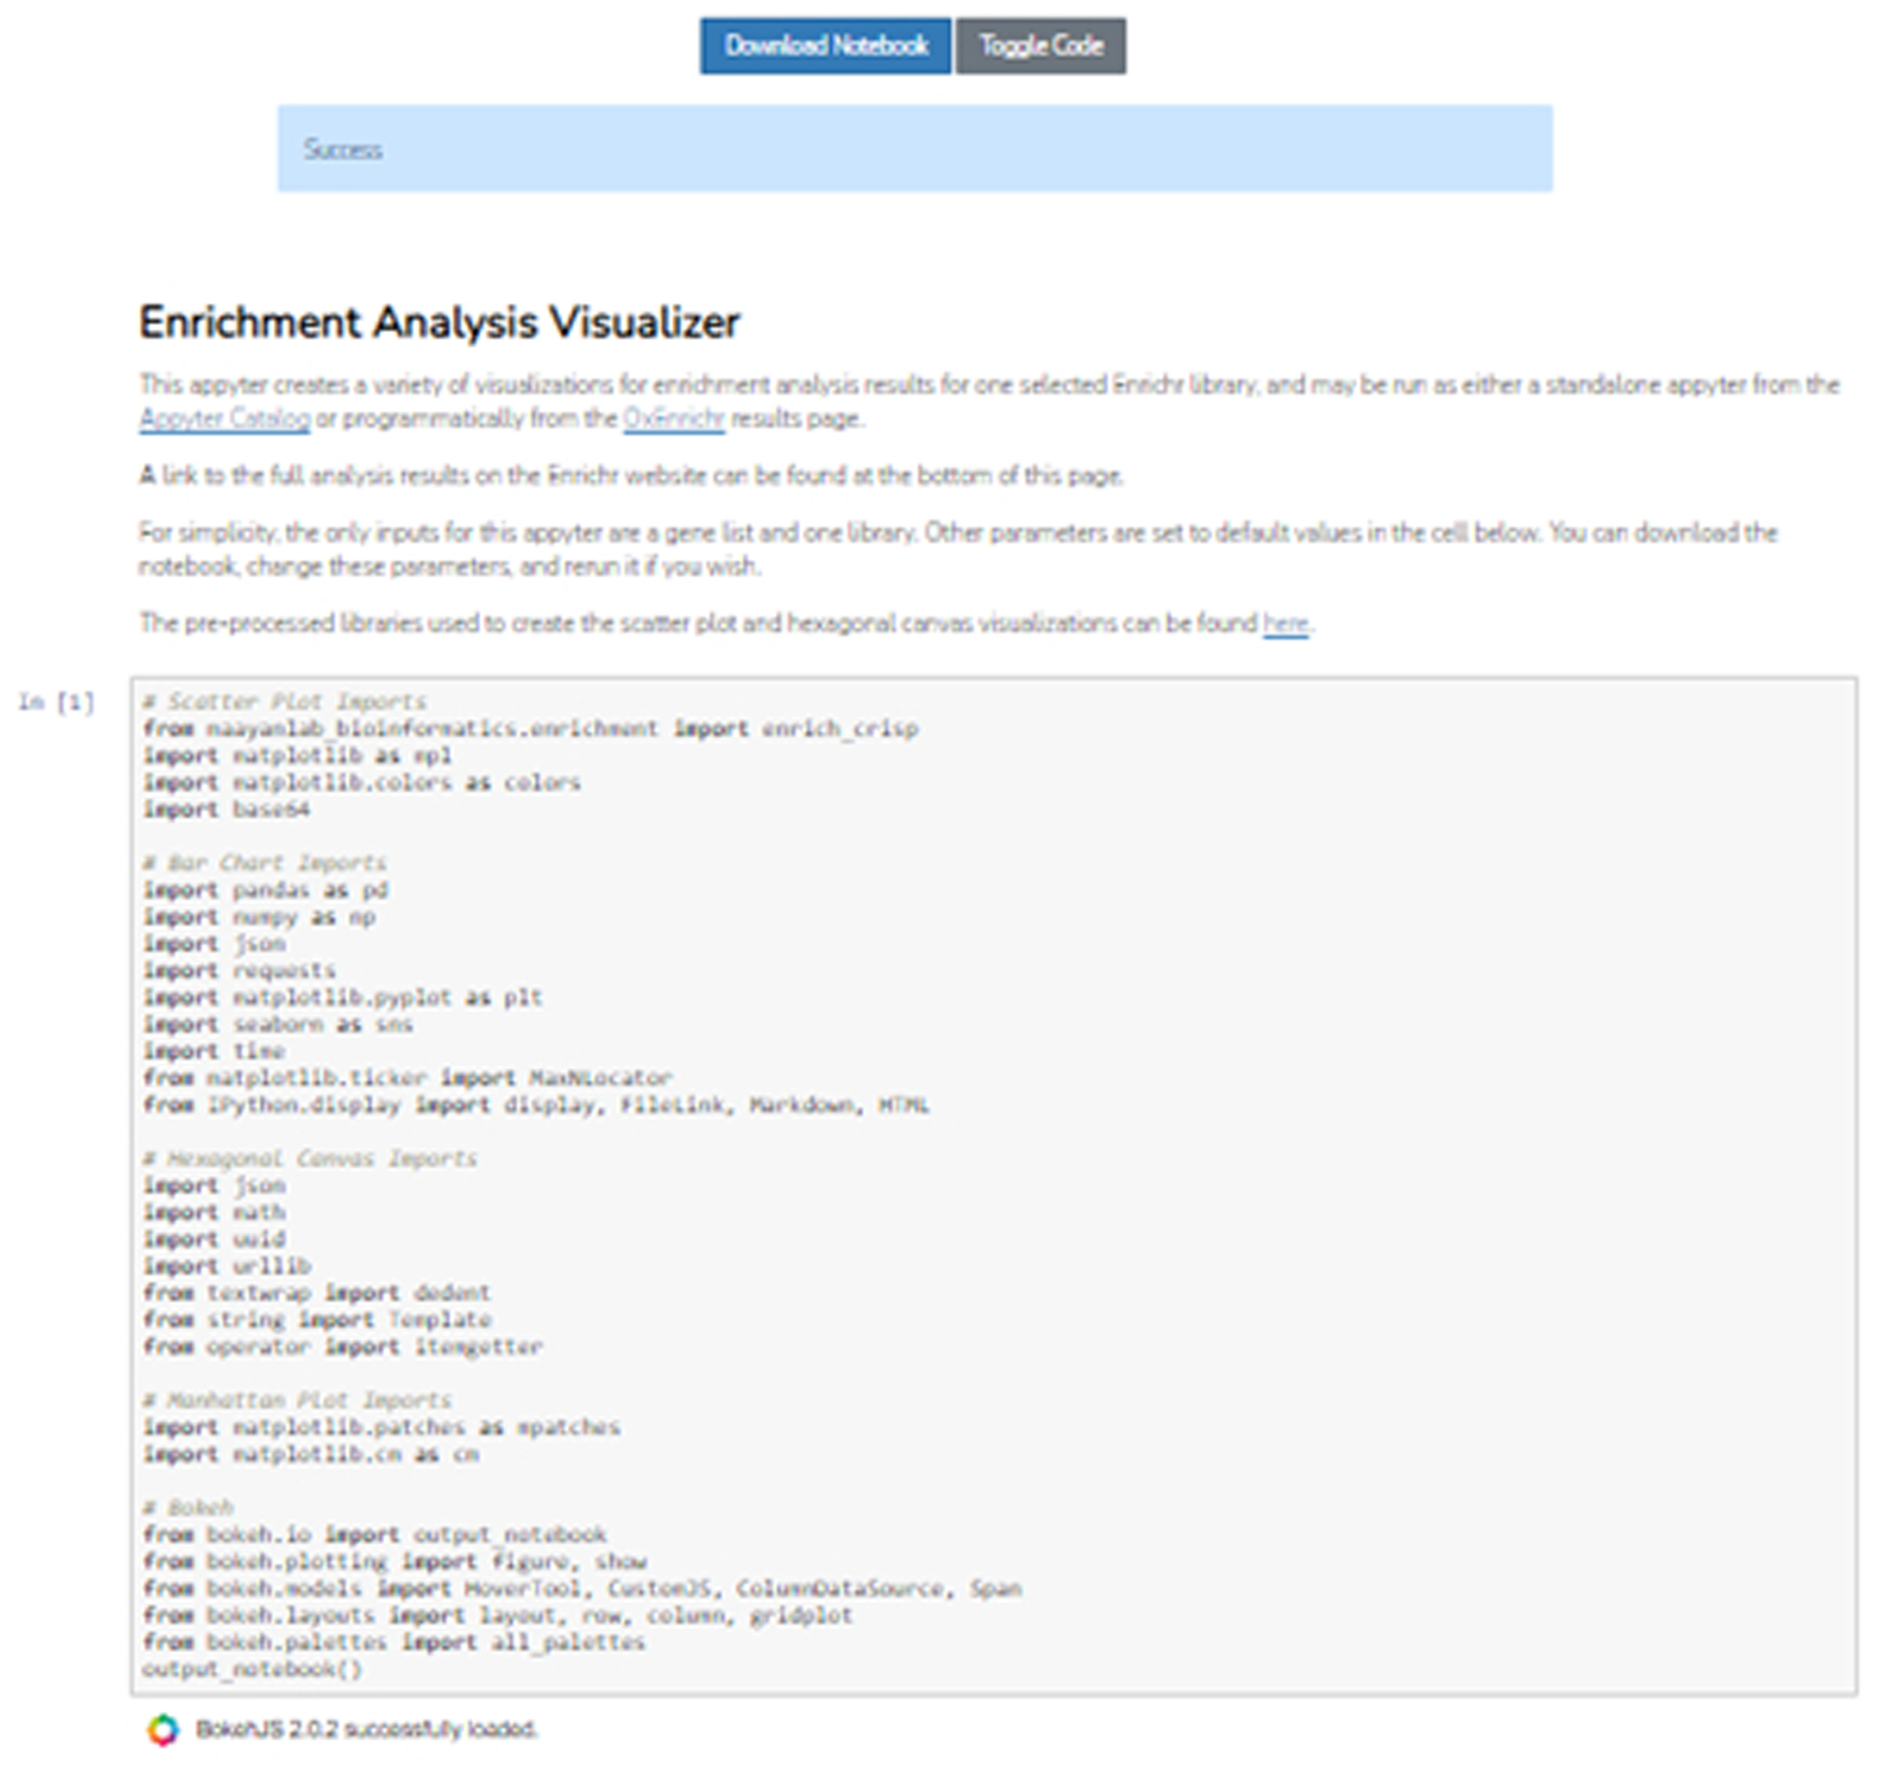
The code used to execute the commands of the Appyter are displayed when the “Toggle Code” button is selected. To hide the code, click the button again.
Basic Protocol 8
Using the Enrichr API
Enrichr can be accessed programmatically via calls to the Enrichr API, documented at https://maayanlab.cloud/Enrichr/help#api. The API is useful for multi-step or chained analyses, as well as for adding Enrichr functionality to other programs. There are five endpoints provided to allow users to add a gene set for analysis, view an added gene set, enrich an added gene set, download enrichment results for a gene set, or view all terms that contain an individual gene.
Necessary Resources:
Hardware – Desktop or a laptop computer, or a mobile device, with a fast Internet connection
Software – Text editor or development environment of choice, such as Visual Studio (https://visualstudio.microsoft.com/downloads/); most updated version of Python (https://www.python.org/downloads/), with built-in json library (https://docs.python.org/3/library/json.html); Python requests library (https://requests.readthedocs.io/en/master/user/install/)
Protocol steps and annotations:
-
1Open a new or existing Python code file. Import the JSON and requests libraries at the top of the file.
import json
import requests
Adding a gene list for analysis
-
2Call the requests.post method to send a POST request to the URL http://maayanlab.cloud/Enrichr/addList. The input is a dictionary-like object with two keys: “list”, which maps to a string containing all the genes in your input gene list, separated by newlines; and “description”, which maps to a string description of the gene list. In the example code below, a brief list of genes described by the string “Example gene list” is added to Enrichr:
ENRICHR_URL = ‘http://maayanlab.cloud/Enrichr/addList’
genes_str = ‘\n’.join([
   ’PHF14’, ‘RBM3’, ‘MSL1’, ‘PHF21A’, ‘ARL10’, ‘INSR’,
   ’JADE2’, ‘P2RX7’, ‘LINC00662’, ‘CCDC101’, ‘PPM1B’,
   ’KANSL1L’, ‘CRYZL1’, ‘ANAPC16’, ‘TMCC1’, ‘CDH8’,
   ’RBM11’, ‘CNPY2’, ‘HSPA1L’, ‘CUL2’, ‘PLBD2’, ‘LARP7’,
   ’TECPR2’, ‘ZNF302’, ‘CUX1’, ‘MOB2’, ‘CYTH2’, ‘SEC22C’,
   ’EIF4E3’, ‘ROBO2’, ‘ADAMTS9-AS2’, ‘CXXC1’, ‘LINC01314’,
   ’ATF7’, ‘ATP5F1’
])
description = ‘Example gene list’
payload = {
   ’list’: (None, genes_str),
   ’description’: (None, description)
}
response = requests.post(ENRICHR_URL, files=payload)
if not response.ok:
    raise Exception(‘Error analyzing gene list’)
data = json.loads(response.text)
For more information on using the requests library in Python, please refer to the requests library homepage (https://requests.readthedocs.io/en/master/user/quickstart/).
-
3Use the json.loads method to view the response as a JSON object containing an integer “userListId” and a string “shortId”. An example response would be as follows:
{
 ”userListId”: 363320,
 ”shortId”: “59lh”
}
For more information on using the JSON library in Python, please refer to the JSON library homepage (https://docs.python.org/3/library/json.html)
Viewing a gene list
-
4Call the requests.get method to send a GET request to the URL http://maayanlab.cloud/Enrichr/view?userListId=[userListId], where the input [userListId] is an integer “userListId” assigned to a list previously added to Enrichr. In the example code below, the [userListId] input used is 363320, which was the output from Step 3.
ENRICHR_URL = ‘http://maayanlab.cloud/Enrichr/view?userListId=%s’
user_list_id = 363320
response = requests.get(ENRICHR_URL % user_list_id)
if not response.ok:
  raise Exception(‘Error getting gene list’)
data = json.loads(response.text)
-
5Use the json.loads method to view the response as a JSON object containing a list of gene strings “genes” and a string “description”, which should both match the inputs from Step 2 if the same “userListId” was used. As expected, the example output below returns a gene list and description matching the inputs from Step 2.
{
 ”genes”: [
   ”PHF14”, “RBM3”, “MSL1”, “PHF21A”, “ARL10”, “INSR”,
   ”JADE2”, “P2RX7”, “LINC00662”, “CCDC101”, “PPM1B”,
   ”KANSL1L”, “CRYZL1”, “ANAPC16”, “TMCC1”, “CDH8”,
   ”RBM11”, “CNPY2”, “HSPA1L”, “CUL2”, “PLBD2”, “LARP7”,
   ”TECPR2”, “ZNF302”, “CUX1”, “MOB2”, “CYTH2”, “SEC22C”,
   ”EIF4E3”, “ROBO2”, “ADAMTS9-AS2”, “CXXC1”, “LINC01314”,
   ”ATF7”, “ATP5F1”
 ],
 ”description”: “Example gene list”
}
Getting enrichment analysis results
-
6Call the requests.get method to send a GET request to the URL http://maayanlab.cloud/Enrichr/enrich?userListId=[userListId]&backgroundType=[backgroundType]. There are two inputs to substitute in: an integer [userListId], which is a “userListId” assigned to a list previously added to Enrichr; and a string [backgroundType], which is the name of an Enrichr background library to run the analysis against. In the example code below, the [userListId] input used is 363320, obtained from the output in Step 3, and the [backgroundType] is “KEGG_2015”.
ENRICHR_URL = ‘http://maayanlab.cloud/Enrichr/enrich’
query_string = ‘?userListId=%s&backgroundType=%s’
user_list_id = 363320
gene_set_library = ‘KEGG_2015’
response = requests.get(
  ENRICHR_URL + query_string % (user_list_id, gene_set_library)
)
if not response.ok:
  raise Exception(‘Error fetching enrichment results’)
data = json.loads(response.text)
To find an appropriate [backgroundType] input, a complete list of all available libraries can be found on the Enrichr stats page (https://maayanlab.cloud/Enrichr/#stats).
-
7Call the json.loads method to view the response as a JSON object that maps the name of the background library to a list of lists containing the rank, name, p-value, z-score, combined score, list of overlapping genes, and adjusted p-value for each term in the input library, in that order. The example output below would be is the result of running enrichment analysis for the gene set added in Step 2 against the KEGG 2015 library.
{
 ”KEGG_2015”: [
  [
   1,
   ”ubiquitin mediated proteolysis”,
   0.06146387620182772,
   −1.8593425456520887,
   2.8168673182384705,
   [“CUL2”],
   0.21981251622012696
  ],
  [
   2,
   ”type ii diabetes mellitus”,
   0.06594375486603808,
   −1.799654722223511,
   2.7264414418952905,
   [“INSR”],
   0.21981251622012696
  ],
  …
 ]
}
For more information on what the different scores mean in the output, please see the Enrichr Background Information page (https://maayanlab.cloud/Enrichr/help#background).
Finding terms that contain a given gene
-
8Call the requests.get method to send a GET request to the URL http://maayanlab.cloud/Enrichr/genemap?json=[json]&setup=[setup]&gene=[gene]. There are three inputs: an optional boolean [json], which if set to true will return a JSON object; an optional boolean [setup], which if set to true will return categorical information for each library in which the gene is found; and a string [gene], which is the gene symbol of interest. In the example code below, [json] and [setup] are both set to their default value of “true”, and [gene] is “AKT1”.
ENRICHR_URL = ‘http://maayanlab.cloud/Enrichr/genemap’
query_string = ‘?json=true&setup=true&gene=%s’
gene = ‘AKT1’
response = requests.get(ENRICHR_URL + query_string % gene)
if not response.ok:
  raise Exception(‘Error searching for terms’)
data = json.loads(response.text)
To find an appropriate [gene] input, a complete list of all libraries can be found on the Enrichr stats page (https://maayanlab.cloud/Enrichr/#stats).
-
9
Call the json.loads method to view the response as a JSON object containing a list of all libraries which have terms containing the gene, as well as the descriptions and categorizations of those libraries if [setup] was set to true. The returned object will contain any available information on all of the libraries and terms that include the gene AKT1.
For more information on what the gene library categorizations mean in the output, please see the Enrichr Background Information page (https://maayanlab.cloud/Enrichr/help#background).
Downloading enrichment analysis results
-
10Call the requests.get method to send a GET request to the URL http://maayanlab.cloud/Enrichr/export?userListId=[userListId]&filename=[filename]&backgroundType=[backgroundType]. There are three inputs: an integer [userListId] which is a “userListId” assigned to a gene list previously added to Enrichr; a string [filename] which will be the name of the downloaded file without the file extension; and a string [backgroundType] which is the name of the library to run enrichment analysis against.
ENRICHR_URL = ‘http://maayanlab.cloud/Enrichr/export’
query_string = ‘?userListId=%s&filename=%s&backgroundType=%s’
user_list_id = 363320
filename = ‘example_enrichment’
gene_set_library = ‘KEGG_2015’

url = ENRICHR_URL + query_string % (user_list_id, filename, gene_set_library)
response = requests.get(url, stream=True)

with open(filename + ‘.txt’, ‘wb’) as f:
  for chunk in response.iter_content(chunk_size=1024):
    if chunk:
      f.write(chunk)
-
11
The output will be a file containing enrichment analysis results similar to the output from Step 4. If the code in the example below were run, the resulting file “example_enrichment.txt” would contain the results of enriching the gene list from Step 2 against the KEGG_2015 library.
Basic Protocol 9
Adding an Enrichr button to a website
Adding an Enrichr button to an external site allows users to directly run enrichment analysis on a gene set from the site, bypassing the steps of downloading the data and then re-uploading to Enrichr. This simplifies multi-step workflows in which enrichment analysis may be performed on an intermediate set of data which has been processed or identified by another application. The button may be added to any existing webpage using a few lines of JavaScript.
Necessary Resources:
Hardware – Desktop or a laptop computer, or a mobile device, with a fast Internet connection
Software – An up-to-date web browser such as Google Chrome (https://www.google.com/chrome/), Mozilla Firefox (https://www.mozilla.org/en-US/firefox/), Apple Safari (https://www.apple.com/safari/), or Microsoft Edge (https://www.microsoft.com/en-us/edge); a text editor or code development environment, such as Visual Studio (https://visualstudio.microsoft.com/downloads/)
Protocol steps and annotations:
-
1
Open the HTML file corresponding to the webpage to which you would like to add the Enrichr button.
Defining an enrichment analysis function
-
2Define a function to hold the Enrichr functionality, which accepts as input a list of gene symbol strings (“list”) and a string description of the list (“description”). These may be properties of a single Javascript object argument, or separate list and string arguments. In the example code below, the function “enrich” accepts an argument “options” containing a “list” property and a “description” property, which are then assigned to local variables inside the function.
function enrich(options) {
  if (typeof options.list === ‘undefined’) {
    alert(‘No genes defined.’);
  }
  var list = options.list
  var description = options.description || ““
…
}
While the input must contain at least a list and a description, advanced users may add additional inputs for other functionality, such as a Boolean argument that returns the results in a pop-up window when set to true. For the purposes of this protocol, only the basic functional steps required to run enrichment analysis are included.
-
3The following steps should all take place inside of the function definition created in Step 2. Create a form object representing an HTML <form> element. Also create two input objects representing HTML <input> elements for the list and description. These objects are the “form”, “listField”, and “descField” variables, respectively.
form = document.createElement(‘form’);
listField = document.createElement(‘input’);
descField = document.createElement(‘input’);
-
4For the form object, set the object attributes as follows: “method” is “post”, “action” is the string URL “http://maayanlab.cloud/Enrichr/enrich”, and “enctype” is “multipart/form-data”.
form.setAttribute(‘method’, ‘post’);
form.setAttribute(‘action’, ‘http://maayanlab.cloud/Enrichr/enrich’);
form.setAttribute(‘enctype’, ‘multipart/form-data’);
-
5For the list input object, set the object attributes as follows: “type” is “hidden”, “name” is “list”, and “value” is the variable or argument containing the input gene list. In the example below, “value” is set to “options.list”, which is the part of the function input containing the gene list. Append the list input object to the form object.
listField.setAttribute(‘type’, ‘hidden’);
listField.setAttribute(‘name’, ‘list’);
listField.setAttribute(‘value’, options.list);
form.appendChild(listField);
-
6For the description input object, set the object attributes as follows: “type” is “hidden”, “name” is “description”, and “value” is the variable or argument containing the input description. In the example code, “value” is set to “description”, a variable containing the input description to the function. Append the description input object to the form object.
descField.setAttribute(‘type’, ‘hidden’);
descField.setAttribute(‘name’, ‘description’);
descField.setAttribute(‘value’, description);
form.appendChild(descField);
-
7As the last few lines in the function created in Step 2, append the form object to either the document or to the page element you would like the form to be attached to. Call the submit() method on the form, then remove the form object from the document or element it was previously appended to.
function enrich(options) {
   …
   document.body.appendChild(form);
   form.submit();
   document.body.removeChild(form);
}
Creating the button
-
8Outside of the function, create an HTML <button> tag to define a new button in the document. Set the “id”, “class”, and other attributes to relevant and uniquely identifiable values of your choosing. You can use HTML tags to label the button with an image, or with text of your choosing. In Geneshot, for example, the button displays the Enrichr logo image (Figure 36).
<button id=‘EnrichrBtn’ class=‘EnrichrBtn’></button>
-
9Use an event handler to attach button clicks to the function defined in Step 2 for calling Enrichr, passing in the required arguments. This will call the enrichment function on the given inputs whenever the button is clicked on the webpage and return the results to the user. For an example of this process using Geneshot, see Protocol 5.
(‘#EnrichrBtn’).click(function(){ enrich({list: genes, description: “My description”}); }) -
10
To understand the Enrichr analysis results, please follow the instructions of Basic Protocol 1 beginning at Step 4.
COMMENTARY
Background Information:
Advances in DNA and RNA sequencing technologies have enabled researchers to routinely incorporate genomic technologies into their studies. However, computational analyses to gain insights from such data often require software tools that can place new results in context of prior biological knowledge. A primary method of analysis for extracting knowledge from genomic studies is gene set enrichment analysis (Subramanian et al., 2005). The essence of enrichment analysis is to query an input gene set against libraries of annotated gene sets to find annotations that are associated with gene sets that statistically significantly overlap with the input gene set. Such enriched terms can be used to explain the biology of the input set, as well as suggest hypotheses for further experimentation. Within this domain, many methods and tools exist. For example, g:Profiler (Reimand et al., 2016), DAVID (Sherman & Lempicki, 2009), ToppGene (Chen et al., 2009), Panther (Mi et al., 2013), GSEA-P (Subramanian et al., 2007), WebGestalt (Zhang et al., 2005), Metascape (Zhou et al., 2019), Gorilla (Eden et al., 2009), ConsensusPathDB (Kamburov et al., 2013), Babelomics (Al-Shahrour et al., 2006), and Enrichr. These tools are widely used, demonstrating the utility and relevance of this approach for many diverse studies.
Critical Parameters:
The gene set libraries within Enrichr are divided into eight distinct categories, which contain a mix of libraries from external databases, as well as original databases created and processed by us. The Transcriptional category contains gene set libraries focused on transcription factors and the transcriptional machinery. The Pathways category includes gene set libraries from well- known pathway databases, as well as a few created from proteomics resources. Gene set libraries in the Ontology category were created from ontology trees including the Gene Ontology (Consortium, 2019), and the human phenotype ontology (HPO) (Köhler et al., 2019). The Disease/Drugs category includes sets of differentially expressed genes from drug-treated vs. untreated cells and tissues, differentially expressed cancer gene set modules, gene sets from GWAS studies and databases, and manually extracted signatures from comparing diseased samples with healthy/normal samples. The Cell Type category contains highly expressed gene signatures from various cells, tissue types, and cancer cell lines. The Miscellaneous category includes gene set libraries that do not meet inclusion criteria for the other categories, such as genes associated with metabolites or chromosomal gene locations. Outdated libraries are placed in the Legacy category to allow users continued access to previous results for reproducibility. Finally, the Crowd category contains gene set libraries created from GEO, representing differentially expressed gene signatures from drug, gene, disease, ligand, and pathogen perturbations. These signatures were extracted from the GEO database via a crowdsourcing project (Wang et al., 2016).
Geneshot (Lachmann et al., 2019) was developed to expand the collection of gene sets that can be analyzed with Enrichr. Users of Geneshot can submit any PubMed search term to receive a ranked list of associated genes with the term. This is achieved by converting returned publications into genes using two reference datasets: GeneRIF and AutoRIF. GeneRIF provides a manually curated list of gene annotations, including gene-publication associations. AutoRIF is an automated method to create a resource that looks like GeneRIF by searching for and collecting gene-publication associations in PubMed. AutoRIF has a larger and more comprehensive database, but is potentially less accurate, compared with GeneRIF. The ARCHS4 (Lachmann et al., 2018) gene-gene co-expression matrix is used to predict gene-search term associations using Spearman’s correlation function. The co-occurrence matrix from Tagger counts the occurrence of associated genes in publication abstracts for pairwise gene-gene similarity. Finally, the co-occurrence matrix from Enrichr examines the composition of gene lists from user-submitted queries.
Enrichr relies on several ranking methods to compute enrichment, which can be chosen by the user. The p-value is calculated with Fisher’s exact test, where genes are considered independent. The q-value is an adjusted p-value calculated using the Benjamini-Hochberg method. The odds ratio ranking method is simply the odds ratio, while the combined score is a multiplication of the odds ratio by the negative natural log of the p-value. It provides a balance between these two methods of ranking.
Troubleshooting:
Table 1.
Sources and Solutions to Potential Errors
| Problem | Possible Cause | Solution |
|---|---|---|
| There may be a delay for results to load on Enrichr. | This may be dependent on the processing speed of your device, the number of users accessing the service at the same time, and the length of the submitted list. | Wait for the results to load or try resubmitting the query at later time. |
| There may be inconsistencies in gene IDs and gene set terms in the Enrichr libraries. | Enrichr libraries are populated by external data sources that may have existing errors. | We strive to ensure that data additions are high quality and from a reputable source and attempt to minimize errors. Please alert us to any issues by submitting a report on GitHub (https://github.com/MaayanLab/enrichr_issues), and we will address it as soon as possible. |
| Images not loading or displaying correctly in the browser. | Since Enrichr uses SVG files to generate images and visualizations, some users may experience browser compatibility issues. Internet Explorer prior to IE9 does not support SVG files, and therefore does not support Enrichr. | Please ensure that your browser is up-to-date or utilize an alternative browser such as Firefox or Chrome. |
| Delayed results or error message from the Enrichment Visualization Appyter. | Heavy traffic or use of the Appyter platform. | The user may choose to re-submit the notebook for execution at later time or download the notebook and re-run it locally. |
ACKNOWLEDGEMENTS:
This work was partially supported by NIH grants U24CA224260 and U54HL127624.
Footnotes
CONFLICT OF INTEREST STATEMENT:
The authors declare no conflicts of interest.
DATA AVAILABILITY STATEMENT:
Data sharing is not applicable to this article as no new data were created or analyzed in this study.
LITERATURE CITED:
- Al-Shahrour F, Minguez P, Tárraga J, Montaner D, Alloza E, Vaquerizas JM, Conde L, Blaschke C, Vera J, & Dopazo J (2006). BABELOMICS: a systems biology perspective in the functional annotation of genome-scale experiments. Nucleic acids research, 34(suppl_2), W472–W476. [DOI] [PMC free article] [PubMed] [Google Scholar]
- Bahcall OG (2015). GTEx pilot quantifies eQTL variation across tissues and individuals. Nature Reviews Genetics, 16(7), 375–375. [DOI] [PubMed] [Google Scholar]
- Bostock M, Ogievetsky V, & Heer J (2011). D3 data-driven documents. IEEE transactions on visualization and computer graphics, 17(12), 2301–2309. [DOI] [PubMed] [Google Scholar]
- Chen EY, Tan CM, Kou Y, Duan Q, Wang Z, Meirelles GV, Clark NR, & Ma’ayan A (2013, April 15). Enrichr: interactive and collaborative HTML5 gene list enrichment analysis tool. BMC bioinformatics, 14, 128. 10.1186/1471-2105-14-128 [DOI] [PMC free article] [PubMed] [Google Scholar]
- Chen J, Bardes EE, Aronow BJ, & Jegga AG (2009). ToppGene Suite for gene list enrichment analysis and candidate gene prioritization. Nucleic acids research, 37(suppl_2), W305–W311. [DOI] [PMC free article] [PubMed] [Google Scholar]
- Consortium G (2019). The gene ontology resource: 20 years and still GOing strong. Nucleic acids research, 47(D1), 39. [DOI] [PMC free article] [PubMed] [Google Scholar]
- Eden E, Navon R, Steinfeld I, Lipson D, & Yakhini Z (2009). GOrilla: a tool for discovery and visualization of enriched GO terms in ranked gene lists. BMC bioinformatics, 10(1), 1–7. [DOI] [PMC free article] [PubMed] [Google Scholar]
- Edgar R, Domrachev M, & Lash AE (2002). Gene Expression Omnibus: NCBI gene expression and hybridization array data repository. Nucleic acids research, 30(1), 207–210. [DOI] [PMC free article] [PubMed] [Google Scholar]
- Fernandez NF, Gundersen GW, Rahman A, Grimes ML, Rikova K, Hornbeck P, & Ma’ayan A (2017). Clustergrammer, a web-based heatmap visualization and analysis tool for high-dimensional biological data. Scientific data, 4, 170151. [DOI] [PMC free article] [PubMed] [Google Scholar]
- Gundersen GW, Jones MR, Rouillard AD, Kou Y, Monteiro CD, Feldmann AS, Hu KS, & Ma’ayan A (2015). GEO2Enrichr: browser extension and server app to extract gene sets from GEO and analyze them for biological functions. Bioinformatics, 31(18), 3060–3062. [DOI] [PMC free article] [PubMed] [Google Scholar]
- Kamburov A, Stelzl U, Lehrach H, & Herwig R (2013). The ConsensusPathDB interaction database: 2013 update. Nucleic acids research, 41(D1), D793–D800. [DOI] [PMC free article] [PubMed] [Google Scholar]
- Köhler S, Carmody L, Vasilevsky N, Jacobsen JOB, Danis D, Gourdine JP, Gargano M, Harris NL, Matentzoglu N, McMurry JA, Osumi-Sutherland D, Cipriani V, Balhoff JP, Conlin T, Blau H, Baynam G, Palmer R, Gratian D, Dawkins H, Segal M, Jansen AC, Muaz A, Chang WH, Bergerson J, Laulederkind SJF, Yüksel Z, Beltran S, Freeman AF, Sergouniotis PI, Durkin D, Storm AL, Hanauer M, Brudno M, Bello SM, Sincan M, Rageth K, Wheeler MT, Oegema R, Lourghi H, Della Rocca MG, Thompson R, Castellanos F, Priest J, Cunningham-Rundles C, Hegde A, Lovering RC, Hajek C, Olry A, Notarangelo L, Similuk M, Zhang XA, Gómez-Andrés D, Lochmüller H, Dollfus H, Rosenzweig S, Marwaha S, Rath A, Sullivan K, Smith C, Milner JD, Leroux D, Boerkoel CF, Klion A, Carter MC, Groza T, Smedley D, Haendel MA, Mungall C, & Robinson PN (2019, January 8). Expansion of the Human Phenotype Ontology (HPO) knowledge base and resources. Nucleic Acids Res, 47(D1), D1018–d1027. 10.1093/nar/gky1105 [DOI] [PMC free article] [PubMed] [Google Scholar]
- Kuleshov MV, Diaz JE, Flamholz ZN, Keenan AB, Lachmann A, Wojciechowicz ML, Cagan RL, & Ma’ayan A (2019). modEnrichr: a suite of gene set enrichment analysis tools for model organisms. Nucleic acids research, 47(W1), W183–W190. [DOI] [PMC free article] [PubMed] [Google Scholar]
- Kuleshov MV, Jones MR, Rouillard AD, Fernandez NF, Duan Q, Wang Z, Koplev S, Jenkins SL, Jagodnik KM, Lachmann A, McDermott MG, Monteiro CD, Gundersen GW, & Ma’ayan A (2016, July 8). Enrichr: a comprehensive gene set enrichment analysis web server 2016 update. Nucleic Acids Res, 44(W1), W90–97. 10.1093/nar/gkw377 [DOI] [PMC free article] [PubMed] [Google Scholar]
- Lachmann A, Schilder BM, Wojciechowicz ML, Torre D, Kuleshov MV, Keenan AB, & Ma’ayan A (2019). Geneshot: search engine for ranking genes from arbitrary text queries. Nucleic acids research, 47(W1), W571–W577. [DOI] [PMC free article] [PubMed] [Google Scholar]
- Lachmann A, Torre D, Keenan AB, Jagodnik KM, Lee HJ, Wang L, Silverstein MC, & Ma’ayan A (2018). Massive mining of publicly available RNA-seq data from human and mouse. Nature communications, 9(1), 1366. [DOI] [PMC free article] [PubMed] [Google Scholar]
- Mi H, Muruganujan A, Casagrande JT, & Thomas PD (2013). Large-scale gene function analysis with the PANTHER classification system. Nature protocols, 8(8), 1551–1566. [DOI] [PMC free article] [PubMed] [Google Scholar]
- Reimand J, Arak T, Adler P, Kolberg L, Reisberg S, Peterson H, & Vilo J (2016). g: Profiler—a web server for functional interpretation of gene lists (2016 update). Nucleic acids research, 44(W1), W83–W89. [DOI] [PMC free article] [PubMed] [Google Scholar]
- Rouillard AD, Gundersen GW, Fernandez NF, Wang Z, Monteiro CD, McDermott MG, & Ma’ayan A (2016). The harmonizome: a collection of processed datasets gathered to serve and mine knowledge about genes and proteins. Database, 2016. [DOI] [PMC free article] [PubMed] [Google Scholar]
- Sherman BT, & Lempicki RA (2009). Systematic and integrative analysis of large gene lists using DAVID bioinformatics resources. Nature protocols, 4(1), 44. [DOI] [PubMed] [Google Scholar]
- Subramanian A, Kuehn H, Gould J, Tamayo P, & Mesirov JP (2007). GSEA-P: a desktop application for Gene Set Enrichment Analysis. Bioinformatics, 23(23), 3251–3253. [DOI] [PubMed] [Google Scholar]
- Subramanian A, Tamayo P, Mootha VK, Mukherjee S, Ebert BL, Gillette MA, Paulovich A, Pomeroy SL, Golub TR, & Lander ES (2005). Gene set enrichment analysis: a knowledge-based approach for interpreting genome-wide expression profiles. Proceedings of the National Academy of Sciences, 102(43), 15545–15550. [DOI] [PMC free article] [PubMed] [Google Scholar]
- Tan CM, Chen EY, Dannenfelser R, Clark NR, & Ma’ayan A (2013). Network2Canvas: network visualization on a canvas with enrichment analysis. Bioinformatics, 29(15), 1872–1878. [DOI] [PMC free article] [PubMed] [Google Scholar]
- Torre D, Lachmann A, & Ma’ayan A (2018). BioJupies: Automated Generation of Interactive Notebooks for RNA-seq Data Analysis in the Cloud. Cell Systems, 7(5), 556–561. [DOI] [PMC free article] [PubMed] [Google Scholar]
- Wang Z, Monteiro CD, Jagodnik KM, Fernandez NF, Gundersen GW, Rouillard AD, Jenkins SL, Feldmann AS, Hu KS, McDermott MG, Duan Q, Clark NR, Jones MR, Kou Y, Goff T, Woodland H, Amaral FMR, Szeto GL, Fuchs O, Schüssler-Fiorenza Rose SM, Sharma S, Schwartz U, Bausela XB, Szymkiewicz M, Maroulis V, Salykin A, Barra CM, Kruth CD, Bongio NJ, Mathur V, Todoric RD, Rubin UE, Malatras A, Fulp CT, Galindo JA, Motiejunaite R, Jüschke C, Dishuck PC, Lahl K, Jafari M, Aibar S, Zaravinos A, Steenhuizen LH, Allison LR, Gamallo P, de Andres Segura F, Dae Devlin T, Pérez-García V, & Ma’ayan A (2016, September 26). Extraction and analysis of signatures from the Gene Expression Omnibus by the crowd. Nat Commun, 7, 12846. 10.1038/ncomms12846 [DOI] [PMC free article] [PubMed] [Google Scholar]
- Wiedemann A, Foucat E, Hocini H, Lefebvre C, Hejblum BP, Durand M, Krüger M, Keita AK, Ayouba A, Mély S, Fernandez JC, Touré A, Fourati S, Lévy-Marchal C, Raoul H, Delaporte E, Koivogui L, Thiébaut R, Lacabaratz C, & Lévy Y (2020, July 24). Long-lasting severe immune dysfunction in Ebola virus disease survivors. Nat Commun, 11(1), 3730. 10.1038/s41467-020-17489-7 [DOI] [PMC free article] [PubMed] [Google Scholar]
- Zhang B, Kirov S, & Snoddy J (2005). WebGestalt: an integrated system for exploring gene sets in various biological contexts. Nucleic acids research, 33(suppl_2), W741–W748. [DOI] [PMC free article] [PubMed] [Google Scholar]
- Zhou Y, Zhou B, Pache L, Chang M, Khodabakhshi AH, Tanaseichuk O, Benner C, & Chanda SK (2019). Metascape provides a biologist-oriented resource for the analysis of systems-level datasets. Nature communications, 10(1), 1–10. [DOI] [PMC free article] [PubMed] [Google Scholar]
KEY REFERENCES:
- Chen EY, Tan CM, Kou Y, Duan Q, Wang Z, Meirelles GV, Clark NR, & Ma’ayan A (2013). Enrichr: interactive and collaborative HTML5 gene list enrichment analysis tool. BMC bioinformatics, 14, 128. 10.1186/1471-2105-14-128. [DOI] [PMC free article] [PubMed] [Google Scholar]
- Clarke DJB, Jeon M, Stein DJ, Moiseyev N, Kropiwnicki E, Dai C, Xie Z, Wojciechowicz ML, Litz S, Hom J, Evangelista JE, Goldman L, Zhang S, Yoon C, Ahamed T, Bhuiyan S, Cheng M, Karam J, Jagodnik JM, Shu I, Lachmann A, Ayling S, Jenkins SL, Ma’ayan A (2021). Appyters: Turning Jupyter Notebooks into Data Driven Web Apps. Patterns (Accepted). [DOI] [PMC free article] [PubMed] [Google Scholar]
- Kuleshov MV, Diaz JE, Flamholz ZN, Keenan AB, Lachmann A, Wojciechowicz ML, Cagan RL, & Ma’ayan A (2019). modEnrichr: a suite of gene set enrichment analysis tools for model organisms. Nucleic acids research, 47(W1), W183–W190. [DOI] [PMC free article] [PubMed] [Google Scholar]
- Kuleshov MV, Jones MR, Rouillard AD, Fernandez NF, Duan Q, Wang Z, Koplev S, Jenkins SL, Jagodnik KM, Lachmann A, McDermott MG, Monteiro CD, Gundersen GW, & Ma’ayan A (2016). Enrichr: a comprehensive gene set enrichment analysis web server 2016 update. Nucleic Acids Res, 44(W1), W90–97. 10.1093/nar/gkw377 [DOI] [PMC free article] [PubMed] [Google Scholar]
- Lachmann A, Schilder BM, Wojciechowicz ML, Torre D, Kuleshov MV, Keenan AB, & Ma’ayan A (2019). Geneshot: search engine for ranking genes from arbitrary text queries. Nucleic acids research, 47(W1), W571–W577. [DOI] [PMC free article] [PubMed] [Google Scholar]
- Lachmann A, Torre D, Keenan AB, Jagodnik KM, Lee HJ, Wang L, Silverstein MC, & Ma’ayan A (2018). Massive mining of publicly available RNA-seq data from human and mouse. Nature communications, 9(1), 1366. [DOI] [PMC free article] [PubMed] [Google Scholar]
- Torre D, Lachmann A, & Ma’ayan A (2018). BioJupies: Automated Generation of Interactive Notebooks for RNA-seq Data Analysis in the Cloud. Cell Systems, 7(5), 556–561. [DOI] [PMC free article] [PubMed] [Google Scholar]


