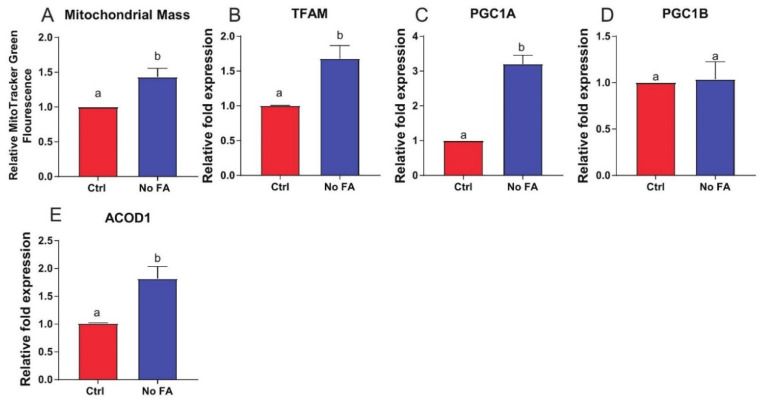
Figure 6.
Mitochondrial response in cultured MDA-MB-231 cells to medium FA withdrawal. MDA-MB-231 cells were cultured with 0 or 2.2 µM FA for 3 weeks prior to assessment of mitochondrial characteristics. Mitochondrial mass determined by MitoTracker Green (n = 3/group) (A). Expression of TFAM (B), PGC1α (C), PGC1ß (D), and ACOD1 (E) determined by qPCR (n = 3/group). Student’s t-test was used to determine statistical significance between groups (p < 0.05), different letters indicate significant differences.

