Abstract
Snoring is a highly prevalent condition associated with obstructive sleep apnea (OSA) and sleep disturbance in bed partners. Objective measurements of snoring in the community, however, are limited. The present study was designed to measure sound levels produced by self-reported habitual snorers in a single night. Snorers were excluded if they reported nocturnal gasping or had severe obesity (BMI > 35 kg/m2). Sound was measured by a monitor mounted 65 cm over the head of the bed on an overnight sleep study. Snoring was defined as sound ≥40 dB(A) during flow limited inspirations. The apnea hypopnea index (AHI) and breath-by-breath peak decibel levels were measured. Snore breaths were tallied to determine the frequency and intensity of snoring. Regression models were used to determine the relationship between objective measures of snoring and OSA (AHI ≥ 5 events/h). The area under the curve (AUC) for the receiver operating characteristic (ROC) was used to predict OSA. Snoring intensity exceeded 45 dB(A) in 66% of the 162 participants studied, with 14% surpassing the 53 dB(A) threshold for noise pollution. Snoring intensity and frequency were independent predictors of OSA. AUCs for snoring intensity and frequency were 77% and 81%, respectively, and increased to 87% and 89%, respectively, with the addition of age and sex as predictors. Snoring represents a source of noise pollution in the bedroom and constitutes an important target for mitigating sound and its adverse effects on bed partners. Precise breath-by-breath identification and quantification of snoring also offers a way to risk stratify otherwise healthy snorers for OSA.
Keywords: habitual snoring, sleep disturbance, sleep apnea, cardiovascular stress
Statement of Significance.
Snoring is a potential source of noise pollution in the bedroom that can degrade the quality of sleep in bed partners and may also be an indicator of obstructive sleep apnea (OSA) in the snorer. Both noise exposure and OSA are known risk factors for adverse health events. Precise characterization of snoring provides a means to identify otherwise healthy habitual snorers at risk for OSA and their bed partners who can have exposure to unhealthy sound levels.
Introduction
Snoring is highly prevalent in the community and reported to be between 20% and 40% of the population [1–3]. As an auditory environmental exposure, it is a potential source of noise pollution that can disturb the sleep of bed partners. It is a form of upper airway obstruction (UAO) that may also be indicative of the presence of obstructive sleep apnea (OSA) in the snorer [4, 5]. Snoring and associated OSA, may have important health consequences for both the bed partner and snorer alike.
Snoring and OSA are recognized risk factors for cardiovascular disease, which may be mitigated by therapy [6]. Similarly, noise pollution in excess of 53 dB(A) has been associated with adverse cardiovascular events [7, 8] in exposed populations. Current evidence suggests that accumulated nocturnal exposure to snoring can thus contribute to the development and/or progression of cardiovascular disease in both the snorer [9] and bed partner. Cardiovascular stress is related to increased sympathetic activation, leading to surges in heart rate and sustained elevations in blood pressure during sleep [10]. Nonetheless, objective measures of snoring severity and its association with OSA have not been well characterized in the general community.
The major goal of this paper was to characterize snoring objectively and its association with OSA in a community sample of self-reported habitual snorers. Recognizing that snoring severity can vary widely, we hypothesized that snoring exceeds standards associated with noise pollution and predicts concomitant OSA. To address this hypothesis, we monitored sound levels objectively in a group of healthy habitual snorers without other OSA symptoms, and quantified snoring frequency and intensity in a single night.
Methods
Study design
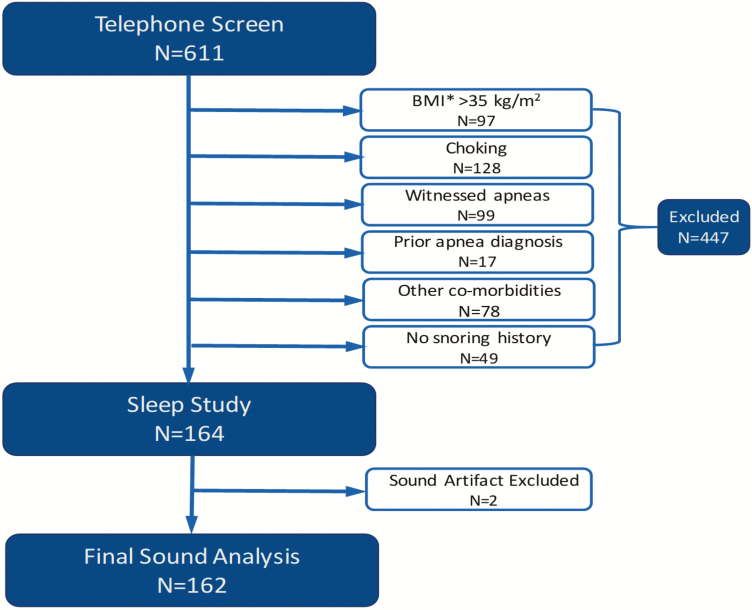
Self-reported snorers were recruited from the communities surrounding the study sites (Johns Hopkins, Baltimore, MD, Neurotrials Research Inc., Atlanta, GA, and Doctors Community Hospital, Lanham, MD) through flyers, advertisements in community newspapers, social media, and brochures made available in participating medical clinics. Six hundred and eleven self-reported snorers were screened by telephone and 447 persons were excluded. Participants with witnessed apneas, gasping/choking and severe obesity were excluded because these factors are well-recognized risk factors for OSA, and in of themselves would represent a sound indication for sleep apnea testing (Figure 1). Those with co-morbidities such as COPD, asthma, emphysema, or chronic bronchitis, a history of heart disease and heart failure, were also excluded because breathing difficulties in these disorders may lead to noisy breathing, for example, wheezing, not related to UAO. Participants were consented into the study, underwent general medical examination and an in-laboratory polysomnography. All studies were conducted in sound attenuated sleep laboratories at all three study sites. Two recordings were excluded due to continuous sound artifact. Sleep staging and respiratory analyses were done using the American Academy of Sleep Medicine (AASM) criteria [11] and OSA was defined as an AHI ≥5 events/h. The study was approved by Institutional Review Boards of all study sites and was registered on www.clinicaltrials.gov (#NCT01949584) [12].
Figure 1.
Study flow chart.
Measurement and analyses of snoring
Self-reported
Participants completed a short survey to evaluate for loud, habitual snoring that bothered bed partners and drove them from the bedroom. Response to survey questions were graded on a five-point Likert scale.
Objective
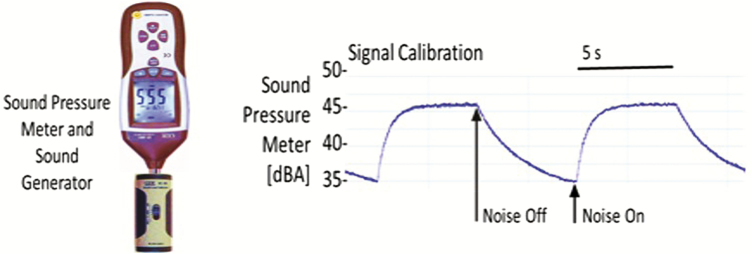
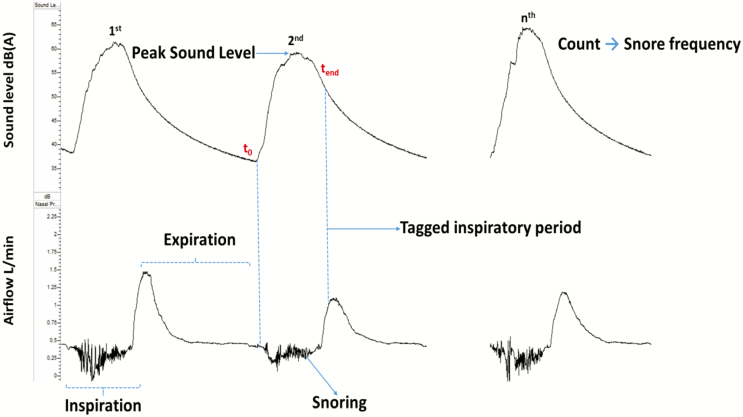
Snoring frequency and intensity were captured with a high-accuracy class 2 digital sound pressure level meter with an accuracy ± 1.4 dB (DT-8851, Ruby Electronics, Saratoga, CA) in adherence with IEC 61672–1 standards. The device was A-frequency weighted with a fast-time response (125 ms), the settings used in most sound monitors. A-frequency weighting ensured that sound captured was within the acoustic and frequency range of human hearing, while the fast-time response determined the speed of sound capture [13–15]. The system was calibrated using an industrial sound level calibrator (SC-05, Reed, Inc., Wilmington, NC) with an accuracy ± 0.5 dB in adherence with IEC 942. A DC analog sound level output of 10 mV/dB was digitized by the RemLogic (Pleasanton, CA) data acquisition system and sound pressure measurements in decibels (dB(A)) were recorded continuously throughout each sleep study and synchronized with the airflow signal. Pink noise was applied for 10-s intervals to calibrate (Figure 2) the sound signal [16, 17]. Sleep studies were conducted in closed sound-attenuated laboratory bedrooms where background ambient noise levels were ≤35 dB(A). The sound pressure level meter was affixed 65 cm above the head position of the bed during the study night to approximate the distance between the head of the bed partner and snorer. We defined snoring as inspiration during sleep with peak sound ≥40 dB(A), given that background ambient sound levels were ≤35 dB(A). Custom software was deployed to identify inspiratory periods on the airflow signal and facilitate the capture of sound during inspiration (Figure 3). Accuracy of inspiration detection was ensured by visually inspecting the airflow channel for all 162 recordings, and manually adjusting the respiratory tags to align with inspiration when necessary.
Figure 2.
Sound meter calibration.
Figure 3.
Snoring sound and airflow characteristics.
To confirm that breaths with inspiratory peak sound ≥40 dB(A) were actually snores, we assessed breaths for other features of UAO during sleep, viz., inspiratory flow limitation (IFL) [5, 18, 19]. Specifically, we formulated a two-step analyses to examine (1) the frequency of IFL in breaths with peak sound ≥40 dB(A) and (2) the association between a key marker of UAO, viz., inspiratory duty cycle and peak sound level as described in the Methods and Results section.
Breaths were randomly analyzed for 3 min samples every 20 min throughout the night from 85 sleep studies, which were evenly drawn from the three study sites. An experienced person was designated to visually identify IFL breaths based on flattening of the inspiratory contour and high frequency oscillations [20, 21]. The scorer was blinded to the sound level signal to prevent bias. A total of 61,739 breaths were sampled from the sleep studies. After IFL scoring, we found that 16,787 of the 61,739 breaths had inspiratory sound level ≥40 dB(A). 94% of these 16,787 breaths met the IFL criteria, suggesting that most breaths with sound ≥40 dB(A) were associated with UAO during sleep. Indeed, a sound threshold of ≥40 dB(A) indicates that the upper airway is dynamically collapsing in the vast majority of breaths during sleep.
The sound level signal was exported from RemLogic in European Data Format (EDF) to MatLab (Natick, MA) [22] for analysis. These data were used to calculate snoring severity metrics including snore latency, frequency and intensity as follows:
Snore latency
Time from sleep onset to the first snore breath.
Snoring frequency
The percentage of inspiratory breaths during sleep with sound peaks ≥40 dB(A).
Snoring intensity (mean peak inspiratory sound)
The maximum sound produced during each inspiration (Figure 3) was first converted from a logarithmic scale (decibels) to a linear scale (Pascals) (Equation). Then the arithmetic mean value for sound pressure level in Pascals was calculated, before reconverting the mean in Pascals to decibels [23]. In the equation below, decibels is denoted as dB(A) and Pascals as Pa.
Equation
Conversion of decibels to Pascals
The calculated mean peak inspiratory sound in decibels was defined as snoring intensity.
Sound threshold for adverse health events
To estimate the proportion of persons that may impose a health risk on their bed partners, we differentiated snorers based on their snoring intensity. We used noise thresholds of 45 and 53 dB(A) which are traffic noise levels known to be associated with sleep disruption and adverse cardiovascular events, respectively [24].
Statistical analyses
To characterize snoring metrics in our population of habitual snorers, we first described the distribution of snoring frequency and intensity at specific thresholds by sleep stage and body position. We examined the prevalence of snoring at intensities ≥45 and ≥53 dB(A), and characterized the association between snoring intensity and frequency using Pearson’s correlation coefficient. The Mann–Whitney’s t-test was used to compare anthropometric, demographic, sleep study, and snore characteristics between sub-groups above and below the snoring intensity threshold of 53 dB(A) and between those with and without OSA. Data are presented as mean ± SD or median (IQR) where appropriate.
The association between snoring severity and OSA was examined in two ways. First, a Fisher exact method was used to test the dependence of OSA on snoring above or below a snoring intensity of 53 dB(A). Second, we used a logistic regression analyses to model the relationship between snoring intensity as a continuous predictor of OSA. The accuracy of the logistic regression model was examined by calculating the area under the curve (AUC) for the receiver operating characteristic (ROC).
For our sample size calculation, we assumed a confidence level of 95% and a 90% probability of success, that is, 10% of respondents who said they snore, would not be objective snorers. All statistical analyses were performed using R and MatLab. Two-tailed p values of less than 0.05 were considered to indicate statistical significance.
Post hoc analysis was performed to examine the association between breath-by-breath peak inspiratory sound and UAO severity. We used a quantifiable surrogate of UAO, the “inspiratory duty cycle,” which is the ratio between inspiratory time and total respiratory time denoted as Ti/TTOT [25, 26]. The Ti/TTOT was estimated with the start and end times of the inspiratory tags described above. The inspiratory duty cycle is usually about one-third of the respiratory period during un-obstructed breathing [25, 26]. In UAO, however, duty cycle increases as a compensatory response that helps maintain ventilation [25, 26]. The association between Ti/TTOT and peak inspiratory sound was examined using a mixed effects linear regression model to account for repeated measures within individuals.
Results
Participant characteristics
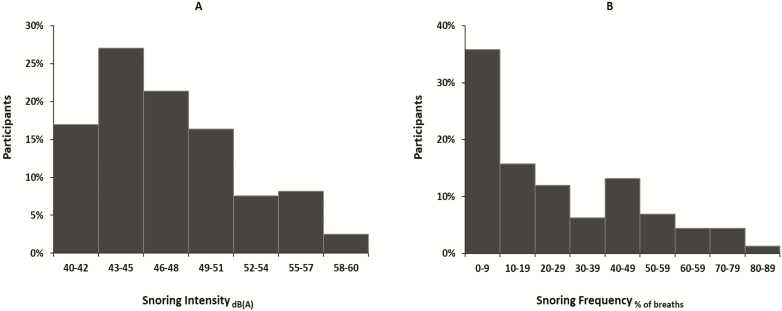
For our population of habitual snorers, the distribution of snore intensity and frequency are presented in Figure 4 and the association between snoring frequency and intensity is included in the supplement. The proportion of persons with snoring intensity ≥45 and ≥53 dB(A) was 66% and 14%, respectively, and the snoring intensity and frequency were correlated (r = 0.71, p < 0.0001, see Supplementary Figure S1). Stratifying the distribution of snoring severity by presence of OSA, we found that snoring severity was a greater proportion in the OSA compared no OSA groups (see Supplementary Figure S2a and b).
Figure 4.
Distribution of snoring intensity and snoring breath frequency.
Anthropometric, demographic and sleep study characteristics are shown in Table 1 for the entire group and for those above and below snoring intensity of 53 dB(A). No significant between-group differences were noted in anthropometry, demographics and sleep architecture except for a reduced sleep latency and increased supine sleep time in the group with snoring intensity ≥53 dB(A). In those with elevated snoring intensity, AHI was greater compared to those with snoring intensity <53 dB(A), resulting from elevations in AI and HI. As expected, self-reported snore scores and snore frequency were significantly higher in persons with snoring intensity ≥53 dB(A), and the latency to snore onset was lower.
Table 1.
Participant characteristics by snoring intensity.
| All | <53 dB(A) | ≥53 dB(A) | p | |
|---|---|---|---|---|
| Demographics | ||||
| Sex (F:M) | 74:88 | 66:74 | 8:14 | 0.46 |
| Age (years) | 47.4 ± 13.9 | 47.6 ± 14.2 | 46.0 ± 12.6 | 0.54 |
| Anthropometrics | ||||
| BMI (kg/m2) | 27.8 ± 4.5 | 27.7 ± 4.7 | 28.3 ± 3.3 | 0.77 |
| Weight (kg) | 181.3 ± 34.7 | 180.3 ± 35.2 | 187.6 ± 31.6 | 0.57 |
| Neck (cm) | 38.2 ± 3.8 | 38.0 ± 3.9 | 39.5 ± 3.1 | 0.05 |
| Waist (cm) | 95.2 ± 11.1 | 94.7 ± 11.2 | 98.8 ± 10.0 | 0.11 |
| Hip (cm) | 106.8 ± 8.8 | 107.0 ± 9.0 | 105.7 ± 7.6 | 0.34 |
| Sleep architecture | ||||
| Total sleep time (min) | 364.3 (328.6–401.1) | 363.1 (329.9–397.6) | 385.7 (328.8–416.5) | 0.27 |
| Sleep efficiency (%) | 85.7 (76.7–91.8) | 85.6 (76.8–91.2) | 88.0 (76.7–93.4) | 0.30 |
| Sleep latency (min) | 5.9 (2.2–13.8) | 7.1 (2.3–14.3) | 3.3 (1.8–9.1) | 0.04 |
| Slow wave sleep (%) | 14.9 (6.2–23.7) | 16.5 (6.6–24.1) | 12.0 (2.4–20.7) | 0.11 |
| Supine sleep (min) | 283.9 (162.5–355.6) | 267.2 (145.7–345.8) | 342.0 (295.1–385.8) | <0.001 |
| AHI and sleepiness | ||||
| ESS | 6.0 (4.0–8.0) | 6.0 (4.0–8.0) | 5.0 (3.0–6.0) | 0.07 |
| AHI (events/h) | 12.8 (5.4–24.1) | 10.5 (4.9–20.0) | 32.6 (14.4–61.0) | <0.001 |
| AI (events/h) | 3.2 (0.7–8.2) | 2.7 (0.6–6.0) | 15.2 (1.5–37.4) | <0.001 |
| HI (events/h) | 10.3 (4.9–17.0) | 8.7 (4.5–16.3) | 14.8 (9.9–23.0) | 0.01 |
| Snore parameters | ||||
| Self-reported snore score | 10.0 (7.0–13.0) | 6.8 (9.0–12.0) | 13.0 (9.3–14.8) | 0.003 |
| Snore latency (min) | 4.1 (1.3–11.5) | 4.5 (1.5–12.5) | 2.0 (0.5–6.5) | 0.02 |
| Snoring frequency (%) | 18.9 (5.8–44.3) | 14.7 (3.8–37.2) | 59.5 (44.3–70.2) | <0.001 |
| Snoring Intensity (dB(A)) | 45.4 (43.2–47.7) | 45.9 (43.7–48.8) | 56.7 (55.2–58.0) | <0.001 |
Data are presented as mean ± SD and median (IQR) as appropriate.
AHI = apnea–hypopnea index, AI = apnea index, ESS = Epworth sleepiness scale, HI = hypopnea index.
Association between snoring and OSA
Anthropometric, demographic, sleep study, and snore characteristics are shown in Table 2 for the entire group and for those with and without OSA. Older persons, males, greater neck, and waist size, but not BMI increased the likelihood of OSA, consistent with link between central adiposity and OSA [3]. As expected, sleep efficiency and slow wave sleep were diminished in the OSA group. In contrast, both groups reported relatively low levels of daytime sleepiness, as reflected by the Epworth sleepiness scores (ESS) in a community rather than sleep clinic population. The latency to snore onset, however, was shorter in OSA vs no OSA groups, and snoring was more frequent and more intense in the OSA population. Nevertheless, participants had similar reports of self-reported snoring regardless of whether they had OSA.
Table 2.
Participant characteristics by presence of OSA
| All | No OSA | OSA | p | |
|---|---|---|---|---|
| Demographics | ||||
| Sex (F:M) | 74:88 | 25:12 | 49:76 | <0.001 |
| Age (years) | 47.4 ± 13.9 | 36.7 ± 11.6 | 50.6 ± 13.0 | <0.001 |
| Anthropometrics | ||||
| BMI (kg/m2) | 27.8 ± 4.5 | 27.6 ± 4.3 | 27.9 ± 4.6 | 0.44 |
| Weight (kg) | 181.3 ± 34.7 | 175.1 ± 32.3 | 183.1 ± 35.3 | 0.13 |
| Neck (cm) | 38.2 ± 3.8 | 36.2 ± 3.1 | 38.7 ± 3.8 | <0.001 |
| Waist (cm) | 95.2 ± 11.1 | 89.2 ± 8.7 | 97.0 ± 11.1 | <0.001 |
| Hip (cm) | 106.8 ± 8.8 | 105.9 ± 10.6 | 107.1 ± 8.3 | 0.72 |
| Sleep architecture | ||||
| Total sleep time (min) | 364.3 (328.6–401.1) | 378.3 (346.3–401.5) | 358.0 (323.0–400.0) | 0.10 |
| Sleep efficiency (%) | 85.7 (76.7–91.8) | 88.3 (82.0–93.5) | 84.8 (75.5–90.9) | 0.02 |
| Sleep latency (min) | 5.9 (2.2–13.8) | 7.4 (2.5–12.9) | 5.5 (2.2–13.8) | 0.98 |
| Slow wave sleep (%) | 14.9 (6.2–23.7) | 23.7 (11.1–28.0) | 13.4 (5.7–22.3) | <0.001 |
| Supine sleep (min) | 283.9 (162.5–355.6) | 309.5 (191.5–362.5) | 268.4 (156.1–344.0) | 0.16 |
| AHI and sleepiness | ||||
| ESS | 6.0 (4.0–8.0) | 5.0 (3.0–8.3) | 6.0 (4.0–8.0) | 0.43 |
| AHI (events/h) | 12.8 (5.4–24.1) | 2.4 (1.4–4.0) | 15.6 (9.0–29.9) | <0.001 |
| AI (events/h) | 3.2 (0.7–8.2) | 0.4 (0.2–0.9) | 4.6 (1.7–12.9) | <0.001 |
| HI (events/h) | 10.3 (4.9–17.0) | 2.3 (1.1–4.8) | 13.7 (7.9–19.7) | <0.001 |
| Snore parameters | ||||
| Self-reported snore score | 10.0 (7.0–13.0) | 9.0 (5.0–12.0) | 10.0 (7.0–13.0) | 0.13 |
| Snore latency (min) | 4.1 (1.3–11.5) | 11.5 (3.6–21.2) | 3.4 (0.9–7.7) | <0.001 |
| Snoring frequency (%) | 18.9 (5.8–44.3) | 3.3 (0.4–9.0) | 23.6 (10.1–46.9) | <0.001 |
| Snoring intensity (dB(A)) | 45.4 (43.2–47.7) | 43.0 (41.8–46.0) | 48.1 (45.0–51.7) | <0.001 |
Data is presented as mean ± SD and median (IQR) as appropriate.
AHI = apnea–hypopnea index, AI = apnea index, ESS = Epworth sleepiness scale, HI = hypopnea index.
Modeling the association between measures of snoring severity and OSA
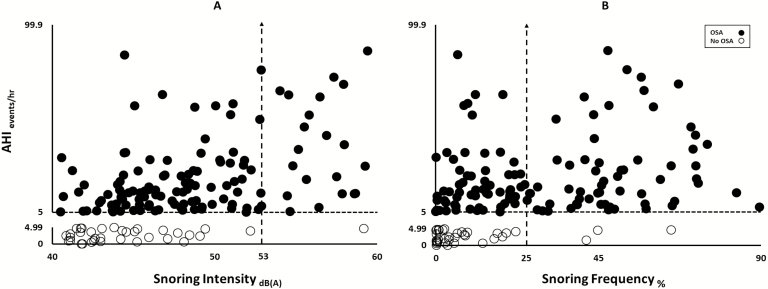
The relationship between AHI and measures of snoring severity for participants with and without OSA is illustrated in Figure 5. We observed that persons without OSA had a snoring intensity below 53 dB(A) and all but one with snoring intensity ≥53 dB(A) had OSA (Panel A). Similarly, persons without OSA had a snoring frequency below 25% and all but three persons with frequency >25% had OSA (Panel B). OSA severity was associated with snoring intensity and frequency (r2 of 0.23 p < 0.0001 and r2 of 0.11 p < 0.0001, respectively).
Figure 5.
Scatter plot of objective snoring metrics vs OSA severity.
We confirmed that the presence of OSA was dependent on snoring intensity and frequency (see Fischer exact tests,Supplementary Table S1), suggesting that snoring sound levels conferred greater likelihood of having OSA. The univariate logistic regression models revealed that snoring intensity and frequency were associated with the presence of OSA. These relationships were strengthened after incorporating age and sex in the models (see Tables 3 and 4).
Table 3.
Odds ratios of the univariate logistic regression models
| Outcome: OSA | Odds ratios (95% CI) | p |
|---|---|---|
| Model A | ||
| Snoring intensity | 1.296 (1.146–1.467) | <0.0001 |
| Model B | ||
| Snoring frequency | 1.071 (1.036–1.106) | <0.0001 |
Table 4.
Adjusted odds ratios of the multivariate logistic regression models
| Outcome: OSA | Adjusted odds ratios (95% CI) | p |
|---|---|---|
| Model C | ||
| Snoring Intensity | 1.23 (1.09–1.40) | 0.001 |
| Age | 1.10 (1.05–1.14) | <0.0001 |
| Sex | 3.10 (1.13–8.54) | 0.028 |
| Model D | ||
| Snoring frequency | 1.06 (1.03–1.10) | 0.000 |
| Age | 1.10 (1.05–1.14) | <0.0001 |
| Sex | 3.91 (1.38–11.05) | 0.010 |
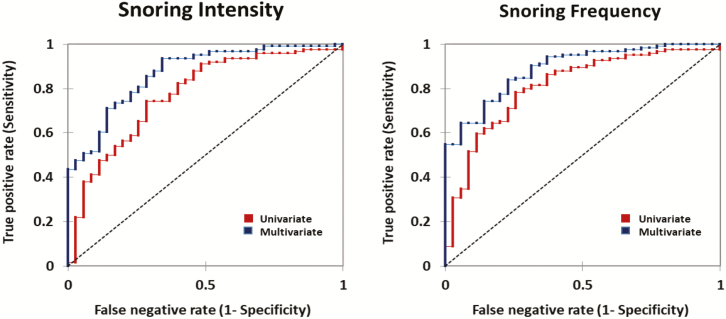
The ROC curves for snoring intensity and frequency are shown in Figure 6 with and without age and sex as predictors of OSA. Measures of snoring severity yielded AUCs that were substantially greater than chance alone (see dashed diagonal line). AUCs increased with the addition of age and sex as predictors of OSA.
Figure 6.
AUCs for the ROC curves of snoring intensity and frequency with and without age and sex as predictors. The AUCs were 77% (p < .0001), 87% (p < .0001), and 81% (p < .0001), 89% (p < .0001) for the univariate and multivariate models of snoring intensity and snoring frequency respectively.
Association between peak inspiratory sound and UAO severity
In our post hoc analysis, the linear mixed effects regression model demonstrated (1) a positive association (see Supplementary Table S2) between peak inspiratory sound and Ti/TTOT, indicating that sound production was tightly linked to the severity of UAO during sleep. In addition, our multivariate model accounted for differences in peak inspiratory sound by sleep stage and body position, and demonstrated (2) the highest peak inspiratory sound during N3 sleep in the supine position. Relative to supine N3 sleep, (3) N1, N2, REM, and non-supine sleep were associated with reductions in peak inspiratory sound (see Supplementary Table S2). This finding together with the fact that the studies were done in sound attenuated laboratories, indicate that phasic peak inspiratory sounds ≥40 dB(A) are emblematic of UAO during sleep.
Discussion
This study generated several novel findings that characterized overnight snoring objectively relative to noise pollution standards. First, snoring severity can be characterized by its frequency and intensity, which are well correlated. Second, more than half of our self-reported habitual snorers produced sound levels that exceeded noise thresholds for sleep disturbance, with some who actually surpassed the noise thresholds associated with adverse cardiovascular events [27, 28]. Third, despite the fact that our habitual snorers were asymptomatic, they still demonstrated a high prevalence of OSA. Fourth, self-reported habitual snoring spans a spectrum from negligible to severe noise production throughout the night. Finally, both snoring frequency and intensity predicted the presence of OSA and accuracy improved even further when age and sex were incorporated in the models. These findings suggest that objective measures of habitual snoring constitute a health risk for both snorers and bed partners alike, and that strategies to reduce the snoring impacts can decrease the risk of adverse health consequences.
Snore exposure as noise pollution
Snoring is a potential form of noise pollution with attendant health consequences. Using accepted methods for quantifying noise exposure, we characterized the intensity and frequency of nocturnal snoring among a group of habitual snorers without overt symptoms of OSA. On a single study night, a substantial proportion of these snorers produced sound levels that exceeded the thresholds for nocturnal noise pollution. Specifically, the World Health Organization (WHO) guidelines and empiric data caution [29] that sleep disruption commonly occurs at sound levels greater than 45 dB(A) [30, 31], which we found in 66% of our cohort. Further increases in sound intensity from road traffic exceeding a 53 dB(A) threshold have been associated with adverse cardiovascular events [27, 28] possibly due to surges in sympathetic activity [10, 32]. We found that measurements of snoring frequency correlated well with calibrated measures of snoring intensity, suggesting that commonly available measures of snoring frequency (i.e. phone applications) may offer reasonable surrogates for bedroom noise pollution. Of note, objective sound recordings in our study indicated little to no snoring in approximately 35% of our cohort (Figure 4B). In those without objective snoring, therapeutic efforts can be redirected to focus on identifying a primary sleep disturbance in the bed partner rather than noise pollution from the putative snorer per se. Nonetheless, our findings indicate that bed partners of habitual snorers are exposed to noise at or above thresholds for a healthy environment, putting them at risk for chronic sleep disturbance and adverse health effects.
Objective snoring and OSA
Even after excluding participants with overt symptoms of OSA, we still found a high prevalence of this disorder in otherwise asymptomatic habitual snorers. This finding is consistent with previous epidemiologic studies that demonstrated a similarly high prevalence in the general population [3, 33]. Epidemiologic risk factors for OSA including age, male sex and BMI are known to increase pharyngeal collapsibility in humans and animal models [34, 35]. The present study demonstrates that objective snoring is associated with OSA severity, suggesting that snoring is a surrogate for marked elevations in airway collapsibility during sleep [5, 36]. Nonetheless, we acknowledge that symptomatic OSA confers greater cardiovascular risk than asymptomatic OSA, particularly in those with relatively mild disease. The present study documents strong associations between snoring severity and OSA, suggesting that health risks be taken seriously in loud snorers. Health risks may be due to nocturnal hemodynamic stresses resulting from intermittent hypoxia, recurrent arousals and widening pleural pressure swings [37, 38] during periods of UAO.
Several lines of evidence suggest that snoring can predict the presence of OSA from the data in the present study population. First, we demonstrated that OSA was dependent on snoring severity using the Fischer exact test. Specifically, the Fischer exact tests showed that snoring intensity ≥53 dB(A) and snoring frequency ≥25% were both significantly associated with the presence of OSA in our population. Second, we accounted for potential covariates of this relationship including age and sex by applying a multivariate regression logistic model to predict the presence of OSA based on snoring severity, and found that snoring intensity and frequency were independent predictors of the presence of OSA. Third, having demonstrated significant odds of OSA in logistic models, we generated ROC curves to determine the accuracy in classifying (diagnosing) participants from snoring parameters. The ROC curves discriminated those with and without OSA with a high degree of accuracy. Taken together, multiple lines of evidence offer a compelling case for using snoring to predict OSA.
Limitations
A few limitations should be considered when interpreting our results. First, the decibel meter was placed vertically above the pillow. Participants who slept supine may appear to produce louder snores compared to those who slept on their side, leading to an underestimation of snore intensity in these participants. Second, in calculating snoring intensity, we only used the sound data points associated with inspiration. Sound decay during the ensuing expiratory period or expiratory snoring was not included given our definition of snoring for this project, which have led us to underestimate overall noise pollution. Third, a pertinent factor for the perceived sound level is the distance from the noise source. In this study, sound meters were placed at 25.5 inches (65 cm) above the pillow. Halving the distance would increase perceived sound levels by 6 dB (A) [23] and vice versa. Fourth, although the snoring intensity was related to snore frequency (see Supplementary Figure S1), it does not account for the temporal distribution of snore exposure. For example, a snorer with 30% snore breaths would produce approximately 2000 snore sounds over the course of the night. The snores could either be equally spaced or clustered. It remains unclear if the temporal distribution of snoring plays a role for adverse health effects. Fifth, we acknowledge that night to night variability in snoring severity may introduce some inaccuracies in our objective snoring measurement in a single night. Finally, our current semi-automated procedure for detecting inspiration and characterizing breath-by-breath snoring is painstaking and time consuming. To streamline this process, structured development and cross validation of the custom algorithm are required, especially if the process is to become fully automated.
Implications
Objective measurements suggest that snoring is a significant environmental noise pollutant with potential implications for public and personal health in snorers and bed partners alike. First, objective measures of snoring severity constitute a strong predictor for concomitant OSA after adjusting for risk factors such as age and sex. Increased availability of home-based assessments of snoring can facilitate OSA screening strategies in the community at large, although further work will be required to account for ambient domiciliary noise, and to standardize and streamline the process of accurately characterizing inspiratory snoring for the purpose of OSA screening. Second, in those who do not have objective evidence of snoring, self-reported snoring may reflect an underlying discord or a primary sleep disturbance in the bed partner, and offer a cautionary note in snoring management. Finally, sleep disruption leading to intermittent surges in sympathetic activity and elevations in blood pressure has been suggested as a potential mechanism for noise-induced cardiovascular morbidity [32]. Implementing WHO paradigms for examining health consequences of noise pollution, we can envision strategies to elucidate dose–response relationships between snoring and markers of cardiovascular stress, as well as long-term adverse health events.
Funding
This study was sponsored by inSleep Health with technical support from Jorge Jimenez, Huy Pho, Rafael Arias, and the Johns Hopkins Center for Interdisciplinary Sleep Research and Education (CISRE).
Conflict of interest statement. None declared.
Supplementary Material
References
- 1. Ohayon MM, et al. Snoring and breathing pauses during sleep: telephone interview survey of a United Kingdom population sample. BMJ. 1997;314(7084):860–863. [DOI] [PMC free article] [PubMed] [Google Scholar]
- 2. Stoohs RA, et al. Normative data on snoring: a comparison between younger and older adults. Eur Respir J. 1998;11(2):451–457. [DOI] [PubMed] [Google Scholar]
- 3. Young T, et al. The occurrence of sleep-disordered breathing among middle-aged adults. N Engl J Med. 1993;328(17):1230–1235. [DOI] [PubMed] [Google Scholar]
- 4. Myers KA, et al. Does this patient have obstructive sleep apnea?: The Rational Clinical Examination systematic review. JAMA. 2013;310(7):731–741. [DOI] [PubMed] [Google Scholar]
- 5. Gleadhill IC, et al. Upper airway collapsibility in snorers and in patients with obstructive hypopnea and apnea. Am Rev Respir Dis. 1991;143(6):1300–1303. [DOI] [PubMed] [Google Scholar]
- 6. Naughton MT. The link between obstructive sleep apnea and heart failure: underappreciated opportunity for treatment. Curr Cardiol Rep. 2005;7(3):211–215. [DOI] [PubMed] [Google Scholar]
- 7. Sørensen M, et al. Road traffic noise and incident myocardial infarction: a prospective cohort study. PLoS One. 2012;7(6):e39283. [DOI] [PMC free article] [PubMed] [Google Scholar]
- 8. Babisch W, et al. Traffic noise and cardiovascular risk: the Caerphilly and Speedwell studies, third phase–10-year follow up. Arch Environ Health. 1999;54(3):210–216. [DOI] [PubMed] [Google Scholar]
- 9. Cho JG, et al. Tissue vibration induces carotid artery endothelial dysfunction: a mechanism linking snoring and carotid atherosclerosis? Sleep. 2011;34(6): 751–757. [DOI] [PMC free article] [PubMed] [Google Scholar]
- 10. Ha J, et al. The magnitude of mortality from Ischemic Heart Disease attributed to occupational factors in Korea—Attributable fraction estimation using meta-analysis. Saf Health Work. 2011;2(1):70–82. [DOI] [PMC free article] [PubMed] [Google Scholar]
- 11. The AASM Manual for the Scoring of Sleep and Associated Events (Version 2.3). Darien, IL: American Academy of Sleep Medicine. [Google Scholar]
- 12. Guzman MA, et al. The efficacy of low-level continuous positive airway pressure for the treatment of snoring. J Clin Sleep Med. 2017;13(5):703–711. [DOI] [PMC free article] [PubMed] [Google Scholar]
- 13. Bauer B, et al. Researches in loudness measurement. IEEE Trans Audio Electroacoust. 1966;14(3):141–151. [Google Scholar]
- 14. Occupational Safety and Health Administration. Noise. Updated: August 15, 2013. https://www.osha.gov/dts/osta/otm/new_noise/#whatisnoise. Accessed October 18, 2019.
- 15. International Standard IEC61672-1. Electroacoustics and Sound Level Meters. 1st ed., 2002–05. Geneva, Switzerland: International Electrotechnical Commission. 2002. [Google Scholar]
- 16. Keshner MS. 1/f noise. Proc IEEE. 1982;70(3):212–218. [Google Scholar]
- 17. Liu ZS, et al. Snoring source identification and snoring noise prediction. J Biomech. 2007;40(4):861–870. [DOI] [PubMed] [Google Scholar]
- 18. Aittokallio T, et al. Analysis of inspiratory flow shapes in patients with partial upper-airway obstruction during sleep. Chest. 2001;119(1):37–44. [DOI] [PubMed] [Google Scholar]
- 19. Mann DL, et al. Quantifying the magnitude of pharyngeal obstruction during sleep using airflow shape. Eur Respir J. 2019;54(1):pii:1802262. [DOI] [PMC free article] [PubMed] [Google Scholar]
- 20. Palombini LO, et al. Inspiratory flow limitation in a normal population of adults in São Paulo, Brazil. Sleep. 2013;36(11):1663–1668. [DOI] [PMC free article] [PubMed] [Google Scholar]
- 21. Bourjeily G, et al. Airflow limitations in pregnant women suspected of sleep-disordered breathing. Sleep Med. 2014;15(5):550–555. [DOI] [PubMed] [Google Scholar]
- 22. Bob K, et al. A simple format for exchange of digitized polygraphic recordings. Electroencephalogr Clin Neurophysiol. 1992;82(5):391–393. [DOI] [PubMed] [Google Scholar]
- 23. Kinsler LE, et al. Fundamentals of Acoustics. 4th ed. Somerset, NJ: Wiley; December 1999. [Google Scholar]
- 24.WHO. Environmental noise guidelines for the European region. 2019. http://www.euro.who.int/__data/assets/pdf_file/0008/383921/noise-guidelines-eng.pdf?ua=1 . Accessed October 25, 2018. [Google Scholar]
- 25. Schneider H, et al. Inspiratory duty cycle responses to flow limitation predict nocturnal hypoventilation. Eur Respir J. 2009;33(5):1068–1076. [DOI] [PubMed] [Google Scholar]
- 26. Mansour KF, et al. Noninvasive determination of upper airway resistance and flow limitation. J Appl Physiol. 1985;97(5):1840–1848. [DOI] [PubMed] [Google Scholar]
- 27. Sørensen M, et al. Exposure to road traffic and railway noise and associations with blood pressure and self-reported hypertension: a cohort study. Environ Health. 2011;10:92. [DOI] [PMC free article] [PubMed] [Google Scholar]
- 28. Gan WQ, et al. Association of long-term exposure to community noise and traffic-related air pollution with coronary heart disease mortality. Am J Epidemiol. 2012;175(9):898–906. [DOI] [PubMed] [Google Scholar]
- 29. Buxton OM, et al. Sleep disruption due to hospital noises: a prospective evaluation. Ann Intern Med. 2012;157(3):170–179. [DOI] [PubMed] [Google Scholar]
- 30. Basner M, et al. WHO environmental noise guidelines for the European region: a systematic review on environmental noise and effects on sleep. Int J Environ Res Public Health. 2018;15(3):519. [DOI] [PMC free article] [PubMed] [Google Scholar]
- 31. Bodin T, et al. Annoyance, sleep and concentration problems due to combined traffic noise and the benefit of quiet side. Int J Environ Res Public Health. 2015;12(2):1612–1628. [DOI] [PMC free article] [PubMed] [Google Scholar]
- 32. Münzel T, et al. Environmental noise and the cardiovascular system. J Am Coll Cardiol. 2018;71(6):688–697. [DOI] [PubMed] [Google Scholar]
- 33. Heinzer R, et al. HypnoLaus sleep cohort study. Rev Med Suisse. 2011;7(315):2137–2138, 2140–1. [PubMed] [Google Scholar]
- 34. Kirkness JP, et al. Contribution of male sex, age, and obesity to mechanical instability of the upper airway during sleep. J Appl Physiol (1985). 2008;104(6):1618–1624. [DOI] [PMC free article] [PubMed] [Google Scholar]
- 35. Polotsky M, et al. Effect of age and weight on upper airway function in a mouse model. J Appl Physiol (1985). 2011;111(3):696–703. [DOI] [PMC free article] [PubMed] [Google Scholar]
- 36. Gold AR, et al. The pharyngeal critical pressure. The whys and hows of using nasal continuous positive airway pressure diagnostically. Chest. 1996;110(4):1077–1088. [DOI] [PubMed] [Google Scholar]
- 37. Ryan S. Mechanisms of cardiovascular disease in obstructive sleep apnoea. J Thorac Dis. 2018;10(Suppl 34): S4201–S4211. [DOI] [PMC free article] [PubMed] [Google Scholar]
- 38. Stoohs R, et al. Cardiovascular changes associated with obstructive sleep apnea syndrome. J Appl Physiol (1985). 1992;72(2):583–589. [DOI] [PubMed] [Google Scholar]
Associated Data
This section collects any data citations, data availability statements, or supplementary materials included in this article.


