

Abstract
Background
Self‐administered survey questionnaires are an important data collection tool in clinical practice, public health research and epidemiology. They are ideal for achieving a wide geographic coverage of the target population, dealing with sensitive topics and are less resource‐intensive than other data collection methods. These survey questionnaires can be delivered electronically, which can maximise the scalability and speed of data collection while reducing cost. In recent years, the use of apps running on consumer smart devices (i.e., smartphones and tablets) for this purpose has received considerable attention. However, variation in the mode of delivering a survey questionnaire could affect the quality of the responses collected.
Objectives
To assess the impact that smartphone and tablet apps as a delivery mode have on the quality of survey questionnaire responses compared to any other alternative delivery mode: paper, laptop computer, tablet computer (manufactured before 2007), short message service (SMS) and plastic objects.
Search methods
We searched MEDLINE, EMBASE, PsycINFO, IEEEXplore, Web of Science, CABI: CAB Abstracts, Current Contents Connect, ACM Digital, ERIC, Sociological Abstracts, Health Management Information Consortium, the Campbell Library and CENTRAL. We also searched registers of current and ongoing clinical trials such as ClinicalTrials.gov and the World Health Organization (WHO) International Clinical Trials Registry Platform. We also searched the grey literature in OpenGrey, Mobile Active and ProQuest Dissertation & Theses. Lastly, we searched Google Scholar and the reference lists of included studies and relevant systematic reviews. We performed all searches up to 12 and 13 April 2015.
Selection criteria
We included parallel randomised controlled trials (RCTs), crossover trials and paired repeated measures studies that compared the electronic delivery of self‐administered survey questionnaires via a smartphone or tablet app with any other delivery mode. We included data obtained from participants completing health‐related self‐administered survey questionnaire, both validated and non‐validated. We also included data offered by both healthy volunteers and by those with any clinical diagnosis. We included studies that reported any of the following outcomes: data equivalence; data accuracy; data completeness; response rates; differences in the time taken to complete a survey questionnaire; differences in respondent's adherence to the original sampling protocol; and acceptability to respondents of the delivery mode. We included studies that were published in 2007 or after, as devices that became available during this time are compatible with the mobile operating system (OS) framework that focuses on apps.
Data collection and analysis
Two review authors independently extracted data from the included studies using a standardised form created for this systematic review in REDCap. They then compared their forms to reach consensus. Through an initial systematic mapping on the included studies, we identified two settings in which survey completion took place: controlled and uncontrolled. These settings differed in terms of (i) the location where surveys were completed, (ii) the frequency and intensity of sampling protocols, and (iii) the level of control over potential confounders (e.g., type of technology, level of help offered to respondents). We conducted a narrative synthesis of the evidence because a meta‐analysis was not appropriate due to high levels of clinical and methodological diversity. We reported our findings for each outcome according to the setting in which the studies were conducted.
Main results
We included 14 studies (15 records) with a total of 2275 participants; although we included only 2272 participants in the final analyses as there were missing data for three participants from one included study.
Regarding data equivalence, in both controlled and uncontrolled settings, the included studies found no significant differences in the mean overall scores between apps and other delivery modes, and that all correlation coefficients exceeded the recommended thresholds for data equivalence. Concerning the time taken to complete a survey questionnaire in a controlled setting, one study found that an app was faster than paper, whereas the other study did not find a significant difference between the two delivery modes. In an uncontrolled setting, one study found that an app was faster than SMS. Data completeness and adherence to sampling protocols were only reported in uncontrolled settings. Regarding the former, an app was found to result in more complete records than paper, and in significantly more data entries than an SMS‐based survey questionnaire. Regarding adherence to the sampling protocol, apps may be better than paper but no different from SMS. We identified multiple definitions of acceptability to respondents, with inconclusive results: preference; ease of use; willingness to use a delivery mode; satisfaction; effectiveness of the system informativeness; perceived time taken to complete the survey questionnaire; perceived benefit of a delivery mode; perceived usefulness of a delivery mode; perceived ability to complete a survey questionnaire; maximum length of time that participants would be willing to use a delivery mode; and reactivity to the delivery mode and its successful integration into respondents' daily routine. Finally, regardless of the study setting, none of the included studies reported data accuracy or response rates.
Authors' conclusions
Our results, based on a narrative synthesis of the evidence, suggest that apps might not affect data equivalence as long as the intended clinical application of the survey questionnaire, its intended frequency of administration and the setting in which it was validated remain unchanged. There were no data on data accuracy or response rates, and findings on the time taken to complete a self‐administered survey questionnaire were contradictory. Furthermore, although apps might improve data completeness, there is not enough evidence to assess their impact on adherence to sampling protocols. None of the included studies assessed how elements of user interaction design, survey questionnaire design and intervention design might influence mode effects. Those conducting research in public health and epidemiology should not assume that mode effects relevant to other delivery modes apply to apps running on consumer smart devices. Those conducting methodological research might wish to explore the issues highlighted by this systematic review.
Keywords: Humans, Cell Phone, Cell Phone/statistics & numerical data, Data Accuracy, Minicomputers, Minicomputers/statistics & numerical data, Mobile Applications, Mobile Applications/statistics & numerical data, Surveys and Questionnaires, Surveys and Questionnaires/standards, Text Messaging, Text Messaging/statistics & numerical data, Time Factors
Plain language summary
Can apps be used for the delivery of survey questionnaires in public health and clinical research?
Background
Survey questionnaires are important tools in public health and clinical research as they offer a convenient way of collecting data from a large number of respondents, dealing with sensitive topics, and are less resource intensive than other data collection techniques. The delivery of survey questionnaires via apps running on smartphones or tablets could maximise the scalability and speed of data collection offered by these tools, whilst reducing costs. However, before this technology becomes widely adopted, we need to understand how it could affect the quality of the responses collected. Particularly, if we consider the impact that data quality can have on the evidence base that supports many public health and healthcare decisions.
Objective
In this Cochrane review, we assessed the impact that using apps to deliver a survey can have on various aspects of the quality of responses. These include response rates, data accuracy, data completeness, time taken to complete a survey questionnaire, and acceptability to respondents.
Methods and results
We searched for studies published between January 2007 and April 2015. We included 14 studies and analysed data from 2272 participants. We did not conduct a meta‐analysis because of differences across the studies. Instead, we describe the results of each study. The studies took place in two types of setting: controlled and uncontrolled. The former refers to research or clinical environments in which healthcare practitioners or researchers were able to better control for potential confounders, such as the location and time of day in which surveys were completed, the type of technology used and the level of help available to respondents deal with technical difficulties. Uncontrolled settings refer to locations outside these research or clinical environments (e.g., the respondent's home). We found that apps may be equivalent to other delivery modes such as paper, laptops and SMS in both settings. It is unclear if apps could result in faster completion times than other delivery modes. Instead, our findings suggest that factors such as the characteristics of the clinical population, and survey and interface design could moderate the effect on this outcome. Data completeness and adherence to sampling protocols were only reported in uncontrolled settings. Our results indicate that apps may result in more complete datasets, and may improve adherence to sampling protocols compared to paper but not to SMS. There were multiple definitions of acceptability to respondents, which could not be standardised across the included studies. Lastly, none of the included studies reported on response rates or data accuracy.
Conclusion
Overall, there is not enough evidence to make clear recommendations about the impact that apps may have on survey questionnaire responses. Data equivalence may not be affected as long as the intended clinical application of a survey questionnaire and its intended frequency of administration is the same whether or not apps are used. Future research may need to consider how the design of the user interaction, survey questionnaire and intervention may affect data equivalence and the other outcomes evaluated in this review.
Background
Description of the problem or issue
Quantitative survey methods are commonly used in public health research and epidemiology as they enable the collection, through survey questionnaires, of highly structured data that are standardised across collection sites and research studies (Bowling 2005; Boynton 2004; Carter 2000; Groves 2009; Hosking 1995). These data can then be used to make statistical inferences about the population from which the sample of respondents is drawn. As such, these techniques have become the basis of evidence in public health policy development and intervention design. For this reason, careful consideration of the data collection mode is needed to ensure the quality of the data. In this Cochrane review we define quality in relation to survey error: both measurement error (discrepancies between survey questionnaire responses and the true value of the attribute under study) and representational error (discrepancies between statistics estimated on a sample and the estimates of the target population) (Groves 2009; Lavrakas 2008).
Data collection mode refers to variation in several aspects of the survey process, namely sampling of and contact with potential respondents, delivery of the survey questionnaire and administration of the survey questionnaire (Bowling 2005; Lavrakas 2008). Regarding the latter, survey questionnaires can be self‐administered or interview administered (Carter 2000). While both approaches have their merits, self administration is usually preferred. Self‐administered survey questionnaires are ideal for achieving a wide geographic coverage of the target population, dealing with sensitive topics and are typically less resource‐intensive than interviews (Bowling 2005; Bowling 2009; Carter 2000; Gwaltney 2008). To further leverage these benefits of maximising scalability and speed of data collection while reducing cost, the electronic delivery of self‐administered survey questionnaires has received considerable attention (Groves 2009; Lampe 1998; Lane 2006; Shih 2009).
Electronic modes of delivery have become commonplace in several research areas such as pain, asthma, tobacco use and smoking cessation (Lane 2006). These modes can vary in the type and degree of technology (e.g., devices and their technical specifications) used to deliver self‐administered survey questionnaires, the channels (i.e., visual or auditory) through which questions and response options are presented to respondents, and in the data entry formats that are supported (Bowling 2005; Groves 2009; Gwaltney 2008; Tourangeau 2000). However, survey questionnaire responses are the product of a complex interaction between the survey questionnaire, the respondent and the delivery mode. Therefore, variation in any of the properties of an electronic delivery mode may introduce some form of survey error or bias (i.e., mode effect) (Bowling 2005; Carter 2000; Coons 2009; Fan 2010; Manfreda 2008; Tourangeau 2000; Wells 2014).
Delivery modes could affect the type of responses given to a survey questionnaire (i.e., measurement error), which can manifest itself as differences in estimates, social desirability bias, acquiescence or extremeness bias, recall effects or response order effects (i.e., primacy and recency effects) (Bowling 2005; Groves 2009). Responses collected via electronic delivery modes, such as computers and personal digital assistants (PDA), have been found to be more accurate, timely and equivalent to those obtained with paper survey questionnaires (Gwaltney 2008; Lane 2006). The evidence concerning recall effects or social desirability bias has been inconclusive (Bowling 2005). Furthermore, primacy effects are more prevalent when response options are presented visually (e.g., in web surveys), whereas recency effects are more common if the options are presented aurally (e.g., using interaction voice response (IVR] systems) (Groves 2009; Lavrakas 2008).
Changes to the delivery mode could also result in representational errors, which are usually defined in terms of sampling error, coverage error and non‐response error (Lavrakas 2008). Compared to other delivery modes (e.g., mail, fax, email, telephone and interactive voice response), web surveys can result in a drop of between 10% and 20% in response rates (Manfreda 2008; Shih 2009). However, this effect is mediated by the content and presentation of the survey questionnaire, sampling methods, type and number of invitations sent, access to technology and (in the case of web surveys) the stage of the survey questionnaire process (Bowling 2005; Fan 2010; Manfreda 2008; Shih 2009). Adherence to sampling protocols appears to be enhanced when using electronic survey questionnaires (Gwaltney 2008; Lane 2006). Additionally, electronic delivery modes tend to result in higher item response rates than paper (Bowling 2005).
Nonetheless, delivery mode effects tend to be mode‐specific, thus it should not be assumed that lessons from one mode will apply to all others (Wells 2014). While these effects have been documented for traditional electronic delivery modes (Bowling 2005; Coons 2009; Fan 2010; Gwaltney 2008; Lane 2006), they have not been systematically assessed for current consumer smart devices that are able to support the delivery of self‐administered survey questionnaires.
Description of the methods being investigated
Consumer smart devices, in this case smartphones and tablets, are mobile devices with advanced computing and connectivity capabilities, and with an operating system (OS) framework that focuses on small, distributed software applications (i.e., apps). Mobile OSs provide a platform through which apps are able to access the computational and connectivity capabilities of a device and enable it to perform specialist functions. Apps can be pre‐loaded by the phone manufacturer and distributed as part of the factory settings of the device. Alternatively, third‐party developers can distribute their own apps through marketplaces from which end users can directly download and install them (Aanensen 2009; Wilcox 2012). Smartphones and tablets are also equipped with built‐in sensors that can unobtrusively capture some of the contextual and environmental information surrounding their use.
How these methods might work
Through their computing and connectivity capabilities, and the interfaces offered by apps, consumer smart devices are able to collect complex data and implement complex scoring requirements, thus supporting the delivery of self‐administered survey questionnaires (Aanensen 2009; Link 2014). However, a potential differentiating factor between consumer smart devices and other electronic modes of delivery is the perceived advantage of being able to conveniently complete survey questionnaires at any time and anywhere, as consumer smart devices are almost always on a person. This could help address certain limitations of the quantitative survey method such as recall bias. This type of survey completion can be further facilitated by the interfaces offered by the app, which could enable user interactions aimed at maximising the quality of responses collected (e.g., increasing data completeness through alerts and reminders, or presentation of a number of questions that is compatible with the usage patterns of consumer smart devices).
Furthermore, the portability, connectivity and ubiquitousness of consumer smart devices have resulted in usage patterns characterised by short, habitual sessions associated with specific contextual or environmental triggers (Adams 2014; Gaggioli 2013; Ishii 2004; Oulasvirta 2012). In addition, the type of activities for which consumer smart devices are used and the nature of the information accessed through them are different when compared to other electronic devices (Ishii 2004). These changes can introduce new forms of mode effects as the context and the setting in which the respondent‐survey interaction takes place can affect the information available to respondents, the salience of certain cues, the speed required to produce responses, the chosen accuracy for responses, and the social influence or norms operating at that particular moment (Tourangeau 2000). These elements will in turn determine the cognitive mechanisms involved in the response generation process, thus affecting the final properties of the responses (Gaggioli 2013; Klasnja 2012; Tourangeau 2000).
The ubiquitousness of consumer smart devices, the number of activities for which they are used and the distribution model of apps have resulted in users experiencing an ever increasing level of familiarity with their devices. For respondents, this may reduce the training requirements needed to complete a survey questionnaire on a consumer smart devices. For researchers, these devices may offer a wider target audience and reduce research implementation costs.
Finally, data collected by built‐in sensors can enrich datasets with contextual and environmental information that could assist in the formulation or validation of theoretical models that attempt to explain the survey completion process or certain attributes of interest.
Why it is important to do this review
A systematic review in this area is warranted due to (i) the lack of a comprehensive assessment of the potential mode effects resulting from delivering self‐administered survey questionnaires via apps, (ii) the importance that self‐administered survey questionnaires have in generating the evidence base for public health and epidemiology, and (iii) the number of researchers already using apps for delivering self‐administered survey questionnaires.
Potential limitations of this Cochrane review
One of the potential limitations in this field is the difficulty in teasing out the relative contribution of the delivery mode to changes in survey questionnaire responses. An additional challenge concerns the generalisability and applicability of results given the large number of devices with differing technical specifications and the rapid pace at which technology advances. Moreover, variation in the characteristics of the population, the psychometric properties of a survey questionnaire and access to consumer smart devices across contexts might also affect the generalisability of our findings.
Objectives
To assess the impact that smartphone and tablet apps as a delivery mode have on the quality of self‐administered survey questionnaire responses compared to any alternative delivery mode: paper, laptop computer, tablet computer (manufactured before 2007), short message service (SMS), and plastic objects. The latter refers to a study in which the color analog scale (CAS) was printed on a plastic ruler.
Methods
Criteria for considering studies for this review
Types of studies
The International Society for Pharmacoeconomics and Outcomes Research electronic Patient‐Reported Outcome (ISPOR ePRO) Good Research Practices Task Force Report (Coons 2009) recommends using parallel randomised controlled trials (RCTs) and crossover trials to test for data equivalence between self‐reported measures delivered via different modes. Therefore, we included these study designs. We also included studies using a paired repeated measures study design.
Types of data
We included data obtained from participants completing health‐related self‐administered survey questionnaires, both validated and non‐validated. Although in measurement science it is important to ensure the validity and reliability of the instruments being used, a number of epidemiological studies still use patient‐reported measures whose psychometric properties have not been assessed or are not available. These studies might still provide useful insight into mode effects. However, we did not include data resulting from non‐validated instruments in a meta‐analysis. Instead, we synthesised these data narratively and used the data to inform our discussion.
We also included data offered by both healthy volunteers and by those with any clinical diagnosis. We planned to include the data resulting from individuals who were completing self‐administered surveys as part of a complex self management intervention; but, we did not identify any studies with these characteristics.
We excluded data that were generated by interviewers, clinicians, caregivers or parents who were completing survey questionnaires on behalf of someone else. We also excluded survey questionnaires that measured consumer behaviour or that were used as part of routine paperwork. We did not exclude studies on the basis of the age, gender or any other socio‐demographic variable of the individuals completing the self‐administered survey questionnaires. However, data generated by individuals aged 18 or younger were analysed separately from data generated by adult participants.
Types of methods
We included studies that used a smartphone or tablet app to deliver survey questionnaires. We only included native apps that had been developed for a particular mobile device platform, or web apps wrapped within a native app (e.g., using a framework such as Adobe® PhoneGapTM). We excluded web apps that were rendered on a mobile web browser. We believe that there are important differences in usability between these two types of apps (e.g., responsiveness, user interface design and performance), which could affect respondents' interaction with a survey questionnaire. Only smartphones and tablets that became available in or after 2007 were included, as these devices are compatible with the current mobile OS framework that focuses on apps.
We included studies that compared at least two modes of data collection, one of which was a smartphone or tablet app. Therefore, we compared self‐administered survey questionnaires delivered using an app versus the same survey questionnaire delivered using any other mode (either electronic or paper‐based).
We excluded apps that allowed pictures as a form of data entry. We excluded studies where students, researchers or employees used smartphones or tablets to collect data as part of their daily routines.
Types of outcome measures
Primary outcomes
Equivalence between survey questionnaire responses administered via two different delivery modes. This outcome assesses the changes in the psychometric properties of a survey questionnaire when it is adapted for use with a new delivery mode. We measured equivalence using correlations or measures of agreement (intra‐class correlation (ICC) coefficient, Pearson product‐moment correlations, Spearman rho and weighted Kappa coefficient), comparisons of mean scores between two delivery modes, or both (Gwaltney 2008). We focused on the overall equivalence of a survey questionnaire, as opposed to the equivalence between constructs or individual items (Gwaltney 2008). For ICC, we used 0.70 as the cut‐off point for group comparisons (Gwaltney 2008). For other coefficients, we used 0.60 as the cut‐off point for concluding equivalence (Gwaltney 2008). For studies comparing mean scores, we used the minimally important difference (MID) as an indicator of equivalence (Gwaltney 2008). In addition, since equivalence between alternative delivery modes is a form of test‐retest or alternate‐forms reliability, between‐mode mean differences (MDs) and ICC coefficients were interpreted, whenever possible, in relation to within‐mode test‐retest ICC of the original mode (Coons 2009; Gwaltney 2008).
Data accuracy: comparison of the proportion of errors or problematic items between two modes for delivering the same survey questionnaire.
Data completeness: comparison of the proportion of missing items between two modes for delivering the same survey questionnaire.
Response rates: the number of completed questionnaires divided by the total number of eligible sample units.
Secondary outcomes
Difference between two delivery modes in the time taken to complete a survey questionnaire.
Differences in respondents' adherence to the original sampling protocol: respondents' adherence to a pre‐specified schedule (both in terms of duration and frequency) of survey completion.
Differences between two delivery modes in acceptability to respondents.
Search methods for identification of studies
Electronic searches
We searched MEDLINE (January 2007 ‐ April 2015) using the search strategy outlined in Appendix 1. We adapted this search strategy for use in EMBASE (January 2007 ‐ April 2015) (Appendix 2), PsycINFO (January 2007 ‐ April 2015) (Appendix 3), IEEEXplore (January 2007 ‐ April 2015) (Appendix 4), Web of Science (January 2007 ‐ April 2015) (Appendix 5), CABI: CAB Abstracts (January 2007 ‐ April 2015) (Appendix 6), Current Contents Connect (January 2007 ‐ April 2015) (Appendix 7), ACM Digital (January 2007 ‐ April 2015) (Appendix 8), ERIC (January 2007 ‐ April 2015) (Appendix 9), Sociological Abstracts (January 2007 ‐ April 2015) (Appendix 10), Health Management Information Consortium (January 2007 ‐ April 2015) (Appendix 11), the Campbell Library (January 2007 ‐ April 2015) and CENTRAL (January 2007, Issue 1 ‐ April 2015, Issue 4) (Appendix 12). We also searched registers of current and ongoing clinical trials such as ClinicalTrials.gov (up to April 2015) (Appendix 13) and the World Health Organization (WHO) International Clinical Trials Registry Platform (ICTRP) (up to April 2015) (Ghersi 2009). We conducted our initial searches between up to 2 July 2014 (Marcano Belisaro 2014). We performed our search update up to 12 and 13 April 2015.
We did not exclude any studies based on their language of publication.
We limited our electronic searches to studies published on or after 2007 since the type of devices and the software development and distribution framework that we evaluated in this systematic review did not exist before this year. We documented the search results for each electronic database and included them as Appendix 14 and Appendix 15.
Searching other resources
We searched the grey literature in OpenGrey (up to April 2015), Mobile Active (up to April 2015) and ProQuest Dissertations & Theses (January 2007 ‐ April 2015) (Appendix 16). In addition, we searched Google Scholar (up to April 2015). We also checked the reference lists of included studies and relevant systematic reviews identified through our electronic searches for additional references.
Data collection and analysis
Selection of studies
JMB implemented the search strategies described in Electronic searches and Searching other resources, and both JMB and JJ reviewed the outputs. We imported all the references into EndNote X5 and removed duplicate records of the same reports using the built‐in function offered by this programme.
Following the initial searches, JMB (acting as Screener 1) and JJ and BF (both acting as Screener 2) independently examined the titles and abstracts of 17,169 records in order to identify potentially relevant studies. JMB, and JJ and BF then independently screened the full‐text reports of 243 potentially relevant records (54 of which were duplicate records that were not identified as such by the built‐in function offered by EndNote X5, and 161 of which were excluded) and assessed them for compliance with our inclusion and exclusion criteria.
For the search update, JMB and JJ independently examined the titles and abstracts of 5507 records. JMB and JJ then independently screened the full‐text reports of 21 potentially relevant records (14 of which were excluded) and assessed them for compliance with our inclusion and exclusion criteria.
Any disagreements were resolved through discussion between JMB, JJ and BF. If the information presented in the full‐text report was insufficient to make a full assessment, we contacted the study authors to request additional information.
Data extraction and management
JMB and JJ independently extracted data from the included studies using a structured web‐based form in REDCap 2009. We compared the data extraction forms completed by each review author and followed up any discrepancies with reference to the original full‐text report. We contacted authors of studies containing missing or incomplete data in an attempt to obtain the incomplete information.
Where possible, we extracted the following information from each record:
General study details.
Study methods, including study design; inclusion and exclusion criteria; and study setting.
Description and number of participants, including their level of health literacy, age group and health status.
Types of self‐administered survey questionnaires used, as well as the technological platform used to deliver them.
Outcomes: outcomes measured and time points at which they were measured and the numerical results of these measurements.
Study conclusions, advantages and limitations.
We summarised the information extracted in a Characteristics of included studies table.
Assessment of risk of bias in included studies
For RCTs, JMB and JJ independently assessed the risk of bias for all the included studies using Cochrane's tool for assessing the risk of bias in randomised trials (Higgins 2011). Therefore, we assessed the risk of bias across the following domains:
Random sequence generation.
Allocation concealment.
Blinding of participants and personnel.
Blinding of outcome assessment.
Incomplete outcome data.
Selective outcome reporting.
Other bias (i.e., imbalance of outcome measures at baseline, comparability between the characteristics of the intervention and control groups, and protection against contamination).
For crossover trials, we assessed the risk of bias across the following domains (Higgins 2011):
Suitability of the crossover design.
Evidence of a carry‐over effect.
Whether only first period data were available.
Incorrect statistical analysis.
Comparability of results with those from randomised trials.
We planned to assess the risk of bias for cluster‐randomised controlled trials (cRCTs) across the following domains (Higgins 2011):
Recruitment bias.
Baseline imbalances.
Loss of clusters.
Incorrect analysis.
Comparability with randomised trials.
However, we did not find any cRCTs that met our inclusion criteria.
For each included study, JMB and JJ classified each domain as presenting low, high or unclear risk of bias. We resolved any discrepancies between the two review authors through discussion. We summarised our assessment for each included study in a 'Risk of bias' table (included within the Characteristics of included studies table).
Measures of the effect of the methods
We compared the characteristics of included studies in order to determine the feasibility of performing a meta‐analysis. For continuous outcomes (i.e., comparison of mean scores between delivery modes, data completeness, time taken to complete a survey questionnaire and acceptability), we calculated the MD and 95% confidence intervals (CI). If studies using different measurement scales had been analysed quantitatively, we would have calculated the standardised mean difference (SMD). For dichotomous outcomes (i.e., acceptability), we calculated the odds ratio (OR) and 95% CI. In addition, had the correlation coefficients been analysed quantitatively, we would have calculated a summary correlation coefficient using a weighted linear combination method (Gwaltney 2008).
Unit of analysis issues
For cRCTs, we stated that we would attempt to obtain data at the individual level. Had these data not been available from the study report, we would have requested them directly from the contact author. In this case, we would have conducted a meta‐analysis of individual‐level data using a generic inverse‐variance method in RevMan 2014, which would have accounted for the clustering of data. If access to individual‐level data was not possible, we would have extracted the summary effect measurement for each cluster. We would have considered the number of clusters as the sample size and conducted the analysis as if the trial was individually randomised. This approach, however, would have reduced the statistical power of our analysis. For those studies that considered clustering of data in their statistical analysis, we would have extracted the reported effect estimates and used them in our meta‐analysis. However, we did not include any cRCTs.
Dealing with missing data
We attempted to contact the authors of studies with missing or incomplete data to request the missing information; however, we did not receive any replies. Therefore, we used an available case analysis.
Assessment of heterogeneity
For all our outcomes, we assessed the clinical and methodological diversity between included studies qualitatively. We assessed clinical diversity in relation to the type of device and platform used, the intensity of the data collection protocol and the characteristics of the participants. Methodological diversity was assessed in relation to the properties of the survey questionnaire, the study methodology and the outcome definitions. As a result of this assessment, we considered that a meta‐analysis would be appropriate if the included studies analysed the same age group of participants (i.e., adult participants separate from those aged 18 years or under), were using validated survey questionnaires and were using the same comparator (i.e., paper survey questionnaires or SMS).
Only a small number of studies met these criteria for each of our outcomes. In addition, the included studies displayed substantial clinical and methodological diversity, even after taking into consideration these criteria. For these reasons, we did not use a formal statistical test to quantify statistical heterogeneity or did not conduct any meta‐analysis.
Assessment of reporting biases
We conducted a comprehensive search of multiple bibliographic databases and trial registries in order to minimise the risk of publication bias, through which we identified two trials for which there are no publications yet available. Since there were fewer than 10 included studies in each of our analyses, we did not assess reporting bias using a funnel plot regression weighted by the inverse of the pool variance.
We assessed outcome reporting bias as part of the per‐study 'Risk of bias' assessment.
Data synthesis
Since performing a meta‐analysis was not appropriate, we conducted a narrative synthesis of the evidence. We adapted the framework proposed by Rodgers 2009 to guide this process. We had originally planned to use the Grading Recommendations Assessment, Development and Evaluation (GRADE) approach to assess the quality of the pooled evidence, the magnitude of effect of the interventions examined and the sum of the available data on the main outcomes to produce a 'Summary of findings' table for each of our primary outcomes. However, we did not implement this, because we did not conduct a meta‐analysis.
Subgroup analysis and investigation of heterogeneity
We planned to perform subgroup analyses according to whether the participants were healthy volunteers or had any given clinical diagnosis, and whether or not they were completing survey questionnaires as part of a complex self management intervention. We also planned to perform subgroup analyses based on the type of device (i.e., smartphone versus tablets) and the form of data entry, and on whether the survey questionnaires were used for longitudinal data collection or for a single outcome assessment. Finally, we also planned to perform subgroup analysis based on whether the study was industry‐funded or not. However, since a meta‐analysis was not appropriate, we did not perform any of these analyses.
Sensitivity analysis
We planned to conduct a sensitivity analysis if one or more studies were dominant due to their size, if one or more studies had results that differed from those observed in other studies, or if one or more studies had quality issues that may have affected their interpretation as assessed with the Cochrane 'Risk of bias' tool. However, since none of these conditions were met, we did not conduct a sensitivity analysis.
Results
Description of studies
Results of the search
After the initial implementation of our search procedures, we screened the titles and abstracts of 17,169 papers. Most records (17,168) were identified through the search strategies developed as part of our Electronic searches, whilst only one record was identified after looking at the professional profile of one contact author (Fanning 2014). During the initial screening, we excluded 16,926 records and retrieved full‐text reports for 243 potential includable studies and assessed them for eligibility. Of these, we excluded 215 records, and categorised six were as awaiting classification (see Studies awaiting classification and Characteristics of studies awaiting classification) because there was insufficient information available from the reports, and our attempts to obtain information from the contact authors were unsuccessful. Additionally, one record corresponded to an ongoing trial. We extracted data from 21 reports; however, we excluded eight of these records (corresponding to six studies) (Depp 2012; Fanning 2014; Haver 2011; Mavletova 2013; Wells 2014; Woods 2009).
Following the implementation of our search update, we screened the titles and abstracts of 5507 papers. During this initial screening, we excluded 5486 records and retrieved full‐text reports for 21 potential includable studies and assessed them for eligibility. Of these, we excluded 14 records, four were categorised as awaiting classification (as there was insufficient information available from the study reports and our attempts to obtain information from the contact authors were unsuccessful) and one record corresponded to an ongoing trial. We extracted data from two reports.
Overall, 15 records (corresponding to 14 studies) met the inclusion criteria (Ainsworth 2013; Brunger 2015; Bush 2013; Garcia‐Palacios 2014; Khraishi 2012; Kim 2014; Lamber 2012; Newell 2015; Salaffi 2013; Schemmann 2013; Sigaud 2014; Stomberg 2012; Sun 2013a; Sun 2013b; see Figure 1 and Figure 2).
1.
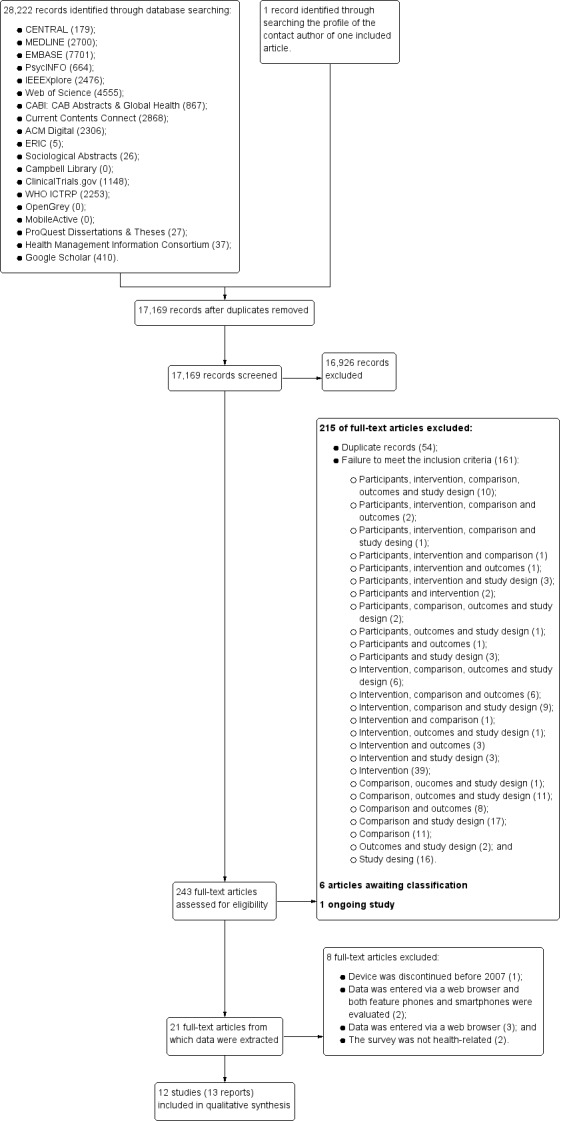
PRISMA flow diagram.
2.
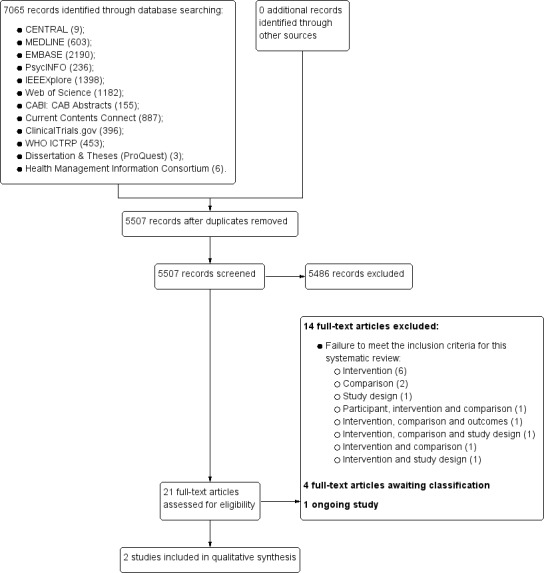
PRISMA flow diagram ‐ updated search.
Included studies
Of the 15 included records, nine were papers published in peer‐reviewed journals and six were posters or abstracts, or both. Moreover, two records corresponded to a single study and were included as Khraishi 2012. Two other records also corresponded to one study; but, this study evaluated two separate samples using different survey questionnaires. Therefore, we included them as two separate studies (Sun 2013a; Sun 2013b) with both records contributing data to each study.
Overall, we included 14 studies with a total of 2275 participants (only 2272 participants were analysed as there was missing data for three participants in one included study).
Types of studies
All the included studies were conducted in high‐income countries: Canada (Khraishi 2012; Sun 2013a; Sun 2013b); France (Sigaud 2014); Germany (Schemmann 2013); Italy (Lamber 2012; Salaffi 2013); Republic of Korea (Kim 2014); Spain (Garcia‐Palacios 2014); Sweden (Stomberg 2012); United Kingdom (Ainsworth 2013; Brunger 2015); and the United States of America (USA) (Bush 2013; Newell 2015). Newell 2015 recruited participants from disadvantaged communities in rural areas of the USA.
Lamber 2012, Newell 2015 and Stomberg 2012 conducted a randomised controlled study. Ainsworth 2013, Bush 2013, Garcia‐Palacios 2014, Khraishi 2012, Kim 2014, Salaffi 2013, Schemmann 2013, Sigaud 2014, Sun 2013a and Sun 2013b conducted cross‐over trials. Brunger 2015 conducted a paired repeated measures study. We planned to include studies using a cluster‐randomised design; but, we did not identify any that met our inclusion criteria. The duration of these trials (which includes both periods of data collection) varied between one day (Brunger 2015; Lamber 2012; Newell 2015; Salaffi 2013; Schemmann 2013; Sun 2013a; Sun 2013b) and six months (Sigaud 2014). Washout periods varied between 30 minutes (Sun 2013a; Sun 2013b) and one week (Ainsworth 2013; Kim 2014).
The main objectives of the included studies (as stated in the study reports) were to compare the psychometric properties of a survey questionnaire when administered using alternative delivery modes (Ainsworth 2013; Brunger 2015; Bush 2013; Garcia‐Palacios 2014; Khraishi 2012; Newell 2015; Salaffi 2013; Schemmann 2013; Sun 2013a; Sun 2013b), to develop a smartphone application for delivering a validated survey questionnaire and demonstrate its validity and reliability (Kim 2014), to demonstrate the data equivalence between different delivery modes whilst assessing the impact that patient‐related factors has on usability (Lamber 2012), and to evaluate the performance of a new delivery mode for recording patient data (Sigaud 2014; Stomberg 2012).
Finally, three studies mentioned having provided some form of incentive to their participants: Ainsworth 2013 offered GBP 50 worth of phone credit (for those participants on pay‐as‐you‐go plans) plus an additional GBP 30 upon completion of the study; Garcia‐Palacios 2014 offered three weeks of free psychological treatment for fibromyalgia syndrome (six two‐hour group sessions); and Newell 2015 offered a USD 40 gift card to their participants.
Types of data
We were able to categorise the types of data across the characteristics of the self‐administered survey questionnaire and of the target populations, and the setting in which completion of the survey questionnaires took place.
Characteristics of the self‐administered survey questionnaires
For this dimension, we considered the validation status (i.e., validated, non‐validated, composite instruments and unclear), clinical applications and the type of response scales of each survey questionnaire.
Table 1 provides a summary of the self‐administered survey questionnaires included in this Cochrane review, grouped according to their validation status and clinical application. Overall, nine studies used validated instruments (Brunger 2015; Khraishi 2012; Kim 2014; Lamber 2012; Newell 2015; Salaffi 2013; Schemmann 2013; Sun 2013a; Sun 2013b). Brunger 2015 used a visual analogue scale (VAS) to measure satiety in a sample of participants before and after the consumption of either a high‐energy or a low‐energy drink. These scales were developed according to the guidance proposed by Blundell 2010 for the assessment of food consumption. Khraishi 2012 used the Health Assessment Questionnaire (HAQ) (Bruce 2003), which is a self report functional status measure commonly used in rheumatology (although it can be used across diverse clinical disciplines) that collects data on five patient‐related health dimensions: to avoid disability; to be free of pain or discomfort; to avoid adverse treatment effects; to keep treatment costs low; and to postpone death (Bruce 2003). Kim 2014 used the International Prostate Symptom Score (IPSS) (Barry 1992), which is a symptom index normally used for the assessment and management of patients with benign prostatic hyperplasia. This eight‐item instrument evaluates sensation of incomplete bladder emptying, urinary frequency, urinary intermittency, difficulty urinating, strength of the urinary stream, straining, nocturia and quality of life. Lamber 2012 employed the European Organization for Research and Treatment of Cancer Quality of Life Questionnaire ‐ C30 (EORTC QLQ ‐ 30), which has been developed to assess the quality of life in patients with cancer (EORTC QLQ‐C30). Newell 2015 used the Center for Epidemiologic Studies Depression Scale (CES‐D) and the Regulatory Focus Questionnaire (RFQ). The CES‐D (Eaton 2004; Radloff 1977) was developed to measure symptoms of depression across nine dimensions: dysphoria; anhedonia; appetite; sleep; thinking; feelings of worthlessness; fatigue; agitation; and suicidal ideation. The RFQ (Higgins 2001) measures an individual's orientation towards her or his goals. This survey questionnaire consists of 11 items (each mapped on to a five‐point scale) assessing two subscales: prevention and promotion. The former subscale focuses on safety and responsibility, while the promotion subscale focuses on hopes and accomplishments. Salaffi 2013 used both the Bath Ankylosing Spondylitis Disease Activity Index (BASDAI) (Garrett 1994) and the Bath Ankylosing Spondylitis Functional Index (BASFI) (Calin 1994). The former is a 10 cm horizontal VAS that measures the severity of fatigue, spinal and peripheral joint pain, localised tenderness and morning stiffness (Garrett 1994) in patients with ankylosing spondylitis. The BASFI is a two‐part questionnaire measuring function in ankylosing spondylitis and patients' ability to perform everyday activities (Calin 1994). The 10 questions in part 2 of this questionnaire are on a 10‐point scale. Schemmann 2013 used the German version of the short International Hip Outcome Tool (iHOT‐12) (Griffin 2012), which is a 12‐item scale assessing the quality of life and functional status of patients with hip disorders (Griffin 2012). Finally, Sun 2013a and Sun 2013b used the Faces Pain Scale Revised (FPS‐R) (Hicks 2001) and the Color Analog Scale (CAS) (Bulloch 2009) to assess post‐surgical pain in a paediatric population.
1. Self‐administered survey questionnaires grouped by validation status and clinical application.
| Validation status | Clinical application | Study ID | Instrument name |
| Validated | Functional Status Assessment | Khraishi 2012 | Health Assessment Questionnaire |
| Salaffi 2013 | Bath Ankylosing Spondylitis Disease Activity Index | ||
| Bath Ankylosing Spondylitis Functional Index | |||
| Schemmann 2013 | Short International Hip Outcome Tool (iHOT‐12 ‐ German Version) | ||
| Pain Assessment | Sun 2013a | Faces Pain Scale Revised (FPS‐R) | |
| Sun 2013b | Color Analog Scale (CAS) | ||
| Symptom Scores | Kim 2014 | International Prostate Symptom Score (IPSS) | |
| Health‐related Quality of Life | Lamber 2012 | European Organization for Research and Treatment of Cancer Quality of Life Questionnaire‐C30 (EORTC QLQ‐30) | |
| Kim 2014 | Quality of Life component of the IPSS | ||
| Mental Health Assessment | Newell 2015 | Center for Epidemiologic Studies Depression Scale (CES‐D) | |
| Assessment of Individual Differences | Newell 2015 | Regulatory Focus Questionnaire (RFQ) | |
| Food Consumption/Appetite Assessment | Brunger 2015 | Visual Analogue Scales (VAS) designed following the guidance proposed by Blundell 2010 | |
| Composite Instruments | Mental Health Assessment | Ainsworth 2013 | Symptom dimensionsa: (i) hopelessness, (ii) depression, (iii) hallucinations; (iv) anxiety, (v) grandiosity, (vi) paranoia, and (vii) delusions |
| Bush 2013 | Mobile Screenera : (i) the Post Traumatic Stress Disorder Checklist (PTSD Checklist); (ii) Patient Health Questionnaire ‐ 9 (PHQ‐9); (iii) Revised Suicidal Ideation Scale (R‐SIS); (iv) Deployment Risk and Resilience Inventory‐Unit Support (DRRI‐US); (v) Dimensions of Anger 5 (DAR5); (vi) Sleep Evaluation Scale; and (vii) TBI Self‐Report of Symptoms | ||
| Non‐validated | Pain Assessment | Stomberg 2012 | Patient‐reported Post‐surgical Pain |
| Diary | Sigaud 2014 | Treatment Compliance Diary | |
| Unclear | Functional Status Assessment | Garcia‐Palacios 2014 | PROMs measuring fatigue |
| Pain Assessment | PROMs measuring pain | ||
| Mental Health Assessment | PROMs measuring mood |
aThe composite instruments used in these studies were derived from previously validated instruments.
Both Ainsworth 2013 and Bush 2013 used composite scales derived from previously validated instruments to conduct mental health assessments. Ainsworth 2013 developed a diagnostic assessment tool from a mobile phone assessment scale that assesses seven symptom dimensions: hopelessness, depression, hallucinations, anxiety, grandiosity, paranoia and delusions. This instrument was delivered using ecological momentary assessment (EMA) methods. Bush 2013 developed their Mobile Screener which incorporated the Post Traumatic Stress Disorder Checklist (PTSD Checklist), Patient Health Questionnaire ‐ 9 (PHQ‐9), Revised Suicidal Ideation Scale (R‐SIS), Deployment Risk and Resilience Inventory‐Unit Support (DRRI‐US), Dimensions of Anger 5 (DAR5), Sleep Evaluation Scale and TBI Self Report of Symptoms.
Sigaud 2014 used a non‐validated diary to monitor the home treatment (recombinant Factor VIII) of patients diagnosed with severe Haemophilia A, whilst Stomberg 2012 used a non‐validated numerical rating scale (NRS) to monitor post‐surgical pain. Garcia‐Palacios 2014 used EMA methods to collect patient‐reported outcome measures (PROMs) of pain, fatigue and mood in a clinical population using NRS items. However, the validation status of these measures was unclear.
In relation to the response scales, the survey questionnaire used by Bush 2013 was a categorical scale: their Sleep Evaluation Scale consisted of ten items measured as true/false. The rest of the included studies used continuous scales, including VAS (Brunger 2015; Salaffi 2013; Sun 2013b), NRS (Garcia‐Palacios 2014; Newell 2015; Salaffi 2013; Stomberg 2012), adjectival or Likert scales (Ainsworth 2013; Bush 2013; Kim 2014; Lamber 2012; Schemmann 2013), and face scales (Sun 2013a).
Population characteristics
We considered the health status and age group of the participants.
Most participants came from clinical populations: rheumatology (Garcia‐Palacios 2014; Khraishi 2012; Salaffi 2013; Schemmann 2013), surgery (Stomberg 2012; Sun 2013a; Sun 2013b), psychiatry (Ainsworth 2013), urology (Kim 2014), oncology (Lamber 2012) and haematology (Sigaud 2014). Only Brunger 2015, Newell 2015 and Bush 2013 recruited participants from a population of healthy adults, with the latter recruiting army personnel. Table 2 provides a summary of the diagnoses and exclusion criteria for each included study.
2. Clinical populations included in this Cochrane review.
| Clinical Domain | Study ID | Diagnosis | Exclusion criteria |
| Rheumatology | Garcia‐Palacios 2014 | Fibromyalgia | Severe mental illness; severe sensory impairment |
| Khraishi 2012 | Psoriatic arthritis; rheumatoid arthritis | Not specified | |
| Salaffi 2013 | Axial spondyloarthritis | Younger than 18 years; mental or physical disability | |
| Schemmann 2013 | Inpatients treated with hip arthroscopy | Not specified | |
| Surgery | Stomberg 2012 | Patients undergoing planned vaginal hysterectomy or laparoscopic cholecystectomy | History of alcohol or drug abuse; memory impairments |
| Sun 2013a | Children in the post‐anaesthetic care unit | Not specified | |
| Sun 2013b | |||
| Urology | Kim 2014 | Lower urinary tract symptoms | Cancer; Neurologic diseases; uncontrolled hypertension; uncontrolled diabetes; psychiatric disorders; prostatic surgery; liver cirrhosis; and renal failure |
| Oncology | Lamber 2012 | Cancer (not specified) | Not specified |
| Psychiatry | Ainsworth 2013 | Schizophrenia; schizoaffective disorder | Organic or substance‐induced psychoses |
| Haematology | Sigaud 2014 | Severe Haemophilia A treated with Advate® (recombinant Factor VIII) | Not specified |
Concerning age groups, both Sun 2013a and Sun 2013b recruited a paediatric sample of children aged between four and 11 years, and between five and 18 years, respectively. The remaining studies recruited adult participants ranging from 18 to 80 years old.
Setting
Ainsworth 2013, Garcia‐Palacios 2014, Sigaud 2014, and Stomberg 2012 asked participants to complete survey questionnaires in a naturalistic setting. These studies also required a longer and more intensive sampling protocol. The remaining studies asked participants to complete survey questionnaires in a clinical or research setting (Brunger 2015; Bush 2013; Khraishi 2012; Kim 2014; Lamber 2012; Newell 2015; Salaffi 2013; Schemmann 2013; Sun 2013a; Sun 2013b).
Types of method
We categorised the types of methods based on the type of device and platform, functionality offered, human‐machine interaction factors, data collection protocol and additional interventions.
Types of device and platform
Lamber 2012 evaluated the EORTC QLQ‐30 using an app running on both smartphones and tablets. The model of the tablet was not specified; but, the handset used was a Nokia N97 running Symbian OS. The report of this study indicated that their app, MobiDay, was developed specifically for smartphones, which suggests that the tablet might not be compatible with our inclusion criteria (see Types of methods in Criteria for considering studies for this review).
Ainsworth 2013, Bush 2013, Garcia‐Palacios 2014, Kim 2014, Sigaud 2014, Stomberg 2012, Sun 2013a and Sun 2013b used apps running on smartphones. Bush 2013 and Stomberg 2012 supported the iPhone (iOS) platform, although the latter also supported Android and Java‐enabled handsets. Ainsworth 2013 used Orange San Francisco handsets running Android OS, and Garcia‐Palacios 2014 used HTC 1 Diamond devices running Windows Mobile OS. Kim 2014, Sigaud 2014, Sun 2013a and Sun 2013b reported using smartphones in their studies but did not specify the models used.
Brunger 2015, Khraishi 2012, Newell 2015, Salaffi 2013 and Schemmann 2013 used apps running on tablets. Khraishi 2012 and Newell 2015 used an iPad (iOS), Brunger 2015 used an iPad mini (iOS), whereas Salaffi 2013 used an Archos 101 tablet running Android OS. However, Schemmann 2013 did not specify the device model.
Functionality
Four studies reported the functionality offered by their apps (Ainsworth 2013; Garcia‐Palacios 2014; Salaffi 2013; Stomberg 2012). The app used in Ainsworth 2013 allowed the configuration of the number of questions that were displayed on each day (or the times in which these were displayed), configuration of questions, the creation of multiple question sets, question branching, questionnaire timeout, time stamping of questionnaire entries and complex skip procedures. Garcia‐Palacios 2014 implemented a configurable number of questions displayed on each day and time stamping of questionnaire entries, whilst Stomberg 2012 implemented both a configurable number of questions displayed on each day and configurable questions. Lastly, Salaffi 2013 enabled the implementation of complex skip procedures and compulsory questions. See Table 3 for additional information.
3. Functionality and human computer interaction of the included apps.
| Study ID | Functionality | Human Computer Interaction | ||||||||||
| Configurable number/times of questions per day | Configurable question sets | Question branching | Questionnaire timeout | Time stamping of data entries | Complex skip procedures | Alerts | Reminders | Questionnaire layout | Data input | Saving data | Audio instructions | |
| Ainsworth 2013 | ✓ | ✓ | ✓ | ✓ | ✓ | ✓ | User definable alerts; delivered at semi‐random intervals; snooze alter to be reminded 5 minutes later; one alert for each question set | ‐ | One question per page; navigation through the pages of questions enabled | Continuous slider bar mapped onto a 7‐point Likert scale | Automatic; however, all answers were stored in the handset for downloading at the end of the sampling procedure | ‐ |
| Brunger 2015 | ‐ | ‐ | ‐ | ‐ | ‐ | ‐ | ‐ | ‐ | One question per page | 100mm horizontal line; users could select their answer by sliding their finger across the line on the touchscreen | Automatic transfer of data to a secure database via a wireless connection | ‐ |
| Bush 2013 | ‐ | ‐ | ‐ | ‐ | ‐ | ‐ | ‐ | ‐ | ‐ | ‐ | ‐ | ‐ |
| Garcia‐Palacios 2014 | ✓ | ‐ | ‐ | ‐ | ✓ | ‐ | Audio signal indicated that the rating scale should be completed; times could be adjusted to the particular needs of each participant | Audio signal every minute for the next 15 minutes after the initial alert, and then every 15 minutes during the next hour | ‐ | ‐ | ‐ | Enabled |
| Khraishi 2012 | ‐ | ‐ | ‐ | ‐ | ‐ | ‐ | ‐ | ‐ | ‐ | ‐ | ‐ | ‐ |
| Kim 2014 | ‐ | ‐ | ‐ | ‐ | ‐ | ‐ | ‐ | ‐ | One question per page; navigation through the pages of questions enabled; users were allowed to correct/change previous answers | ‐ | Users had to tap the save button in order to submit their answers; automatic transfer of data | ‐ |
| Lamber 2012 | ‐ | ‐ | ‐ | ‐ | ‐ | ‐ | ‐ | ‐ | One question per screen | ‐ | Users were allowed to suspend their tasks and to come back to the questionnaire later on | ‐ |
| Newell 2015 | ‐ | ‐ | ‐ | ‐ | ‐ | ‐ | ‐ | ‐ | ‐ | ‐ | ‐ | ‐ |
| Salaffi 2013 | ‐ | ‐ | ‐ | ‐ | ‐ | ✓ | ‐ | ‐ | One question per screen with visual and auditory stimuli | ‐ | Automatic | Voice and text synchronisation; replay buttons for the question stems and the individual response options |
| Schemmann 2013 | ‐ | ‐ | ‐ | ‐ | ‐ | ‐ | ‐ | ‐ | ‐ | ‐ | ‐ | ‐ |
| Sigaud 2014 | ‐ | ‐ | ‐ | ‐ | ‐ | ‐ | ‐ | ‐ | ‐ | ‐ | ‐ | ‐ |
| Stomberg 2012 | ✓ | ✓ | ‐ | ‐ | ‐ | ‐ | Push notifications delivered every 4 hours | SMS reminder if no response was obtained within 13 minutes of the initial alert | One question per screen; question disappeared immediately after an answer was submitted | ‐ | Automatic | ‐ |
| Sun 2013a | ‐ | ‐ | ‐ | ‐ | ‐ | ‐ | ‐ | ‐ | ‐ | ‐ | ‐ | ‐ |
| Sun 2013b | ‐ | ‐ | ‐ | ‐ | ‐ | ‐ | ‐ | ‐ | ‐ | ‐ | ‐ | ‐ |
Human computer interaction
Seven studies reported the human‐machine interaction elements implemented in their apps (Ainsworth 2013; Brunger 2015; Garcia‐Palacios 2014; Kim 2014; Lamber 2012; Salaffi 2013; Stomberg 2012). Ainsworth 2013 allowed respondents to set their own schedule of alerts. These alerts were delivered at semi‐random intervals, and respondents were allowed to snooze the alerts for five minutes. Questions were presented one per page but respondents were able to navigate back and forth between pages. Data input was done via a continuous slider bar mapped onto a seven‐point Likert scale, and data were saved immediately after a response was entered. Brunger 2015 presented one question per page. Data input was achieved through a continuous slider mapped onto a 10 cm horizontal line; users interacted directly with this line through the touchscreen. Responses were transmitted automatically to a secure database via a wireless connection. Garcia‐Palacios 2014 also implemented alerts but these were in the form of audio signals. Audio reminders were displayed if an answer was not entered within the time specified, and were played every minute during the first 15 minutes and then every 15 minutes for the next hour. This app also featured audio‐recorded instructions. Alerts in Stomberg 2012 took the form of push notifications delivered every four hours, and reminders were sent via SMS if no response was received within 13 minutes of the scheduled time.
Kim 2014, Lamber 2012, Salaffi 2013 and Stomberg 2012 also presented one question per page. However, only Kim 2014 allowed respondents to navigate between pages and to modify previous answers. Respondents in Kim 2014 had to confirm the selected option before their response was saved, whereas data were saved automatically in Lamber 2012, Salaffi 2013 and Stomberg 2012. Furthermore, participants in Lamber 2012 were allowed to stop at any time and resume the survey questionnaire whenever it was convenient for them. Salaffi 2013 implemented voice and text synchronisation, and replay buttons for each question stem and individual response option.
See Table 3 for additional information.
Data collection protocol
Most included studies (71%) sampled participants for one day (Brunger 2015; Bush 2013; Khraishi 2012; Kim 2014; Lamber 2012; Newell 2015; Salaffi 2013; Schemmann 2013; Sun 2013a; Sun 2013b). However, Brunger 2015 sampled participants 0, 30, 60, 90 and 120 minutes after the consumption of a low‐energy or a high‐energy drink. On the other hand, Garcia‐Palacios 2014 required participants to complete survey questionnaires for at least three times a day for seven days, and both Ainsworth 2013 and Stomberg 2012 for at least four times a day for six days. Participants in Sigaud 2014 were asked to keep a diary for three months, although the frequency was not mentioned in the report.
Additional interventions
Ainsworth 2013, Newell 2015, Salaffi 2013 and Stomberg 2012 offered training on the use of their app or device. In addition, both Ainsworth 2013 and Stomberg 2012 allowed phone calls during the sampling period, whilst only Stomberg 2012 offered installation of the app by a member of staff. A semi‐structured interview, the Positive and Negative Syndrome Scale (PANSS), was conducted in Ainsworth 2013 before and after the sampling period. These features could have acted as interventions in their own right, influencing the study findings.
Types of comparisons
Type of device & platform
Bush 2013 and Lamber 2012 chose both a laptop and paper as their comparators. However, only Lamber 2012 specified using a MacBook Pro laptop. Since the tablet used in Lamber 2012 is unlikely to match our inclusion criteria, we considered it a comparator. Brunger 2015 used a PDA (iPAQ) as their comparator. Ainsworth 2013 chose SMS as their comparator, delivered via openCDMS (an open source, secure online clinical data management system). Sun 2013b used a version of the CAS printed on a plastic ruler as a comparator. The remaining studies compared an app to paper (Garcia‐Palacios 2014; Khraishi 2012; Kim 2014; Newell 2015; Salaffi 2013; Schemmann 2013; Sigaud 2014; Stomberg 2012; Sun 2013a).
Functionality
Only Ainsworth 2013 reported allowing configurable number of questions displayed on each day, configurable questions, multiple question sets, question branching, questionnaire timeout, time stamping of data entries and skip procedures.
Human computer interaction
Only Ainsworth 2013, Brunger 2015 and Lamber 2012 reported this information in sufficient detail.
In Ainsworth 2013, SMS alerts were delivered at semi‐random intervals. There was one alert for each question and one SMS reminder if no response was received within five minutes. Questions were presented one per SMS and answers were submitted by responding to the SMS (typing a number between one and seven); subsequent questions were delivered when the response to the current question had been submitted. Brunger 2015 presented one question per page on an iPAQ (model not specified). Data input was made through a continuous slider mapped onto a 64 mm horizontal line; user‐device interaction was achieved through the use of a stylus. Lamber 2012 developed a Computer‐based Health Evaluation System (CHES) designed to run on a tablet (where users could enter their responses with a stylus‐pen) and a web‐based application designed to run on a laptop. Patients using the laptop were able to access the application via a web browser; this application adapted its graphical user interface to the device characteristics, and presented one question per screen and response options in a drop‐down list.
Data collection protocol
The sampling protocols between apps and their comparators were identical, except for Stomberg 2012: four times a day for four days (compared to four times a day for six days in the intervention group).
Additional interventions
Ainsworth 2013 offered training and phone calls during the sampling period, and administered the PANSS semi‐structured interview before and after the sampling period. Newell 2015 offered training on the use of an iPad to all participants, including those who completed the survey questionnaire using pen‐and‐paper. Salaffi 2013 offered on site assistance to their participants.
Types of outcome measures
None of the studies measured data accuracy or response rates.
Eleven studies (out of 14) measured data equivalence. Bush 2013, Kim 2014 and Salaffi 2013 compared mean scores (either overall scores or construct scores) between delivery modes and also calculated ICC coefficients. Ainsworth 2013, Garcia‐Palacios 2014, Khraishi 2012 and Newell 2015 used the comparison of mean scores as their only measure of equivalence; Sun 2013a and Sun 2013b compared mean scores and calculated the Pearson correlation coefficient, and Schemmann 2013 used the ICC coefficient. Brunger 2015 calculated correlation coefficients for each of five questions but the type of coefficient was not specified in the study report.
Ainsworth 2013 and Garcia‐Palacios 2014 measured data completeness. Ainsworth 2013 measured it as the mean number of data entries on a daily basis, and Garcia‐Palacios 2014 defined it as the difference in the mean number of complete and incomplete records.
Ainsworth 2013, Khraishi 2012 and Salaffi 2013 compared the mean time taken to complete a survey questionnaire using an app with that of the comparator.
Ainsworth 2013 measured adherence to the data collection protocol and defined it as the difference between two delivery modes in the proportion of individuals who completed at least one third of all possible data points. Sigaud 2014 claimed to have measured the rate of diary completion, and Stomberg 2012 response rates (defined as the proportion of individuals 'responding' to the data entry alerts sent or those following the pre‐defined data collection protocol). However, we considered these definitions to be more compatible with our outcome 'adherence to the data collection protocol' and reported them as such.
With the exception of Brunger 2015 and Stomberg 2012, all the studies measured acceptability, each using their own custom‐designed questionnaire. Consequently, the definitions of acceptability varied considerably: preference (Ainsworth 2013; Bush 2013; Garcia‐Palacios 2014; Khraishi 2012; Kim 2014; Newell 2015; Salaffi 2013; Schemmann 2013; Sun 2013a; Sun 2013b); ease of use (Ainsworth 2013; Garcia‐Palacios 2014; Khraishi 2012; Lamber 2012; Newell 2015; Schemmann 2013); willingness to use a delivery mode (Kim 2014; Sigaud 2014); satisfaction (Lamber 2012; Newell 2015; Sigaud 2014); effectiveness of the system informativeness (Garcia‐Palacios 2014; Lamber 2012; Newell 2015); perceived time taken to complete the survey questionnaire (Garcia‐Palacios 2014; Khraishi 2012); perceived benefit of a delivery mode (Khraishi 2012); perceived usefulness of a delivery mode (Garcia‐Palacios 2014); perceived ability to complete a survey questionnaire (Newell 2015); maximum length of time that participants would be willing to use a delivery mode (Ainsworth 2013); and reactivity to the delivery mode and its successful integration into respondents' daily routine (Ainsworth 2013).
Studies awaiting classification
Ten records are awaiting classification (see the Characteristics of studies awaiting classification table for additional information). For seven of them we need additional information on the model of the device used (Bjorner 2014a; Bjorner 2014b; Burke 2012; Cunha‐Miranda 2014; Nandkeshore 2013; O'Gorman 2014; Schaffeler 2014). In addition, we need to determine if Bjorner 2014a and Bjorner 2014b refer to the same study. We also need additional details on the study design in Benway 2013. Nonetheless, a preliminary analysis of these studies suggests that they would not modify our findings for data equivalence, adherence to sampling protocol and acceptability to respondents.
Moreover, we need the full‐text report of Anand 2015 in order to assess this study against our inclusion and exclusion criteria.
Lastly, although Pfizer 2009 has been completed, no data have yet been published.
Ongoing trials
Khair 2015 is a multi‐centre, cluster‐RCT evaluating whether measures of functional outcome correlate with quality of life measures in boys with haemophilia. Kingston 2014 is a RCT evaluating the feasibility and acceptability (compared to paper) of conducting e‐screening using a wireless‐enabled tablet computer in pregnant and post‐partum women. Additional information can be found in the Characteristics of ongoing studies table.
Excluded studies
Following the initial search, most excluded during full‐text screening were duplicate records (54 records). In addition, the most common causes for excluding studies were because of ineligibility: i) interventions (39 studies); ii) comparisons and study design (17 studies); iii) study design (16 studies); iv) comparisons, outcomes and study design (11 studies); v) comparisons (11 studies); and vi) participants, interventions, comparisons, outcomes and study design (10 studies). Following the search update, we excluded most studies during full‐text screening due to ineligible interventions (six studies).
Six studies were excluded during data extraction for the following reasons: handset was discontinued before 2007 (Woods 2009); data were entered via browsers running on mobile devices, and both features phones and smartphones were tested in the intervention (Mavletova 2013); data were entered via web browsers running on mobile devices (Depp 2012; Fanning 2014); and a non health‐related survey (Haver 2011; Wells 2014).
We have listed the additional reasons for exclusion in the Characteristics of excluded studies table.
Risk of bias in included studies
Risk of bias in RCTs
We used Cochrane's 'Risk of bias' assessment tool (Higgins 2011) to assess the risk of bias in Lamber 2012, Newell 2015 and Stomberg 2012 as these were the only studies using an RCT study design (see Figure 3 and Figure 4 for additional information).
3.
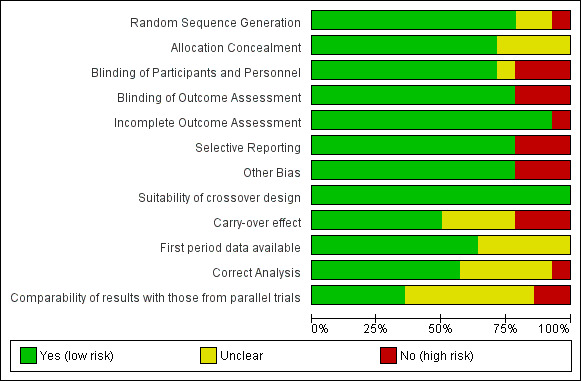
Risk of bias graph: review authors' judgements about each risk of bias item presented as percentages across all included studies.
4.
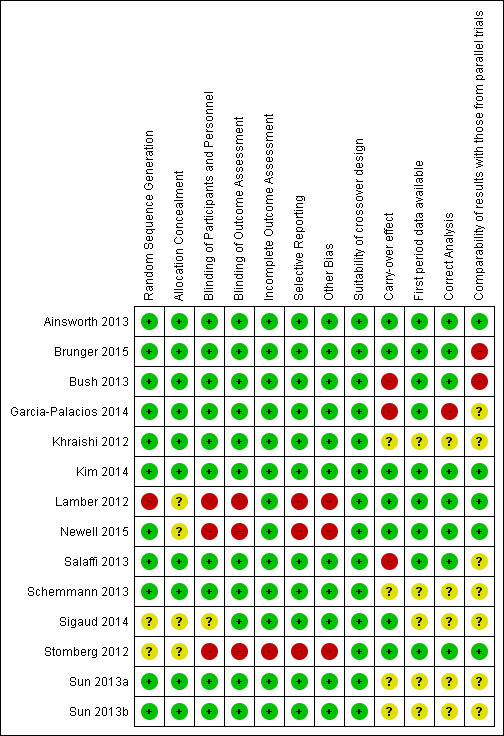
Risk of bias summary: review authors' judgements about each risk of bias item for each included study.
Allocation
Lamber 2012 reported that patients were selected by clinicians and were randomly allocated to one of the four experimental groups (i.e., mobile, laptop, tablet and pen‐and‐paper). However, the specific method by which this was achieved was not reported. Moreover, almost half of the participants (47.3%) were allocated to the laptop group. For these reasons we deemed the risk of selection bias due to random sequence generation as high in this study. Newell 2015 reported conducting computerised randomisation using Qualtrics software. For this reason, we considered the risk of selection bias due to random sequence generation as low in this study. Participants in Stomberg 2012 were randomly allocated to either the mobile group or the questionnaire group; however, the specific procedure followed by the investigators was not specified; therefore, we considered the risk of selection bias due to random sequence generation for this study as unclear.
There was insufficient information in the study reports to assess the risk of selection bias due to allocation concealment in Lamber 2012, Newell 2015 and Stomberg 2012 (i.e., unclear risk of bias).
Blinding
We judged the risk of performance bias (due to blinding of participants and personnel) as high for Lamber 2012, Newell 2015 and Stomberg 2012. Although blinding is not possible in these circumstances as the delivery mode is evident, awareness of the delivery modes being offered to other participants could have influenced participants' motivation to complete the self‐administered survey questionnaires. This was evident in Stomberg 2012, as some participants expressed disappointment at being allocated to the paper questionnaire group. Moreover, all the participants in Newell 2015 received a tutorial on the use of an iPad regardless of the delivery mode they were allocated to.
Similarly, we deemed the risk of detection bias (due to non‐blinding of outcome assessment) as high for all three studies. Although it is unclear from the study reports whether or not outcome assessors were blinded to participant allocation, manual data entry (or calculation of overall scores) for responses collected via paper instruments could have introduced detection bias.
Incomplete outcome data
In Lamber 2012 and Newell 2015, all the participants that were initially enrolled in the studies completed the intervention and their data were included in the final statistical analysis. For this reason, we judged the risk of attrition bias (due to incomplete outcome data) in these studies as low. In Stomberg 2012, data from three participants were not included in the final analysis. Moreover, some participants did not submit any data. Therefore, we judged the risk of attrition bias in this study as high.
Selective reporting
We judged the risk of reporting bias (due to selective reporting) as high in Lamber 2012, Newell 2015 and Stomberg 2012. Lamber 2012 evaluated the impact of patient profile (both clinical and technological) on usability of the electronic delivery modes. For this, however, they only focused on the laptop group as "this is the only group where enough samples were collected (to assure reliable results)". Participants in Newell 2015 underwent randomisation before completing each of two survey questionnaires (CES‐D and RFQ). In between the two survey questionnaires, participants were asked to complete a clarity/confidence survey questionnaire that was used to assess the acceptability to respondents of the delivery mode. For the analysis of this outcome however, only participants that completed both survey questionnaires (i.e., CES‐D and RFQ) using the same delivery mode were included in the statistical analysis. In addition, only participants in the second community from which participants were recruited were asked to complete the BRIEF health literacy scale and other survey format items. Stomberg 2012 considered response rate as one of their outcomes. However, it was measured as compliance with the original data collection protocol and reported on a day‐by‐day basis. Moreover, the study authors attempted to report a comparison of the overall pain scores, sometimes across type of surgery performed and sometimes across type of delivery mode. However, the lack of appropriate tables and figures makes it difficult to identify the significant differences.
Other potential sources of bias
We assessed the risk of other bias as high for Lamber 2012, Newell 2015 and Stomberg 2012. The standard deviation (SD) of the usability scores in Lamber 2012 was not reported. All the participants in Newell 2015 received a tutorial on how to use an iPad regardless of the delivery mode they were allocated to; which could have acted as an intervention in its own right. In addition, participants in the second community from which participants were recruited used an iPad to complete the BRIEF health literacy scale and other survey format items. In Stomberg 2012, participants allocated to the intervention group received training on both pain management and on the use of the mobile app. As a result, participants in the intervention group could have been more engaged than those assigned to the control group. Finally, the sampling period in this study was different for the two experimental groups (six days for the intervention group and four days for the control group).
Risk of bias in crossover studies
The risk of bias in Ainsworth 2013, Brunger 2015, Bush 2013, Garcia‐Palacios 2014, Khraishi 2012, Kim 2014, Salaffi 2013, Schemmann 2013, Sigaud 2014, Sun 2013a and Sun 2013b was assessed following the recommendation of the Cochrane Handbook for Systematic Reviews of Interventions (Higgins 2011) for crossover trials (see Figure 3 and Figure 4 for additional information).
Suitability of the crossover design
Crossover trials are one of the recommended study designs for assessing data equivalence between alternative delivery modes of the same self reported instrument (Coons 2009). For this reason, we judged the risk of bias in this domain as low for all the included studies using this study design.
Carry over effect
Both Ainsworth 2013 and Sigaud 2014 assessed the interaction between the sampling period and method of assessment. Ainsworth 2013 found that the order of the two conditions did not significantly predict the total number of entries a participant completed, or the length of time it took to complete each entry. Sigaud 2014 found that the sequence of the two diaries and the specific effect related to the patient had no effect on the rate of diary completion. Moreover, although Kim 2014 did not test for the presence of carry‐over effect, they chose a washout period of one week in order to minimise the likelihood of this effect. Moreover, Brunger 2015 counterbalanced the order in which the devices were used to administer their survey questionnaire (despite that there was no washout period between the two administrations of their survey questionnaire at each time point). In addition, they accounted for the type of device in their statistical analyses. For these reasons, we judged the risk of bias in this domain as low for these studies.
Bush 2013, Garcia‐Palacios 2014 and Salaffi 2013 did not test for carry‐over effect. However, their washout periods did not seem adequate to prevent this effect (90 minutes and 60 minutes). For this reason, we considered the risk of bias in this domain as high for these studies.
There was insufficient information available to assess the risk of carry‐over effect in the remaining studies (Khraishi 2012; Schemmann 2013; Sun 2013a; Sun 2013b). Therefore, we judged this domain as unclear.
Only first period data available
Ainsworth 2013, Brunger 2015, Bush 2013, Garcia‐Palacios 2014, Kim 2014 and Salaffi 2013 included data from both sampling periods in their statistical analyses. Therefore, we judged the risk of bias in this domain as low for these studies.
There was insufficient information from the study reports of Khraishi 2012, Schemmann 2013, Sigaud 2014, Sun 2013a and Sun 2013b to assess the risk of bias in this domain (i.e., unclear risk of bias).
Correct statistical analysis
Ainsworth 2013 calculated the mean score differences between an app and a paper survey questionnaire. They also used a Spearman correlation coefficient to measure the similarity between scores across the two groups. Brunger 2015 calculated correlation coefficients between the two delivery modes. Bush 2013 calculated the mean score differences between the app, the laptop and the paper questionnaire, as well as the ICC coefficient. Similarly, Kim 2014 calculated the ICC coefficient and a two‐way random effect model to assess the data equivalence between an app and a paper questionnaire. Salaffi 2013 also calculated the mean score differences and the ICC coefficient when comparing an app versus a paper questionnaire. In addition, this study also used Bland‐Altman plots to assess data equivalence. Since all of these are acknowledged measures of data equivalence between alternative delivery modes (Coons 2009; Gwaltney 2008), we judged the risk of bias in this domain as low for all these studies.
Garcia‐Palacios 2014 used appropriate statistical methods; however, since they did not report data on mood assessments, and the data from seven participants were excluded from the analysis as they failed to attend the assessment appointment at the end of the first week of sampling, we judged its risk of bias in this domain as high.
There was insufficient information available from the study reports of Khraishi 2012, Schemmann 2013, Sigaud 2014, Sun 2013a and Sun 2013b for us to make an appropriate judgement of this domain. Therefore, we assessed the risk of bias for these studies as unclear.
Comparability of results with those from parallel trials
Ainsworth 2013 followed appropriate randomisation procedures, tested for the presence of carry‐over effect and had a washout period of one week. For these reasons, we concluded that the results from this study are comparable with those from parallel trials (i.e., low risk of bias).
Brunger 2015 recruited a small sample of participants (i.e., 18 participants). Bush 2013 did not test for carry‐over effect and had a washout period of only 90 minutes. Therefore, we concluded that the results from these studies are not comparable with those from parallel trials (i.e., high risk of bias).
The washout period in Salaffi 2013 was short (60 minutes). However, since they reported having conducted other activities to minimise the likelihood of this effect, we assessed this domain as unclear for this study.
There was insufficient information available from the remaining studies (Garcia‐Palacios 2014; Khraishi 2012; Kim 2014; Schemmann 2013; Sigaud 2014; Sun 2013a; Sun 2013b) to assess this domain appropriately (i.e., unclear).
Effect of methods
We originally intended to collect data on four primary outcomes (i.e., data equivalence, data accuracy, data completeness and response rates) and three secondary outcomes (i.e., time taken to complete a survey questionnaire, adherence to the data collection protocol and acceptability). However, none of the included studies measured data accuracy or response rates. Therefore, we reported five systematic review outcomes. To facilitate the interpretation of our results, we reported the results from studies conducted in a controlled setting (lab or clinic) separately from those conducted in a naturalistic setting. Furthermore, within each setting, we reported our systematic review outcomes according to the type of comparison made (e.g., app versus paper).
We observed a considerable degree of clinical diversity between the included studies. Most used smartphones (Ainsworth 2013; Bush 2013; Garcia‐Palacios 2014; Kim 2014; Lamber 2012; Sigaud 2014; Stomberg 2012; Sun 2013a; Sun 2013b), with five studies using tablets (Brunger 2015; Khraishi 2012; Newell 2015; Salaffi 2013; Schemmann 2013). There was also variation in the OS platforms: iOS (Brunger 2015; Bush 2013; Khraishi 2012; Newell 2015; Stomberg 2012), Android (Ainsworth 2013; Salaffi 2013; Stomberg 2012), Windows Mobile (Garcia‐Palacios 2014) and Symbian (Lamber 2012). These differences in the technical specifications of the handsets and in the user interfaces between OSs could affect users' interaction with the survey questionnaire and the responses collected. In addition, there were differences in the duration and frequency of the sampling protocols. Most studies sampled participants for one day (Brunger 2015; Bush 2013; Khraishi 2012; Kim 2014; Lamber 2012; Newell 2015; Salaffi 2013; Schemmann 2013; Sun 2013a; Sun 2013b). Ainsworth 2013, Garcia‐Palacios 2014 and Stomberg 2012 sampled participants for a week (three or four times a day), and Sigaud 2014 for three months (frequency not specified). In relation to the characteristics of participants, only two studies recruited participants who were not adults (i.e., between four and 18 years old) (Sun 2013a; Sun 2013b). The remaining studies recruited adult participants (Ainsworth 2013; Brunger 2015; Bush 2013; Garcia‐Palacios 2014; Khraishi 2012; Kim 2014; Lamber 2012; Newell 2015; Salaffi 2013; Schemmann 2013; Sigaud 2014; Stomberg 2012). Moreover, one study recruited healthy participants from a military facility in the USA (Bush 2013). Two other studies recruited healthy participants (Brunger 2015; Newell 2015). The remaining studies recruited participants from diverse clinical populations: psychiatry (Ainsworth 2013), rheumatology (Garcia‐Palacios 2014; Khraishi 2012; Salaffi 2013; Schemmann 2013), surgery (Stomberg 2012; Sun 2013a; Sun 2013b), urology (Kim 2014), oncology (Lamber 2012) and haematology (Sigaud 2014).
Similarly, we observed considerable methodological diversity between the included studies. Overall, nine studies used validated instruments (Brunger 2015; Khraishi 2012; Kim 2014; Lamber 2012; Newell 2015; Salaffi 2013; Schemmann 2013; Sun 2013a; Sun 2013b), two studies used composite instruments derived from validated scales (therefore we considered them validated instruments) (Ainsworth 2013; Bush 2013), two studies used non‐validated instruments (Sigaud 2014; Stomberg 2012) and one study used PROMs with unclear validation status (Garcia‐Palacios 2014). The validated instruments varied in their intended clinical applications: functional status (Khraishi 2012; Salaffi 2013; Schemmann 2013), pain assessment (Sun 2013a; Sun 2013b), mental health assessment (Ainsworth 2013; Newell 2015; Bush 2013), symptom scores (Kim 2014), assessment of individual differences (Newell 2015), food consumption/appetite assessment (Brunger 2015) and health‐related quality of life (Kim 2014; Lamber 2012). In relation to the study methodology, 10 studies used a crossover study design (Ainsworth 2013; Bush 2013; Garcia‐Palacios 2014; Khraishi 2012; Kim 2014; Salaffi 2013; Schemmann 2013; Sigaud 2014; Sun 2013a; Sun 2013b), three studies conducted RCTs (Lamber 2012; Newell 2015; Stomberg 2012), and one study used a paired repeated‐measures crossover study design (Brunger 2015). The most common comparator for the app was paper (Bush 2013; Garcia‐Palacios 2014; Khraishi 2012; Kim 2014; Lamber 2012; Newell 2015; Salaffi 2013; Schemmann 2013; Sigaud 2014; Stomberg 2012; Sun 2013a), followed by laptop (Bush 2013; Lamber 2012), SMS (Ainsworth 2013), PDA (Brunger 2015) and plastic (Sun 2013b). Concerning data collection settings, four studies were conducted in naturalistic settings (Ainsworth 2013; Garcia‐Palacios 2014; Sigaud 2014; Stomberg 2012), whereas the remainder were conducted in controlled settings. Lastly, we assessed differences in outcome definitions, of which acceptability displayed the highest degree of variability. Each study author considered different dimensions of acceptability, and used their own purpose‐built survey questionnaire to measure it.
In addition, we had concerns regarding the methodological quality of the included studies after revisiting our 'Risk of bias' assessment: Lamber 2012 and Stomberg 2012 were considered to have high risk of bias for five domains, while Newell 2015 for four domains. In addition, there was significant uncertainty for the most crossover trials.
We grouped studies according to the age group of their participants, the validation status of the survey questionnaires and the type of comparisons made as an attempt to reduce the clinical and methodological diversity. However, we still observed considerable diversity after grouping the studies, and there were few studies left in each group to make meaningful comparisons.
This combination of between‐studies heterogeneity, concerns about biases and the number of studies in each category prompted us not to conduct a meta‐analysis.
Controlled‐setting studies
App versus paper
Primary outcomes
Data equivalence
Concerning validated survey questionnaires with adult participants, Bush 2013 did not find any statistically significant difference in the mean responses of seven symptom dimensions between an app and a paper questionnaire (see Analysis 1.1):
1.1. Analysis.
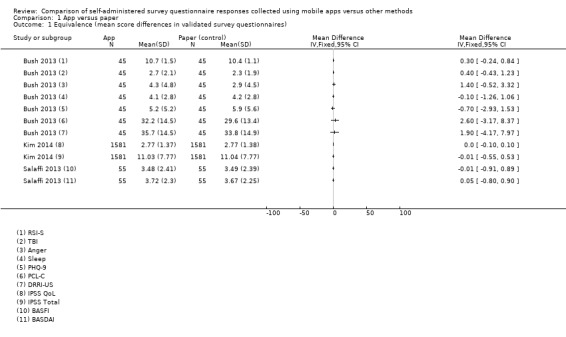
Comparison 1 App versus paper, Outcome 1 Equivalence (mean score differences in validated survey questionnaires).
MDPCL‐C = 2.60, 95% CI ‐3.17 to 8.37;
MDPHQ‐9 = ‐0.70, 95% CI ‐2.93 to 1.53;
MDRSI‐S = 0.30, 95% CI ‐0.24 to 0.84;
MDDRRI‐US = 1.90, 95% CI ‐4.17 to 7.97;
MDAnger = 1.40, 95% CI ‐0.52 to 3.32;
MDSleep = ‐0.10, 95% CI ‐1.26 to 1.06; and
MDTBI = 0.40, 95% CI ‐0.43 to 1.23.
These study authors also found that, with the exception of anger, the ICC coefficient for all symptom dimensions exceeded the recommended threshold of 0.70:
ICCPCL‐C = 0.90, 95% CI 0.85, 0.96;
ICCPHQ‐9 = 0.92, 95% CI 0.87, 0.96;
ICCRSI‐S = 0.86, 95% CI 0.79, 0.94;
ICCDRRI‐US = 0.81, 95% CI 0.71, 0.91;
ICCAnger = 0.67, 95% CI 0.51, 0.93;
ICCSleep = 0.95, 95% CI 0.92, 0.98; and
ICCTBI = 0.88, 95% CI 0.82, 0.95.
Khraishi 2012 found no statistically significant difference in the HAQ scores between the two delivery modes (95% CI ‐0.159 to 0.345; P = 0.459).
Kim 2014 found no difference in the IPSS and IPSS QoL scores between an app and a paper questionnaire (see Analysis 1.1):
MDIPSS = ‐0.01, 95% CI ‐0.55, 0.53; and
MDIPSS QoL = 0.00, 95% CI ‐0.10, 0.10.
When assessing the ICC, Kim 2014 found that the coefficient for the total IPSS score exceeded 0.70 (ICC = 0.935, 95% CI 0.927, 0.941; P < 0.001).
Newell 2015 found no statistically significant differences in the mean scores of three survey questionnaires between an app and paper:
CES‐D: MeanApp = 1.21 (0.54), MeanPaper = 1.10 (0.54); t = 1.33, P = 0.19;
RFQ‐Promotion: MeanApp = 19.85 (3.04), MeanPaper = 20.09 (3.04); t = 0.53, P = 0.59; and
RFQ‐Prevention: MeanApp = 15.93 (3.37), MeanPaper = 16.19 (3.37); t = 0.48, P = 0.63.
Salaffi 2013 found no statistically significant difference in the mean BASFI and BASDAI scores between a tablet and a paper questionnaire (see Analysis 1.1)
MDBASFI = ‐0.01, 95% CI ‐0.91 to 0.89; and
MDBASDAI = 0.05, 95% CI ‐0.80 to 0.90.
In this study, the ICC coefficient for each instrument exceeded the 0.70 threshold:
ICCBASFI = 0.90, 95% CI 0.88 to 0.93; and
ICCBASDAI = 0.94, 95% CI 0.92 to 0.96.
Schemmann 2013 found that the ICC coefficients between a tablet version and a paper version of the iHOT‐12 were 0.96 and 0.92 for the pain and function domains, respectively.
Regarding validated instruments in participants aged 18 years or younger, Sun 2013a found that the correlation coefficient of FPS‐R scores between the Panda app and the paper version exceeded the 0.60 recommended threshold (Pearson's r > 0.9). As reported by Sun 2013a, "Mean differences were within +/‐0.24 and 95% limits of agreement within ‐1.57 to +1.97".
Secondary outcomes
Time to completion
Khraishi 2012 did not find a statistically significant difference between app and paper in the mean time taken to complete the HAQ (95% CI ‐0.397 to 1.882; P = 0.193). Salaffi 2013 on the other hand, found a statistically significant difference that favoured the app (MD = ‐2.80 minutes, 95% CI ‐3.19 to ‐2.41; Analysis 1.5).
1.5. Analysis.
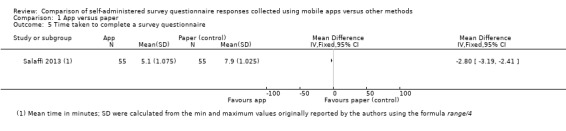
Comparison 1 App versus paper, Outcome 5 Time taken to complete a survey questionnaire.
Acceptability
In relation to preference, 73% of participants in Bush 2013 indicated that they would use the iPhone if they were to complete the measures again and 76% of them would recommend the iPhone survey questionnaire (compared to 14% of participants indicating no preference, and no one willing to recommend the paper questionnaire). Khraishi 2012 found that 63% of their participants preferred the iPad version of the questionnaire; but, they did not indicate if the remaining 37% preferred the paper questionnaire or expressed no preference. Kim 2014 found that significantly more participants preferred the app mode to the paper questionnaire (OR = 4.25, 95% CI 3.63 to 4.97; see Analysis 1.7). Newell 2015 found that significantly more participants preferred the app to the paper questionnaire (OR = 3.73, 95% CI 2.30 to 6.03; see Analysis 1.7). Similarly, significantly more participants in Salaffi 2013 preferred the app to the paper questionnaire (OR = 543.32, 95% CI 30.79 to 9586,16; see Analysis 1.7). Additionally, 58% of participants in Schemmann 2013 preferred the tablet app; however, the percentage of participants preferring the paper questionnaire or showing no preference was not reported.
1.7. Analysis.
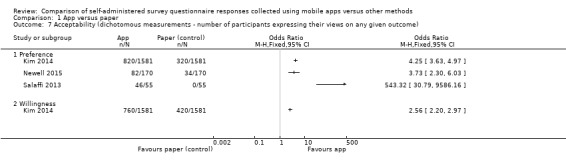
Comparison 1 App versus paper, Outcome 7 Acceptability (dichotomous measurements ‐ number of participants expressing their views on any given outcome).
Concerning ease of use, Khraishi 2012 found that 75% of participants rated the app version of the questionnaire as easier to use. Newell 2015 found no significant difference in the perceived difficulty in responding to a survey questionnaire between an app and paper (MeanApp = 1.31 (0.49), MeanPaper = 1.19 (0.58); t(100) = 1.75, P = 0.08, d = 0.18). Schemmann 2013 found that 42% of participants rated the tablet version of the questionnaire as easier to use; however, we are unsure if the remaining 58% found the paper version easier or expressed indifference. Using a five‐point rating scale, Lamber 2012 found no statistically significant differences between the delivery modes tested (MeanSmartphone = 4.55; MeanTablet = 4.44; MeanPaper = 4.74, MeanLaptop = 4.6; Mann‐Whitney tests, P > 0.05; SDs were not reported in the original publication). Moreover, Kim 2014 found that significantly more participants expressed their willingness to use the app version of the survey questionnaire compared to the paper version (OR = 2.56, 95% CI 2.20 to 2.97; see Analysis 1.7).
In relation to satisfaction and the effectiveness of the information provided by the system in helping users to complete the survey questionnaire, Lamber 2012 found no statistically significant differences between the satisfaction ratings on a five‐point scale between a smartphone, tablet, laptop and paper (MeanPaper = 4.42, MeanLaptop = 4.5, MeanSmartphone = 4.15, MeanTablet = 4.44; Mann‐Whitney tests, P > 0.05). However, they found a potentially significant difference in the mean scores of system informativeness that favoured the paper questionnaire when compared to the app (MeanSmartphone = 4.25, MeanPaper = 4.66; Mann‐Whitney tests, P = 0.05). Newell 2015 found a significant difference in the mean rating of a liking scale that favoured the app (MeanApp = 4.03 (0.81), MeanPaper = 3.65 (0.86); t(97) = 3.66, P < 0.01, d = 0.45). Concerning the effectiveness of the system informativeness, Newell 2015 found no statistically significant difference in the mean scores of a clarity/confidence scale between an app and paper (MeanApp = 4.43 (0.73), MeanPaper = 4.36 (0.68); ts = 0.43, Ps = 0.67, ds < 0.05).
Moreover, 72% of participants in Khraishi 2012 reported feeling that the iPad questionnaire took less time to complete than the paper questionnaire. In addition, 91% of participants in this study perceived the app as more beneficial than the paper questionnaire.
Newell 2015 found no statistically significant difference in the perceived ability to complete a survey questionnaire between an app and paper (MeanApp = 4.13 (0.85), MeanPaper = 4.13 (0.84); t(99) < 0.001, P > 0.99, d < 0.001).
Lastly, Sun 2013a found that statistically significant more children preferred the app version (Panda) of the FPS‐R to the original instrument (P < 0.01). However, no additional information is available from the study reports.
App versus laptop
Primary outcomes
Data equivalence
Bush 2013 found no statistically significant difference in the mean scores of each of four symptom dimensions (see Analysis 2.1):
2.1. Analysis.
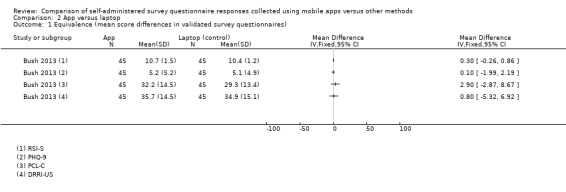
Comparison 2 App versus laptop, Outcome 1 Equivalence (mean score differences in validated survey questionnaires).
MDPCL‐C = 2.90 [95% CI ‐2.87, 8.67];
MDPHQ‐9 = 0.10 [95% CI ‐1.99, 2.19];
MDRSI‐S = 0.30 [95% CI ‐0.26, 0.86]; and
MDDRRI‐US = 0.80 [95% CI ‐5.32, 6.92].
Similarly, the ICC coefficient for each dimension exceeded the 0.70 recommended threshold:
ICCPCL‐C = 0.92 [95% CI 0.87, 0.96];
ICCPHQ‐9 = 0.94 [95% CI 0.90, 0.97];
ICCRSI‐S = 0.87 [95% CI 0.80, 0.94]; and
ICCDRRI‐US = 0.93 [95% CI 0.90, 0.97].
Secondary outcomes
Acceptability
In relation to preference, Bush 2013 found that only 13% of participants would use the computer if they were to complete the measurements again, and 11% would recommend the laptop (compared to 73% of participants indicating that they would use the iPhone if they were to complete the measures again and 76% of them would recommend the iPhone survey questionnaire).
Using a five‐point rating scale, Lamber 2012 found no statistically significant differences in the ease of use between the delivery modes tested: MeanSmartphone = 4.55; MeanTablet = 4.44; MeanPaper = 4.74, MeanLaptop = 4.6; Mann‐Whitney tests, P > 0.05 (SDs were not reported in the original publication).
Lastly, Lamber 2012 found no statistically significant differences between the satisfaction ratings on a five‐point scale between a smartphone, tablet, laptop and paper: MeanPaper = 4.42, MeanLaptop = 4.5, MeanSmartphone = 4.15, MeanTablet = 4.44; Mann‐Whitney tests, P > 0.05. Similarly, they did not find a significant difference in the mean scores of system informativeness between smartphone, tablet and laptop: MeanSmartphone = 4.25, MeanTablet = 4.42, MeanLaptop = 4.46; Mann‐Whitney tests, P > 0.05).
App versus tablet
Secondary outcomes
Acceptability
Using a five‐point rating scale, Lamber 2012 found no statistically significant differences in the ease of use between the delivery modes tested: MeanSmartphone = 4.55; MeanTablet = 4.44; MeanPaper = 4.74, MeanLaptop = 4.6; Mann‐Whitney tests, P > 0.05 (SDs were not reported in the original publication). In addition, they found no statistically significant differences between the satisfaction ratings on a five‐point scale between a smartphone, tablet, laptop and paper: MeanPaper = 4.42, MeanLaptop = 4.5, MeanSmartphone = 4.15, MeanTablet = 4.44; Mann‐Whitney tests, P > 0.05. Lastly, they did not find a significant difference in the mean scores of system informativeness between smartphone, tablet and laptop: MeanSmartphone = 4.25, MeanTablet = 4.42, MeanLaptop = 4.46; Mann‐Whitney tests, P > 0.05.
App versus PDA
Primary outcomes
Data equivalence
Brunger 2015 found that the correlation coefficients between an app and a PDA (iPAQ) for each of five questions assessing participants' appetite/satiety exceeded the 0.60 recommended threshold:
How hungry do you feel? = 0.83 (SEM 0.04; range 0.27 to 0.94);
How full do you feel? = 0.76 (SEM 0.08; range ‐0.23 to 0.98);
How satiated are you? = 0.84 (SEM 0.05; range 0.17 to 0.98);
How strong is your desire to eat? = 0.85 (SEM 0.05; range 0.16 to 0.99); and
How much could you eat? = 0.87 (SEM 0.04; range 0.73 to 0.99).
App versus plastic
Primary outcomes
Data equivalence
Sun 2013b found that the correlation coefficient between the CAS scores using the Panda app and the original plastic instrument exceeded the 0.60 recommended threshold (Pearson's r > 0.9). However, the study authors found that the mean Panda CAS scores were higher than the plastic scores for all pairs of assessments: MD = 0.31, 95% CI ‐1.52 to 2.17; P < 0.03.
Secondary outcomes
Acceptability
Sun 2013b found that statistically significantly more children preferred the app version (Panda) of the CAS to the original instruments (P < 0.01). However, no additional information is available from the study reports.
Uncontrolled‐setting studies
App versus paper
Primary outcomes
Data equivalence
Regarding non‐validated survey questionnaires, Garcia‐Palacios 2014 found no statistically significant differences in the mean pain scores and mean fatigue scores between an app and a paper questionnaire (see Analysis 1.2):
1.2. Analysis.
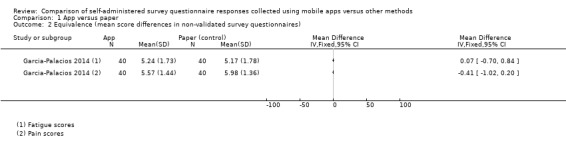
Comparison 1 App versus paper, Outcome 2 Equivalence (mean score differences in non‐validated survey questionnaires).
MDPain = 0.41, 95% CI ‐1.02 to 0.20; and
MDFatigue = 0.07, 95% CI ‐0.70 to 0.84.
In addition, the correlation coefficient for each of these domains exceeded the recommended threshold of 0.60:
rPain = 0.79 (P < 0.001); and
rFatigue = 0.88 (P < 0.001).
Data completeness
Garcia‐Palacios 2014 found that compared to paper questionnaires, using an app resulted in significantly more complete records: MD = 7.08, 95% CI 2.90 to 11.26; see Analysis 1.3). Similarly, they found that there were fewer incomplete records when using the app (MD not estimable; Analysis 1.4; t = 5.642, P < 0.01 as reported by the study authors).
1.3. Analysis.
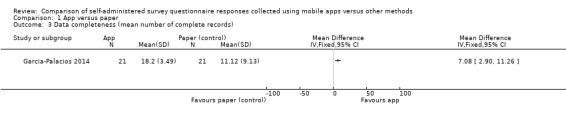
Comparison 1 App versus paper, Outcome 3 Data completeness (mean number of complete records).
1.4. Analysis.
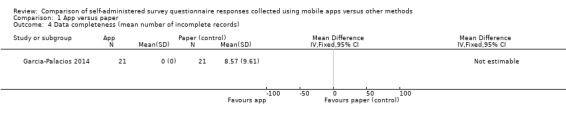
Comparison 1 App versus paper, Outcome 4 Data completeness (mean number of incomplete records).
Secondary outcomes
Adherence to sampling protocols
Sigaud 2014 found a statistically significant difference in the rate of diary completion that favoured the B‐CoNect app (P = 0.0398). In addition, they found a statistically significant difference in the adjusted mean of the intra‐individual difference of completion rate that favoured the smartphone app (‐19.5, 95% CI ‐38.1 to ‐0.9). Stomberg 2012 measured the difference in the mean number of entries (as a result of responding to the smartphone alerts or adhering to the sampling protocol) between a mobile phone support system (Medipal) and a paper questionnaire. They found that the mean number of entries on day 1 after surgery was lower in the smartphone group than in the control group (35 and 41 responses, respectively). On days 2 to 4 of sampling, the response rates were 100% for both groups. Finally, on days 5 and 6 of sampling, the response rates were 69% for the smartphone group; patients in the control group were sampled for four days.
Acceptability
Concerning preference, Garcia‐Palacios 2014 used a five‐point scale (where one was totally agree, and five was totally disagree) to assess preference for a delivery mode and found no statistically significant difference between an app and a paper instrument: MD = ‐0.43, 95% CI ‐0.91 to 0.05; see Analysis 1.6).
1.6. Analysis.
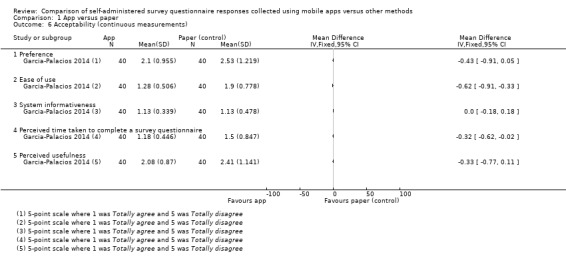
Comparison 1 App versus paper, Outcome 6 Acceptability (continuous measurements).
With regard to ease of use, Garcia‐Palacios 2014 found a statistically significant difference in the mean ratings of ease of use that favoured the app: MD = ‐0.62, 95% CI ‐0.91 to ‐0.33; see Analysis 1.6).
Moreover, Sigaud 2014 found that 75% of their participants were willing to replace the paper diary with the smartphone app. They also found that 79.2% of participants were satisfied with the smartphone app compared to the paper diary. Garcia‐Palacios 2014, on the other hand, found no significant difference in the perceived ease with which instructions could be followed (system informativeness) on an app compared to a paper survey questionnaire: MD = 0.00, 95% CI ‐0.18 to 0.18; see Analysis 1.6).
Garcia‐Palacios 2014 found a statistically significant difference in the mean ratings (on a five‐point scale where one was totally agree and five was totally disagree) of the perceived time taken to answer the questions that favoured the app (Question "I could answer fast"; MD = ‐0.32, 95% CI ‐0.62 to ‐0.02; see Analysis 1.6).
Lastly, Garcia‐Palacios 2014 found no statistically significant difference in the mean ratings (on a five‐point scale where one was totally agree and five was totally disagree) of perceived usefulness: MD = ‐0.33, 95% CI ‐0.77 to 0.11; see Analysis 1.6).
App versus SMS
Primary outcomes
Data equivalence
Concerning validated instruments, Ainsworth 2013 found no significant difference in the mean scores of six symptom dimensions between an app and an SMS‐based survey questionnaire (see Analysis 3.1):
3.1. Analysis.
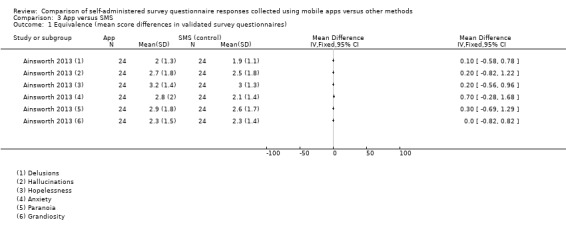
Comparison 3 App versus SMS, Outcome 1 Equivalence (mean score differences in validated survey questionnaires).
MDHallucinations 0.20, 95% CI ‐0.82 to 1.22;
MDAnxiety = 0.70, 95% CI ‐0.28 to 1.68;
MDGrandiosity = 0.00, 95% CI ‐0.82 to 0.82;
MDDelusions = 0.10, 95% CI ‐0.58 to 0.78;
MDParanoia = 0.30, 95% CI ‐0.69 to 1.29; and
MDHopelessness = 0.20, 95% CI ‐0.56 to 0.96.
Data completeness
Ainsworth 2013 found statistically significant differences in the mean number of daily entries between an app and an SMS‐only survey questionnaire for days 1, 2, 4, 5 and 6 of the sampling period (see Analysis 3.2):
3.2. Analysis.
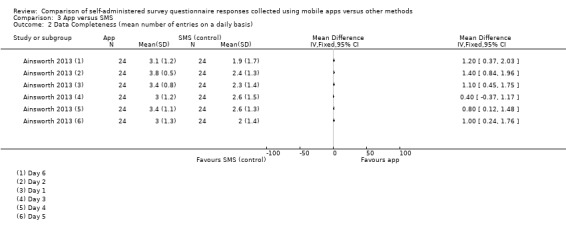
Comparison 3 App versus SMS, Outcome 2 Data Completeness (mean number of entries on a daily basis).
MDDay 1 = 1.10, 95% CI 0.45 to 1.75;
MDDay 2 = 1.40, 95% CI 0.84 to 1.96;
MDDay 4 = 0.80, 95% CI 0.12 to 1.48;
MDDay 5 = 1, 95% CI 0.24 to 1.76; and
MDDay 6 = 1.20, 95% CI 0.37 to 2.03.
The difference in the mean number of entries on day 3 was not statistically significant: MDDay 3 = 0.40, 95% CI ‐0.37 to 1.17; see Analysis 3.2).
Secondary outcomes
Time to completion
When compared to SMS, Ainsworth 2013 found a statistically significant difference in the mean time taken to complete a question set that favoured the app: MD = ‐4.29 min, 95% CI ‐5.29 to ‐3.28; see Analysis 3.3).
3.3. Analysis.
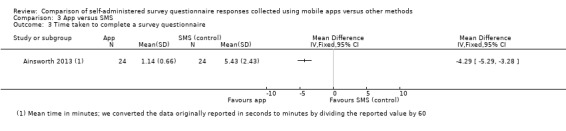
Comparison 3 App versus SMS, Outcome 3 Time taken to complete a survey questionnaire.
Adherence to sampling protocol
Ainsworth 2013 evaluated the effect of delivering a survey questionnaire via an app with an SMS‐only version of the same questionnaire on the proportion of individuals who completed at least one‐third of all possible data collection points, and found no statistically significant differences: OR = 1.84, 95% CI 0.39 to 8.77; see Analysis 3.4).
3.4. Analysis.
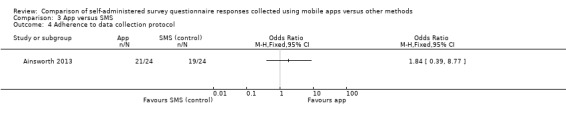
Comparison 3 App versus SMS, Outcome 4 Adherence to data collection protocol.
Acceptability
Ainsworth 2013 found that significantly more participants preferred an app to an SMS‐only questionnaire: OR = 14, 95% CI 3.19 to 61.36; see Analysis 3.5). Furthermore, they found that significantly more people found the app easier to use than SMS (OR = 12.14, 95% CI 3.03 to 48.67; see Analysis 3.5). In addition, Ainsworth 2013 found no significant difference in the imagined length of time that participants would be willing to use the app or the SMS (see Analysis 3.5):
3.5. Analysis.
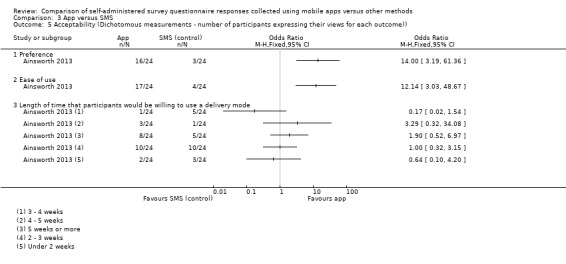
Comparison 3 App versus SMS, Outcome 5 Acceptability (Dichotomous measurements ‐ number of participants expressing their views for each outcome)).
OR< 2 weeks = 0.64, 95% CI 0.10 to 4.20;
OR2 to 3 weeks = 1.00, 95% CI 0.32 to 3.15;
OR3 to 4 weeks = 0.17, 95% CI 0.02 to 1.54;
OR4 – 5 weeks = 3.29, 95% CI 0.32 to 34.08; and
OR5+ weeks = 1.90, 95% CI 0.52 to 6.97.
The study authors did not find a significant difference in the mean overall scores of a quantitative feedback questionnaire measuring the reactivity to the delivery mode and the successful integration of the delivery mode into the patient’s daily routine either: MD = ‐3.20, 95% CI ‐10.44 to 4.04; see Analysis 3.6).
3.6. Analysis.
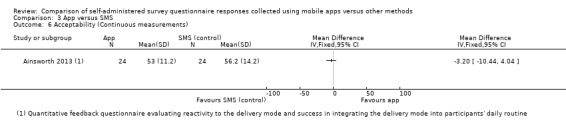
Comparison 3 App versus SMS, Outcome 6 Acceptability (Continuous measurements).
Discussion
Summary of main results
The objective of this Cochrane review was to assess the impact of delivering app‐based self‐administered survey questionnaires on the quality of the responses collected. We chose data equivalence, data accuracy and time taken to complete the survey questionnaire as indicators of measurement error; and selected data completeness, response rates and adherence to sampling protocols as indicators of representational errors. In addition, we assessed the impact of this delivery mode on the acceptability to respondents, as this factor is thought to influences the success of an intervention.
We reported our results according to the setting in which the included studies were conducted, separating controlled and uncontrolled settings. The former refer to locations where healthcare, social care, community care or research activities take place (e.g., a GP waiting area or a hospital ward). In these settings, researchers or healthcare practitioners, or both, are typically better able to control for potential confounders, such as device used, social context and noise levels. However, there might be certain situations in which confounders cannot be controlled, such as respondents talking to each other whilst completing a survey questionnaire in a busy GP waiting area. Uncontrolled settings refer to locations outside a medical or research facility, such as a patient's home, where the conditions (e.g., time of day, geographic location, social context, conflicting priorities) in which survey completion takes place may vary across respondents, and between multiple instances of a survey completed by the same respondent. For us, this division represents a key scenario that researchers using the quantitative survey method must face when designing their studies. In addition, within each setting, we reported our results according to the types of comparison made.
We observed differences between these two settings in the outcomes reported. Data equivalence, time taken to complete a survey questionnaire and acceptability to respondents were reported in both controlled and uncontrolled settings. However, only some studies conducted in uncontrolled settings reported data completeness and adherence to sampling protocols. Regarding data equivalence, our findings suggest that survey questionnaire responses collected via apps are equivalent to responses collected via other delivery modes. Studies in controlled settings found that, regardless of the age group and health status of the participants, there were no differences in the mean overall scores between apps and other delivery modes (i.e., paper, laptop, PDA and plastic items/toys) and that all correlation coefficients exceeded the recommended thresholds of 0.70 for ICC and 0.60 for other correlation coefficients. Similarly, studies in uncontrolled settings found no significant differences in the mean overall scores between apps and alternative delivery modes (i.e., paper and SMS), and that correlation coefficients exceeded the recommended threshold of 0.60.
While these findings suggest that data equivalence is likely between apps and non‐electronic modes, methodological differences between these settings highlight key issues around validity. Survey questionnaires in both settings were used to collect data over a pre‐specified period to inform clinical decisions. While studies in controlled settings used validated survey questionnaires during one‐off patient visits to clinics, studies in uncontrolled settings implemented longer sampling periods with higher sampling frequency using primarily non‐validated survey questionnaires. Only Ainsworth 2013 used a collection of validated scales for mental health assessment. The lack of validated instruments in uncontrolled settings may indicate that apps are an appropriate delivery mode as long as the original validation setting, intended clinical application and intended frequency of administration of a survey questionnaire remain unchanged. When choosing a survey questionnaire for their study, researchers should consider if the original circumstances in which an instrument was validated resemble the circumstances outlined in their study protocol.
Our findings also suggest that the adaptation of a survey questionnaire to a new delivery mode involves decisions about questionnaire design and questionnaire layout. Kim 2014, Lamber 2012, Salaffi 2013 and Stomberg 2012 presented one question per page, which may be ideal when using small screen devices. In addition, Brunger 2015 assessed how the length of a horizontal line can affect participants' responses: although they found that responses collected using an iPad were equivalent to those collected using a PDA, the ratings made on the iPad were more sensitive to subtle differences in hunger, desire to eat and amount they could consume. Furthermore, the adaptation process also involves decisions about data collection techniques that are appropriate to the study protocol. Studies conducted in uncontrolled settings implemented EMA and diary techniques, which may be better suited when respondents are required to incorporate repeated, longitudinal data collection to their daily routines. Moreover, Ainsworth 2013 split their questionnaire into small question sets and delivered one set during each sampling instance in order to minimise the burden on respondents. Therefore, researchers may need to consider new ways of designing survey questionnaires that take into account the technical specifications and usage patterns of consumer smart devices, as well as the data collection requirements of the study, in order to minimise the cognitive burden placed on respondents and thus facilitate survey completion.
Concerning the time taken to complete a survey questionnaire in controlled settings, Khraishi 2012 and Salaffi 2013 compared an app to paper in rheumatology patients. While Salaffi 2013 found that an app was faster, Khraishi 2012 found no differences between the delivery modes. This discrepancy could be explained by differences in app functionality: features (such as question branching, skip procedures, and audio‐recorded instructions with replay options implemented by Salaffi 2013) that might have facilitated response generation, resulting in faster completion times. This discrepancy could also be a product of impaired usability due to poor implementation of design strategies, particularly for patients with psoriatic and rheumatoid arthritis recruited in Khraishi 2012. For example, studies have shown that the touch characteristics of patients with fine‐ and gross‐motor impairments can be affected by interface design (e.g., button size) during digit entry tasks conducted on a touch screen (Sesto 2012). Differences between Khraishi 2012 and Salaffi 2013 in the length and type of questions could also account for the discrepant results. In uncontrolled settings, Ainsworth 2013 found that, compared to SMS, an app resulted in faster survey completion times; this finding could also be explained in terms of app functionality and human computer interaction (HCI) factors, although the study authors did not explore this possibility. Regardless of the study setting, our findings raise issues around functionality, HCI and medical condition as factors that could affect respondents' interaction with an app‐based survey questionnaire.
Regarding acceptability, each study used different definitions. Defined as preference, our findings showed that significantly more respondents in controlled settings preferred an app to other delivery modes, whereas in uncontrolled settings the results are contradictory: Ainsworth 2013 found that significantly more people preferred an app to SMS, and Garcia‐Palacios 2014 found no significant difference between an app and paper. In terms of ease of use, there were no clear differences between an app and other delivery modes when evaluated in controlled settings: Khraishi 2012 found that significantly more respondents found the app easier to use, Schemmann 2013 did not report the results for the comparison group, and Lamber 2012 and Newell 2015 found no significant difference between delivery modes. In uncontrolled settings however, significantly more respondents found an app easier to use. In both settings, significantly more respondents reported their willingness to use an app, compared to other delivery modes. Significantly more respondents in uncontrolled settings were satisfied with an app, whereas there were no clear differences in controlled settings. Lamber 2012 found that the system informativeness of a paper survey questionnaire was superior to that of an app when used in a controlled setting; Garcia‐Palacios 2014 and Newell 2015 on the other hand, found no statistically significant difference in system informativeness between an app and paper. Ainsworth 2013 considered dimensions of acceptability that seem relevant only to repeated survey completion in uncontrolled settings: maximum length of time that participants would be willing to use a delivery mode, and reactivity to the delivery mode and its successful integration into respondents' daily routine. These findings serve to highlight the multi‐faceted nature of acceptability, and question the usefulness of this outcome in producing lessons that could be applied across studies. If anything, this outcome might be a useful guide to identify usability issues that could affect the successful adoption of apps as a delivery mode for survey questionnaires, particularly in situations where busy staff members might not be able to assist respondents or where stand‐alone instruments are crucial.
Data completeness and adherence to the sampling protocol were only reported by some of the studies in uncontrolled settings. The two studies measuring data completeness found that an app resulted in significantly more complete records than paper (Garcia‐Palacios 2014), and in significantly more data entries than with an SMS‐based survey questionnaire (Ainsworth 2013). These findings were obtained despite offering incentives to all participants. These results could be related to the implementation of certain functionality, human computer interaction factors or additional interventions; however, the study authors did not explore the impact of these features on data completeness. For example, studies did not explore if alerts or reminders addressed issues of incomplete data due to forgetfulness. In other fields, these features have been found to improve adherence to antiretroviral therapy in patients with HIV (Rodrigues 2012) or increase sunscreen use (Armstrong 2009) in at‐risk groups. Additionally, these studies did not explore the possibility that certain functionality, human computer interaction factors or additional interventions could have influenced patient motivation, therefore improving data completeness. The differential reporting of data completeness between study settings suggest that this outcome may only be relevant in clinical scenarios requiring longitudinal, repeated data collection. Moreover, data completeness could be better conceptualised in terms of the minimum amount of information required by the end user (in this case, clinicians) to inform their decisions. Our findings may also indicate that apart from reminders and alerts, researchers have limited access to other failsafe strategies (e.g., bringing those missing responses to respondents' attention) to ensure data completeness in uncontrolled settings (compared to controlled settings).
Both Ainsworth 2013 and Stomberg 2012 measured adherence to the sampling protocol and found no statistically significant difference between an app, and SMS or paper. Sigaud 2014, on the other hand, found that adherence to an app‐based diary was better than for a paper diary. In addition to the factors mentioned previously (i.e., functionality, human computer interaction and additional interventions), the characteristics of the clinical population from which participants were recruited should be explored as potential causes for these apparent differences. For example, the delivery mode might not affect respondents' adherence if there is an immediate, short‐term goal (such as monitoring post‐surgical pain levels) common to both groups of participants. Conversely, regardless of the delivery mode, regular self monitoring might not be appropriate for certain medical conditions. For example, some participants (with schizophrenia) in Ainsworth 2013 reported mild negative reactivity to the continuous monitoring of their symptoms.
None of the included studies, whether conducted in controlled or uncontrolled settings, measured data accuracy or response rates. The lack of studies measuring data accuracy might reflect the types of survey questionnaires and response scales used, for which it is not possible to define correct answers given the subjective nature of the attributes they assess (e.g., responses to the PHQ‐9 or to perceived levels of pain). This issue needs to be explored before we are able to study differences in data accuracy between controlled and uncontrolled settings. Response rates have traditionally been used to assess the quality of a survey, and it often raises the question of whether respondents differ significantly from non‐respondents. This outcome might have not been relevant for the scenarios included in this systematic review as most participants in both settings were approached and recruited as part of their routine clinical care (i.e., under controlled conditions). To further advance this area, we need to understand if consumer smart devices could be used as a tool to invite and recruit potential respondents. If so, we would need to determine if these respondents are representative of the target population.
An incidental finding concerning measurement error was the comparison made by Garcia‐Palacios 2014 between aggregated levels of pain and fatigue collected throughout the sampling period using EMA techniques via an app, and the levels of pain and fatigue reported on recall‐based, validated instruments administered in the clinic at the end of each sampling period. For both symptom dimensions, participants significantly overestimated their overall assessments with the recall‐based survey questionnaire. Although this is a well‐known phenomenon in the survey methodology literature (Groves 2009; Tourangeau 2000), this finding (taken together with our findings on data accuracy and data completeness) suggests that an appropriate combination of data collection technique and delivery mode could address some of the limitations of the quantitative survey method.
Overall, although apps running on consumer smart devices are already being used for delivering self‐administered survey questionnaires in health‐related disciplines, the available evidence is not sufficient to draw conclusions regarding their impact on measurement errors due to the limited number of included studies and the levels of clinical and methodological diversity. Our preliminary findings suggest that apps might not affect data equivalence, at least for situations where the intended clinical application of the survey questionnaire, its intended frequency of administration and the setting in which it was validated remain unchanged. There was no data available on data accuracy, and findings on the time taken to complete a self‐administered survey questionnaire were contradictory. Concerning representational errors, there was no data on response rates; therefore, we are unable to assess if individuals who complete survey questionnaires via an app differ significantly from those using alternative modes of delivery. Furthermore, although apps might improve data completeness, there is not enough evidence to assess their impact on adherence to sampling protocols. None of the included studies assessed how elements of user interaction design, survey questionnaire design and intervention design might influence mode effects. In conclusion, those conducting research in public health and epidemiology should not assume that mode effects relevant to other delivery modes apply to apps running on consumer smart devices. Those conducting methodological research might wish to explore some of the issues highlighted by this Cochrane review.
Overall completeness and applicability of evidence
In this Cochrane review we considered situations in which the patient or respondent was the only generator of data. Situations where data were generated by the patient through an interviewer were not considered here. The presence of an interviewer adds an additional dimension to the complex interaction between the survey questionnaire, the respondent and the delivery mode which can result in different mode effects (Bowling 2005; Groves 2009). Therefore, the use of apps running on consumer smart devices to support interview‐based survey questionnaires should be explored separately.
The included studies assessed clinical scenarios in which self‐administered survey questionnaires were used to collect information to support a clinician‐led decision‐making process. Even though our Cochrane review included long‐term conditions (i.e., haematology, psychiatry and rheumatology), only one study considered a scenario reminiscent of patient self management (Sigaud 2014). Moreover, apart from treatment adherence, the clinical conditions evaluated here did not require regular self monitoring of lifestyle or behavioural changes. The fact that studies assessing self management apps have a different focus may explain this finding. For example, apps for asthma (Huckvale 2012), chronic pain (Wallace 2014) and diabetes (Eyler 2013) have been evaluated in terms of their compliance with evidence‐based guidelines, the comprehensiveness of the information they provide and the tools they offer. Moreover, we conducted a systematic review that evaluated the effectiveness of apps for supporting asthma self management (Marcano Belisario 2013); but our focus was on patient outcomes and not on data quality.
The clinical applications of the survey questionnaires included functional assessments, symptom scores, quality of life, pain assessment, mental health assessment, assessment of individual differences, food consumption/appetite assessment and treatment diaries. We believe these cover the range of tools available for collecting patient‐reported measures. In relation to the types of response scale, one study used a categorical scale and the remaining used continuous scales such as VAS, NRS, adjectival or Likert scales, and face scales. The reporting of how these scales where adapted for use in consumer smart devices was not consistent between the included studies, and was often insufficient. Moreover, the effect on responses of implementing different question and response formats for the same scales was not evaluated. This has two important implications. On the one hand, we are unable to work towards evidence‐based guidelines for the adaptation of conventional categorical and continuous scales to digital format. On the other hand, equivalence appears not to have been tested for non‐conventional scales that may be more challenging to adapt to a digital format. For example, scales requiring respondents to draw a figure or to add features to a drawing.
Concerning the characteristics of the participants, only Brunger 2015, Bush 2013 and Newell 2015 recruited healthy participants. The remaining studies recruited participants from a wide range of clinical populations: rheumatology, surgery, urology, oncology, psychiatry and haematology. Therefore, those intending to use consumer smart devices for collecting data from healthy individuals or from population groups not covered in this Cochrane review may need to consider that the factors motivating individuals to provide data may be different for each group. In addition, our results did not account for differences in the technological ability of the participants. Only four studies reported this information (Bush 2013; Garcia‐Palacios 2014; Lamber 2012; Newell 2015) and, with the exception of Lamber 2012, its impact on the outcomes of interest was not evaluated. Familiarity with a type of technology may impact how participants interact with it, and in this context affect respondents' willingness to engage with an app‐based survey questionnaire. There was limited information about participants' characteristics in the two studies that recruited underage participants (Sun 2013a; Sun 2013b); they also did not specify the type of surgery these patients underwent. Therefore, we are unable to comment of how app functionality and human computer interaction may operate differently in this age group.
In relation to the type of technology, we only evaluated native apps running on smartphones or tablets that became available on or after 2007. This resulted in the exclusion of: mobile self‐administered survey questionnaires rendered on web browsers or studies that used feature phones with internet capabilities; the use of alternative media for the delivery of questions and response options, such as SMS; manual or automated entry of data produced by medical devices with connectivity capabilities; and other forms of automated data collection, such as via wearable devices. The purpose of this decision was to control for potential confounders such as differences in usability between platforms and devices, differences in the technological capabilities of the devices and poor connectivity. Nonetheless, data collection through different types of consumer smart devices should be explored, as each of them constitutes a specific delivery mode with the potential to introduce different forms of mode effects.
We observed that different study authors developed apps for different types of devices (i.e., different models of smartphones and tablets) and for different versions of multiple platforms (i.e., Android, iOS, Symbian, Windows Mobile OS, Java‐enabled phones), which could present numerous challenges. Researchers may not be able to control how their survey questionnaires will render each time, as different devices often have different technical specifications. For example, the size of the screen may affect how much text can be displayed in a single screen, or it may mean that the same amount of text will be presented in a different font size depending on the device. Either scenario could result in usability issues due to the introduction of behaviours such as scrolling or zooming in. The rendering of the survey questionnaire can also be affected by the mode (i.e., portrait or landscape) in which the device is held. Moreover, the interaction with different types of devices may vary in terms of the location and duration of the interaction, the situational context in which it takes place and the frequency with which it takes place. For example, phones may be mostly used during a commute and tablets at home. This could alter the circumstances surrounding survey completion and introduce response effects. Different platforms may have different requirements for interface elements (e.g., button size, font‐family and spacing), which may affect usability. All these issues might impact on the generalisability of our findings and could be particularly relevant if apps for the delivery of self‐administered survey questionnaires are rolled out at the general population level.
There was insufficient documentation of the exact changes made to the original survey questionnaire during its adaptation for a new delivery mode. Similarly, there was insufficient documentation of the functionality, human computer interaction factors and additional interventions that were implemented; moreover, it is unclear how and how often these features were used and the issues experienced by both respondents and researchers as a result of their implementation. We believe this information could allow researchers to isolate the effects of specific design decisions.
In addition, none of the included studies took advantage of log data or data collected by built‐in sensors in order to understand how app functionality, human computer interaction factors and design decisions affect the survey completion process. With regard to functionality, log data could assist in understanding the navigation pattern within a survey (assuming that respondents are allowed to navigate freely between questions) and determine if respondents refer to a previously answered question in order to answer the current one. Log and sensor data could help to assess if variables such as time of day or location, or both, affect the effectiveness of human computer interaction factors (e.g., reminders). These data could also support the evaluation of how different design decisions (e.g., response formats) could affect data accuracy. In exploring these issues we could work toward the validation of certain theoretical models of response generation, best‐practice guidelines for survey questionnaire design and sampling protocols that are tailored to respondents' routines.
Lastly, our findings apply to studies conducted in high‐income countries, although Newell 2015 recruited their participants from disadvantaged rural communities in southern USA. There could be a number of additional factors (e.g., cultural) operating in other settings that could affect not only how individuals relate to this type of technology, but also the perceived role of these devices in healthcare. Therefore, the lessons of this Cochrane review may not be applicable to low‐ and middle‐income countries.
Quality of the evidence
Overall, all the included studies used the study designs and statistical methods recommended for the assessment of data equivalence. In relation to RCTs, Lamber 2012 presented a high risk of bias for five domains: random sequence generation, blinding of participants and personnel, blinding of outcome assessment, selective reporting and other biases. We were unable to assess its risk of bias for allocation concealment. Newell 2015 presented a high risk of bias for blinding of participants and personnel, blinding of outcome assessment, selective reporting and other bias. In addition, we were unable to assess the risk of bias for allocation concealment. Similarly, Stomberg 2012 presented a high risk of bias for blinding of participants and personnel, blinding of outcome assessment, incomplete outcome assessment, selective reporting and other biases. We were unable to assess its risk of bias for random sequence generation and allocation concealment. Furthermore, a better interpretation of their findings could have been achieved if both experimental groups had been exposed to the same sampling protocol.
Blinding was not possible in these studies as the delivery mode is immediately apparent; but, it would be important to document how the assignment to a particular delivery mode might affect participants' motivation to complete a survey questionnaire if they become aware of the other delivery modes being offered. Some participants in Stomberg 2012 expressed dissatisfaction at being allocated to the paper questionnaire, for example. Similarly, it would be important to assess if the lack of blinding results in frustration for outcome assessors who have to perform manual scoring and manual data entry of data collected with paper survey questionnaires, when they become aware of the availability of electronic versions of the same survey questionnaires.
Regarding crossover trials, only the results from Ainsworth 2013 and Kim 2014 were thought to be comparable to results from RCTs. Most other crossover studies did not have appropriate washout periods and did not formally test for carry‐over effects. We were unable to assess the risk of bias in different domains for some of the included crossover trials. However, we need to consider that this might not be due to methodological flaws in these studies, but rather due to the limited information available in publications such as conference proceedings or poster presentations, or both.
Most crossover trials calculated the recommended statistical indicators for data equivalence. Ainsworth 2013, Bush 2013, Khraishi 2012, Kim 2014 and Salaffi 2013 calculated differences in the mean overall scores obtained via two delivery modes. However, only Salaffi 2013 interpreted these differences in relation to not exceeding the MID (Coons 2009). It is also recommended that between‐mode differences in mean scores should be interpreted in relation to an estimate of within‐mode MD (Coons 2009). Only Bush 2013 followed these recommendations by comparing their MDs to between‐mode ICC coefficients and a test‐retest ICC coefficient within the iPhone mode. In all cases, the ICC coefficients exceeded the recommended threshold of 0.70 (Gwaltney 2008). In addition, Bush 2013, Kim 2014 and Salaffi 2013 compared their MDs to between‐mode ICC coefficients, all of which also exceeded 0.70. Schemmann 2013 only assessed a between‐mode ICC coefficient. The perceived advantage of using this indicator is that it accounts not only for the strength of the association between two modes, but also it considers the covariance and degree of agreement between score distributions (Coons 2009; Gwaltney 2008). This is different from other correlation coefficients, such as Pearson's r, which are not sensitive to systematic between‐group MDs and have the tendency to overestimate the level of agreement (Coons 2009). This was the measure chosen by Sun 2013a and Sun 2013b. Lastly, Brunger 2015 calculated correlation coefficients between delivery modes; however, they did not specify the coefficient used.
Potential biases in the review process
We have no potential biases to report.
Agreements and disagreements with other studies or reviews
Previous systematic reviews have compared paper and electronic devices as delivery modes for self‐administered survey questionnaires. Lane 2006 found that hand‐held computers are as effective as paper methods, are faster and are preferred by most users. Gwaltney 2008 found evidence supporting the equivalence between paper and electronic PROMs. Both Lane 2006 and Gwaltney 2008 found that electronic survey questionnaires resulted in improved adherence to sampling protocols. Unlike this Cochrane review, they only considered specialist handheld and computer devices that are not normally available to the general public. Our findings do not support their conclusion regarding adherence to sampling protocols.
Fan 2010 conducted a systematic review to identify the factors influencing response rates in web surveys during the stages of survey development, survey delivery, survey completion and survey return. They concluded that although several behavioural theories have been applied to the survey completion stage, more effort should be put into accumulating and synthesising empirical evidence on this process. We agree with their conclusions; however, the scope of our review differs from theirs in terms of type of delivery mode and outcomes.
Lastly, recent studies from survey methodology research have assessed data equivalence between mobile web surveys and computer web surveys using several experimental manipulations (Mavletova 2013; Mavletova 2014; Wells 2014). Mavletova 2013 compared the data quality of self‐administered web surveys completed via mobile phones to that of survey questionnaires completed on personal computers. They found that mobile surveys have lower completion rates, shorter length of open answers, and similar levels of socially undesirable and non‐substantive responses; no strong primacy effects were found in mobile web surveys. Mavletova 2014 evaluated the effect of questionnaire layout (scrolling versus page‐by‐page) and invitation mode (SMS versus email) on the response rates of mobile web surveys. They found that scrolling layouts resulted in faster completion times, lower breakoff rates, fewer technical problems and higher subjective ratings of the questionnaire; and SMS invitations were more effective than email invitations. Through different experimental manipulations, Wells 2014 found that, similar to other delivery modes, mobile survey responses are also susceptible to different presentations of frequency scales and to the size of open‐ended text boxes. They also found limited evidence for mode effect between apps and computer administrations of mobile surveys. We believe that health research could learn from these studies, particularly in terms of the experimental variations that we should be exploring (e.g., survey questionnaire layout or variation of interface elements). Moreover, these studies can inform strategies for improving response rates in mobile surveys (e.g., though SMS invitations), and for designing survey questionnaires (e.g., scrolling layouts may result in faster completion times).
Authors' conclusions
Implication for methodological research.
Our Cochrane review findings suggest that, at least in the settings evaluated, the delivery of self‐administered survey questionnaires via apps does not affect data equivalence and can improve data completeness. However, these findings might have important implications for our understanding of validity and reliability, particularly in relation to the influence that the data collection setting and the sampling protocol may have on survey questionnaire responses.
Most survey questionnaires evaluated in our included studies had been validated for use in clinical settings, and were intended to support a clinician‐led decision‐making process. In addition, although the repeated administration of these survey questionnaires can provide reliable estimates of the attributes under study, they have not been validated for intensive use (in terms of both sampling duration and sampling frequency). The majority of our included studies for example, required a one‐off sampling session; only four studies were conducted in a naturalistic setting, three of which sampled participants for one week with each delivery mode and only one required a sampling period of three months for each delivery mode. Therefore, it is unclear how the implementation of a repeated, long‐term data collection process may affect the survey completion process and the responses collected. We believe that understanding this process is a research priority, especially given the perceived advantage of consumer smart devices in enabling the convenient collection of survey data at anytime, anywhere.
Future research should attempt to (i) identify the characteristics of the setting (e.g., geolocation, temporal variation) that affect measurement error in survey questionnaires, (ii) understand how the intensity of the sampling protocol can affect responses, and (iii) revisit the suitability of current instruments (that have been validated in highly controlled settings) for the collection of valid and reliable data in uncontrolled settings. In addition, researchers need to clearly identify the intended end user of the information collected (e.g., clinicians, researchers or patients), and its intended use. This will provide them with a framework against which they can determine appropriate levels of data completeness and data accuracy.
Future research should also try to uncover how each element of the complex interaction between respondents, survey questionnaires and delivery mode can result in different measurement or representational errors. In relation to respondents, researchers need to understand how the health status and the characteristics of the participants might influence mode effects. The medical condition might affect patients' goals, and their motivation to regularly complete survey questionnaires. Understanding how different age groups react to apps also needs to be assessed. Even though our Cochrane review included both adult and underage participants, future studies should implement a more fine‐grained classification system of age groups that will be more informative for researchers. Similarly, we need to understand how a respondent's level of technical ability may influence their interaction with survey questionnaires running on apps. Researchers should also attempt to characterise participants who are more likely to own a consumer smart device and to agree to complete a survey questionnaire via an app, and determine how they differ from the target populations of interest.
In relation to survey questionnaires, future studies need to document the exact changes made to the original survey questionnaire during its adaption to a new delivery mode. This information could be used to assess how design choices influence survey questionnaire responses. For example, most of our included studies used NRS and adjectival/Likert scales. However, we were unable to determine if the implementation of these response scales with different data entry formats (e.g., checkboxes, drop‐down menus, and free text) results in some other form of mode effect. In addition, future studies should evaluate other types of response scales such as VAS, colour scales or face scales.
With regard to the delivery mode, we need to understand if the technical specifications of a device (such as screen size) and how the device is used (portrait versus landscape) affects survey questionnaire responses. Researchers in this field should provide detailed documentation of the functionality and the human computer interaction factors implemented in their apps, and of any additional interventions implemented in their studies. More importantly, we need to understand how functionality, human computer interaction factors and additional interventions could be used effectively in order to improve the quality of survey questionnaire responses (e.g., data completeness, and adherence to sampling protocols) by tackling respondent‐related barriers such as forgetfulness, lack of motivation and low levels of engagement.
There were inconsistencies between our included studies in the reporting of this information. However, if reported appropriately, information about the functions that were implemented, how and how often they were used, and the issues that respondents experienced when interacting with each of them might reveal different patterns of effect for outcomes such as data completeness and data accuracy. Similar lessons could be learned from a detailed reporting of the implementation and usage of human computer interaction factors. Log data could assist researchers in the evaluation of these potential effects. The detailed reporting of the implementation and usage of additional interventions could help identify the specific intervention components that are being modified when an app is introduced as a new delivery mode and, in some cases, to tease out the relative contribution of an app to any observed effects.
Lastly, this Cochrane review only identified studies conducted in high‐income countries. The implementation of similar strategies in LMICs needs to be preceded by a careful assessment of the health systems in which these apps will be deployed, and of any other contextual or cultural factor that may act as a barrier or a facilitator to the successful adoption of this technology.
Notes
None.
Acknowledgements
This work has been partly supported by the Imperial NIHR Biomedical Research Centre (BRC).
We acknowledge Aleš Porcnik and Andreja Saje for their support in the development of the Cochrane protocol. We also thank Barbara Fischinger (BF) for her help with citation screening.
Finally, we thank Mike Clarke for his support and advice throughout the Cochrane protocol development and the completion of this Cochrane review.
Appendices
Appendix 1. Ovid MEDLINE search strategy
1. exp Data Collection/
2. exp Self‐Assessment/
3. exp Health Status/
4. exp Medical Records Systems, Computerized/
5. data.mp.
6. information.mp.
7. diary.mp.
8. 5 or 6 or 7
9. acqui$.mp.
10. gain$.mp.
11. collect$.mp.
12. obtain$.mp.
13. gather$.mp.
14. captu$.mp.
15. entr$.mp.
16. keep$.mp.
17. input$.mp.
18. 9 or 10 or 11 or 12 or 13 or 14 or 15 or 16 or 17
19. 8 adj3 18
20. 1 or 2 or 3 or 4 or 19
21. exp Cellular Phone/
22. Computers, Handheld/
23. (handheld or hand‐held) adj1 (computer? Or pc?).mp.
24. cell$ phone.mp.
25. mobile phone?.mp.
26. smartphone?.mp.
27. smart‐phone.mp.
28. (“personal digital assistant” or PDA).mp.
29. “palmtop computer?”.mp.
30. (tablet adj3 (device? or comput$)).mp.
31. Blackberry.mp.
32. Nokia.mp.
33. Symbian.mp.
34. (windows adj3 (mobile? Or phone?)).mp.
35. INQ.mp.
36. HTC.mp.
37. sidekick.mp.
38. Android.mp.
39. iPhone?.mp.
40. iPad?.mp.
41. Samsung.mp.
42. 21 or 22 or 23 or 24 or 25 or 26 or 27 or 28 or 29 or 30 or 31 or 32 or 33 or 34 or 35 or 36 or 37 or 38 or 39 or 40 or 41
43. 20 and 42
44. Limit 43 to yr=”2007 – Current”
Appendix 2. Ovid EMBASE search strategy
1. exp information processing/
2. exp self evaluation/
3. exp health status/
4. exp electronic medical record/
5. data.mp.
6. information.mp.
7. exp self report/
8. exp questionnaire/
9. diary.mp.
10. 5 or 6 or 9
11. acqui$.mp.
12. gain$.mp.
13. collect$.mp.
14. obtain$.mp.
15. gather$.mp.
16. captu$.mp.
17. entr$.mp.
18. keep$.mp.
19. input$.mp.
20. 11 or 12 or 13 or 14 or 15 or 16 or 17 or 18 or 19
21. 10 adj3 20
22. 1 or 2 or 3 or 4 or 7 or 8 or 21
23. exp mobile phone/
24. exp microcomputer/
25. (handheld or hand‐held) adj1 (computer? Or pc?).mp.
26. cell$ phone.mp.
27. “mobile phone?”.mp.
28. smartphone?.mp.
29. smart‐phone.mp.
30. (“personal digital assistant” or PDA).mp.
31. exp personal digital assistant/
32. “palmtop computer?”.mp.
33. (tablet adj3 (device? or comput$)).mp.
34. Blackberry.mp.
35. Nokia.mp.
36. Symbian.mp.
37. (windows adj3 (mobile? Or phone?)).mp.
38. INQ.mp.
39. HTC.mp.
40. sidekick.mp.
41. Android.mp.
42. iPhone?.mp.
43. iPad?.mp.
44. Samsung.mp.
45. 23 or 24 or 25 or 26 or 27 or 28 or 29 or 30 or 31 or 32 or 33 or 34 or 35 or 36 or 37 or 38 or 39 or 40 or 41 or 42 or 43 or 44
46. 22 and 45
47. Limit 46 to yr=”2007 – Current”
Appendix 3. Ovid PsycINFO search strategy
1. exp Data Collection/
2. exp Self Evaluation/
3. exp “Quality of Life”/
4. exp Questionnaires/
5. exp Psychometrics/
6. exp Medical Records/
7. exp Surveys/
8. data.mp.
9. exp Information/
10. information.mp.
11. diary.mp.
12. 8 or 10 or 11
13. acqui$.mp.
14. gain$.mp.
15. collect$.mp.
16. obtain$.mp.
17. gather$.mp.
18. captu$.mp.
19. entr$.mp.
20. keep$.mp.
21. input$.mp.
22. 13 or 14 or 15 or 16 or 17 or 18 or 19 or 20 or 21
23. 12 adj3 22
24. 1 or 2 or 3 or 4 or 5 or 6 or 7 or 9 or 23
25. exp Cellular Phone/
26. exp Mobile Devices/
27. (handheld or hand‐held) adj1 (computer? Or pc?).mp.
28. cell$ phone?.mp.
29. “mobile phone?”.mp.
30. smartphone?.mp.
31. smart‐phone?.mp.
32. (“personal digital assistant” or PDA).mp.
33. “palmtop computer?”.mp.
34. (tablet adj3 (device? or comput$)).mp.
35. Blackberry.mp.
36. Nokia.mp.
37. Symbian.mp.
38. (windows adj3 (mobile? Or phone?)).mp.
39. INQ.mp.
40. HTC.mp.
41. sidekick.mp.
42. Android.mp.
43. iPhone?.mp.
44. iPad?.mp.
45. Samsung.mp.
46. 25 or 26 or 27 or 28 or 29 or 30 or 31 or 32 or 33 or 34 or 35 or 36 or 37 or 38 or 39 or 40 or 41 or 42 or 43 or 44 or 45
47. 24 and 46
48. Limit 47 to yr=”2007 – Current”
Appendix 4. IEEEXplore search strategy
(((data collection) OR (data entry) OR (data gathering) OR (questionnaires) OR (self assessment) OR (self evaluation) OR (diary) OR (data keeping) OR (psychometrics) OR (data capture) OR (quality of life)) AND ((smartphone) OR (smart‐phone) OR (handheld computer) OR (mobile phone) OR (cellular phone) OR (cell phone) OR (mobile device) OR (tablet) OR (tablet computer) OR (tablet device) OR (iPhone) OR (iPad) OR (Samsung) OR (Nokia) OR (Windows Phone) OR (Blackberry) OR (HTC) OR (INQ) OR (Android)))
Appendix 5. Web of Science search strategy
1. TS=(data collection)
2. TS=(data capture)
3. TS=(self assessment)
4. TS=(self report)
5. TS=(questionnaire)
6. TS=(data entry)
7. TS=(data gathering)
8. TS=(diary)
9. TS=(psychometrics)
10. 1 or 2 or 3 or 4 or 5 or 6 or 7 or 8 or 9
11. TS=(mobile phone)
12. TS=(mobile device)
13. TS=(cell phone)
14. TS=(cellular phone)
15. TS=(smartphone)
16. TS=(smart‐phone)
17. TS=(handheld computer)
18. TS=(handheld device)
19. TS=(hand‐held computer)
20. TS=(hand‐held device)
21. TS=(personal digital assistant)
22. TS=(PDA)
23. TS=(tablet)
24. TS=(tablet device)
25. TS=(tablet computer)
26. TS=(iPhone)
27. TS=(iPad)
28. TS=(Samsung)
29. TS=(palmtop computer)
30. TS=(Nokia)
31. TS=(Blackberry)
32. TS=(Android)
33. TS=(HTC)
34. TS=(INQ)
35. TS=(Windows phone)
36. TS=(Sidekick)
37. 11 or 12 or 13 or 14 or 15 or 16 or 17 or 18 or 19 or 20 or 21 or 22 or 23 or 24 or 25 or 26 or 27 or 28 or 29 or 30 or 31 or 32 or 33 or 34 or 35 or 36
38. 10 and 37
Appendix 6. CABI: CAB Abstracts search strategy
1. TS=(data collection)
2. TS=(data capture)
3. TS=(self assessment)
4. TS=(self report)
5. TS=(questionnaire)
6. TS=(data entry)
7. TS=(data gathering)
8. TS=(diary)
9. TS=(psychometrics)
10. 1 or 2 or 3 or 4 or 5 or 6 or 7 or 8 or 9
11. TS=(mobile phone)
12. TS=(mobile device)
13. TS=(cell phone)
14. TS=(cellular phone)
15. TS=(smartphone)
16. TS=(smart‐phone)
17. TS=(handheld computer)
18. TS=(handheld device)
19. TS=(hand‐held computer)
20. TS=(hand‐held device)
21. TS=(personal digital assistant)
22. TS=(PDA)
23. TS=(tablet)
24. TS=(tablet device)
25. TS=(tablet computer)
26. TS=(iPhone)
27. TS=(iPad)
28. TS=(Samsung)
29. TS=(palmtop computer)
30. TS=(Nokia)
31. TS=(Blackberry)
32. TS=(Android)
33. TS=(HTC)
34. TS=(INQ)
35. TS=(Windows phone)
36. TS=(Sidekick)
37. 11 or 12 or 13 or 14 or 15 or 16 or 17 or 18 or 19 or 20 or 21 or 22 or 23 or 24 or 25 or 26 or 27 or 28 or 29 or 30 or 31 or 32 or 33 or 34 or 35 or 36
38. 10 and 37
Appendix 7. Current Contents Connect search strategy
1. TS=(data collection)
2. TS=(data capture)
3. TS=(self assessment)
4. TS=(self report)
5. TS=(questionnaire)
6. TS=(data entry)
7. TS=(data gathering)
8. TS=(diary)
9. TS=(psychometrics)
10. 1 or 2 or 3 or 4 or 5 or 6 or 7 or 8 or 9
11. TS=(mobile phone)
12. TS=(mobile device)
13. TS=(cell phone)
14. TS=(cellular phone)
15. TS=(smartphone)
16. TS=(smart‐phone)
17. TS=(handheld computer)
18. TS=(handheld device)
19. TS=(hand‐held computer)
20. TS=(hand‐held device)
21. TS=(personal digital assistant)
22. TS=(PDA)
23. TS=(tablet)
24. TS=(tablet device)
25. TS=(tablet computer)
26. TS=(iPhone)
27. TS=(iPad)
28. TS=(Samsung)
29. TS=(palmtop computer)
30. TS=(Nokia)
31. TS=(Blackberry)
32. TS=(Android)
33. TS=(HTC)
34. TS=(INQ)
35. TS=(Windows phone)
36. TS=(Sidekick)
37. 11 or 12 or 13 or 14 or 15 or 16 or 17 or 18 or 19 or 20 or 21 or 22 or 23 or 24 or 25 or 26 or 27 or 28 or 29 or 30 or 31 or 32 or 33 or 34 or 35 or 36
38. 10 and 37
Appendix 8. ACM Digital Library (Journals) search strategy
("data collection") and ("mobile phone" or "smartphone" and "smart‐phone" and "cell phone" or "cellular phone" or tablet or "tablet computer" or "tablet device")
Appendix 9. ERIC search strategy
(IF(data collection) or IF(self evaluation) or IF(self assessment) or IF(questionnaire) or IF(psychometrics) or IF(data entry) or IF(data capture) or IF(diary) or IF(data gathering) or IF(information gathering) or IF(quality of life)) and (IF(mobile phone) or IF(cell phone) or IF(cellular phone) or IF(smartphone) or IF(smart‐phone) IF(handheld computer) or IF(palmtop) or IF(iPhone) or IF(iPad) or IF(Samsung) or IF(Windows phone) IF(Blackberry) or IF(Nokia) or IF(HTC) or IF(Symbian) or IF(Android) or IF(Sidekick) or IF(INQ) or IF(tablet) or IF(tablet computer) or IF(tablet device))
Appendix 10. Sociological Abstracts search strategy
(IF(data collection) or IF(self evaluation) or IF(self assessment) or IF(questionnaire) or IF(psychometrics) or IF(data entry) or IF(data capture) or IF(diary) or IF(data gathering) or IF(information gathering) or IF(quality of life)) and (IF(mobile phone) or IF(cell phone) or IF(cellular phone) or IF(smartphone) or IF(smart‐phone) IF(handheld computer) or IF(palmtop) or IF(iPhone) or IF(iPad) or IF(Samsung) or IF(Windows phone) IF(Blackberry) or IF(Nokia) or IF(HTC) or IF(Symbian) or IF(Android) or IF(Sidekick) or IF(INQ) or IF(tablet) or IF(tablet computer) or IF(tablet device))
Appendix 11. Health Management Information Consortium search strategy
1. exp Data Collection/
2. exp Self Assessment/
3. exp health status/
4. exp Surveys/
5. exp Health surveys/
6. exp Questionnaires
7. data.mp.
8. information.mp.
9. diary.mp.
10. 7 or 8 or 9
11. acqui$.mp.
12. gain$.mp.
13. collect$.mp.
14. obtain$.mp.
15. gather$.mp.
16. captu$.mp.
17. entr$.mp.
18. keep$.mp.
19. input$.mp.
20. 11 or 12 or 13 or 14 or 15 or 16 or 17 or 18 or 19
21. 10 adj3 20
22. 1 or 2 or 3 or 4 or 5 or 6 or 21
23. exp Mobile telephones/
24. (handheld or hand‐held) adj1 (computer? Or pc?).mp.
25. cell$ phone.mp.
26. “mobile phone?”.mp.
27. smartphone?.mp.
28. smart‐phone.mp.
29. (“personal digital assistant” or PDA).mp.
30. “palmtop computer?”.mp.
31. (tablet adj3 (device? or comput$)).mp.
32. Blackberry.mp.
33. Nokia.mp.
34. Symbian.mp.
35. (windows adj3 (mobile? Or phone?)).mp.
36. HTC.mp.
37. Android.mp.
38. iPhone?.mp.
39. iPad?.mp.
40. 23 or 24 or 25 or 26 or 27 or 28 or 29 or 30 or 31 or 32 or 33 or 34 or 35 or 36 or 37 or 38 or 39
41. 22 and 40
42. Limit 41 to yr=”2007 – Current”
Appendix 12. CENTRAL search strategy
1. MeSh descriptor: [Data Collection] explode all trees
2. MeSH descriptor: [Self‐Assessment] explode all trees
3. MeSh descriptor: [Health Status] explode all tress
4. “data”.ti,ab,kw
5. “information”.ti,ab,kw
6. “diary”.ti,ab,kw
7. 5 or 6
8. “acquisition”.ti,ab,kw
9. “gain”.ti,ab,kw
10. “collection”.ti,ab,kw
11. “obtain”.ti,ab,kw
12. “gather”.ti,ab,kw
13. “capture”.ti,ab,kw
14. “entry”.ti,ab,kw
15. “keep”.ti,ab,kw
16. “input”.ti,ab,kw
17. 8 or 9 or 10 or 11 or 12 or 13 or 14 or 15 or 16
18. 7 adj3 17
19. 1 or 2 or 3 or 18
20. MeSH descriptor: [Cellular Phone] explode all trees
21. MeSH descriptor: [Computers, Handheld] explode all trees
22. “cell phone”.ti,ab,kw
23. “mobile phone”.ti,ab,kw
24. “smartphone”.ti,ab,kw
25. “personal digital assistant”.ti,ab,kw
26. “palmtop”.ti,ab,kw
27. “tablet computer”.ti,ab,kw
28. “blackberry”.ti,ab,kw
29. “Nokia”.ti,ab,kw
30. “HTC”.ti,ab,kw
31. “Android”.ti,ab,kw
32. “iPhone”.ti,ab,kw
33. “iPad”.ti,ab,kw
34. “Samsung”.ti,ab,kw
35. 20 or 21 or 22 or 23 or 24 or 25 or 26 or 27 or 28 or 29 or 30 or 31 or 32 or 33 or 34
36. 19 and 35
Appendix 13. ClinicalTrials.gov search strategy
(questionnaires OR surveys) AND (smartphones OR mobile OR phone OR apps)
Appendix 14. Electronic database search results
| Database | Dates searched | Search date | Results | Notes | |
| Before de‐duplication | After de‐duplication | ||||
| MEDLINE (Ovid SP) | 2007 to current | 25 June 2014 | 2700 | 2579 | ‐ |
| EMBASE (Ovid SP) | 2007 to current | 25 June 2014 | 7701 | 7491 | ‐ |
| PsycINFO (Ovid SP) | 2007 to current | 25 June 2014 | 664 | 663 | ‐ |
| IEEEXplore | 2007 to current | 25 June 2014 | 2,476 | 2472 | ‐ |
| Web of Science (WoS) | 2007 to current | 25 June 2014 | 4,555 | 4546 | ‐ |
| CABI: CAB Abstracts & Global Health (WoS) | 2007 to current | 25 June 2014 | 867 | 863 | ‐ |
| Current Contents Connect (WoS) | 2007 to current | 25 June 2014 | 2868 | 2864 | ‐ |
| ACM Digital Library | 2007 to current | 25 June 2014 | 2306 | 104 | Initial screening took place during the searching phase given the exporting limitation of this electronic databases |
| ERIC (ProQuest) | 2007 to current | 30 June 2014 | 5 | 5 | ‐ |
| Sociological Abstracts (ProQuest) | 2007 to current | 30 June 2014 | 26 | 26 | ‐ |
| Campbell Library | 2007 to current | 30 June 2014 | 0 | 0 | ‐ |
| ClinicalTrials.gov | All | 30 June 2014 | 1148 | 1148 | ‐ |
| World Health Organization (WHO) ICTRP | All | 30 June 2014 | 2253 | 2224 | ‐ |
| OpenGrey | All | 30 June 2014 | 0 | 0 | ‐ |
| MobileActive | All | 30 June 2014 | 0 | 0 | ‐ |
| Dissertation & Theses (ProQuest) | 2007 to current | 30 June 2014 | 27 | 27 | ‐ |
| Health Management Information Consortium (Ovid SP) | 2007 to current | 01 July 2014 | 37 | 36 | ‐ |
| CENTRAL | 2007 to current | 01 July 2014 | 179 | 179 | ‐ |
| Google Scholar | All | 01 July 2014 | 410 | 0 | Initial screening took place during the searching phase given the exporting limitation of this electronic databases |
| Combined library | ‐ | ‐ | 28,222 | 17,168 | The total number of citations in the combined library before de‐duplication refers to the combination of the de‐duplicated EndNote libraries for each electronic database |
Appendix 15. Electronic database search results ‐ Update
| Database | Dates searched | Date of search | Results | Notes | |
| Before de‐duplication | After de‐duplication | ||||
| MEDLINE (Ovid SP) | 2014 to current | 12 April 2015 | 649 | 603 | ‐ |
| EMBASE (Ovid SP) | 2014 to current | 12 April 2015 | 2234 | 2190 | ‐ |
| PsycINFO (Ovid SP) | 2014 to current | 12 April 2015 | 236 | 236 | ‐ |
| IEEExplore | 2014 to current | 12 April 2015 | 1415 | 1398 | ‐ |
| Web of Science (WoS) | 2014 to current | 12 April 2015 | 1182 | 1182 | ‐ |
| CABI: CAB Abstracts & Global Health (WoS) | 2014 to current | 12 April 2015 | 155 | 155 | ‐ |
| Current Contents Connect (WoS) | 2014 to current | 13 April 2015 | 887 | 887 | ‐ |
| ACM Digital Library | 2014 to current | 13 April 2015 | 290 | 0 | Initial screening took place during the searching phase given the exporting limitation of this electronic databases |
| ERIC (ProQuest) | 2014 to current | 13 April 2015 | 0 | 0 | This database allows users to select the last 12 months from the day the search is conducted |
| Sociological Abstracts (ProQuest) | 2014 to current | 13 April 2015 | 0 | 0 | This database allows users to select the last 12 months from the day the search is conducted |
| Campbell Library | 2014 to current | 13 April 2015 | 0 | 0 | ‐ |
| ClinicalTrials.gov | 24 June 2014 to 13 April 2015 | 13 April 2015 | 396 | 396 | ‐ |
| World Health Organization (WHO) ICTRP | 2014 to current | 13 April 2015 | 453 | 453 | Initial screening took place during the searching phase given the exporting limitation of this electronic databases |
| OpenGrey | 2014 to current | 13 April 2015 | 0 | 0 | Initial screening took place during the searching phase given the exporting limitation of this electronic databases |
| MobileActive | 2014 to current | 13 April 2015 | 0 | 0 | Initial screening took place during the searching phase given the exporting limitation of this electronic databases |
| Dissertation & Theses (ProQuest) | 2014 to current | 13 April 2015 | 3 | 3 | This database allows users to select the last 12 months from the day the search is conducted |
| Health Management Information Consortium (Ovid SP) | 2014 to current | 13 April 2015 | 6 | 6 | ‐ |
| CENTRAL | 2014 to current | 13 April 2015 | 9 | 9 | ‐ |
| Google Scholar | 2014 to current | 13 April 2015 | 0 | 0 | Initial screening took place during the searching phase given the exporting limitation of this electronic databases We searched for our keywords in the title |
| Combined library | ‐ | ‐ | 7065 | 5507 | The total number of citations in the combined library before de‐duplication refers to the combination of the de‐duplicated EndNote libraries for each electronic database |
Appendix 16. ProQuest Dissertation and Theses search strategy
(IF(data collection) or IF(self evaluation) or IF(self assessment) or IF(questionnaire) or IF(psychometrics) or IF(data entry) or IF(data capture) or IF(diary) or IF(data gathering) or IF(information gathering) or IF(quality of life)) and (IF(mobile phone) or IF(cell phone) or IF(cellular phone) or IF(smartphone) or IF(smart‐phone) IF(handheld computer) or IF(palmtop) or IF(iPhone) or IF(iPad) or IF(Samsung) or IF(Windows phone) IF(Blackberry) or IF(Nokia) or IF(HTC) or IF(Symbian) or IF(Android) or IF(Sidekick) or IF(INQ) or IF(tablet) or IF(tablet computer) or IF(tablet device))
Data and analyses
Comparison 1. App versus paper.
| Outcome or subgroup title | No. of studies | No. of participants | Statistical method | Effect size |
|---|---|---|---|---|
| 1 Equivalence (mean score differences in validated survey questionnaires) | 3 | Mean Difference (IV, Fixed, 95% CI) | Totals not selected | |
| 2 Equivalence (mean score differences in non‐validated survey questionnaires) | 1 | Mean Difference (IV, Fixed, 95% CI) | Totals not selected | |
| 3 Data completeness (mean number of complete records) | 1 | Mean Difference (IV, Fixed, 95% CI) | Totals not selected | |
| 4 Data completeness (mean number of incomplete records) | 1 | Mean Difference (IV, Fixed, 95% CI) | Totals not selected | |
| 5 Time taken to complete a survey questionnaire | 1 | Mean Difference (IV, Fixed, 95% CI) | Totals not selected | |
| 6 Acceptability (continuous measurements) | 1 | Mean Difference (IV, Fixed, 95% CI) | Totals not selected | |
| 6.1 Preference | 1 | Mean Difference (IV, Fixed, 95% CI) | 0.0 [0.0, 0.0] | |
| 6.2 Ease of use | 1 | Mean Difference (IV, Fixed, 95% CI) | 0.0 [0.0, 0.0] | |
| 6.3 System informativeness | 1 | Mean Difference (IV, Fixed, 95% CI) | 0.0 [0.0, 0.0] | |
| 6.4 Perceived time taken to complete a survey questionnaire | 1 | Mean Difference (IV, Fixed, 95% CI) | 0.0 [0.0, 0.0] | |
| 6.5 Perceived usefulness | 1 | Mean Difference (IV, Fixed, 95% CI) | 0.0 [0.0, 0.0] | |
| 7 Acceptability (dichotomous measurements ‐ number of participants expressing their views on any given outcome) | 3 | Odds Ratio (M‐H, Fixed, 95% CI) | Totals not selected | |
| 7.1 Preference | 3 | Odds Ratio (M‐H, Fixed, 95% CI) | 0.0 [0.0, 0.0] | |
| 7.2 Willingness | 1 | Odds Ratio (M‐H, Fixed, 95% CI) | 0.0 [0.0, 0.0] |
Comparison 2. App versus laptop.
| Outcome or subgroup title | No. of studies | No. of participants | Statistical method | Effect size |
|---|---|---|---|---|
| 1 Equivalence (mean score differences in validated survey questionnaires) | 1 | Mean Difference (IV, Fixed, 95% CI) | Totals not selected |
Comparison 3. App versus SMS.
| Outcome or subgroup title | No. of studies | No. of participants | Statistical method | Effect size |
|---|---|---|---|---|
| 1 Equivalence (mean score differences in validated survey questionnaires) | 1 | Mean Difference (IV, Fixed, 95% CI) | Totals not selected | |
| 2 Data Completeness (mean number of entries on a daily basis) | 1 | Mean Difference (IV, Fixed, 95% CI) | Totals not selected | |
| 3 Time taken to complete a survey questionnaire | 1 | Mean Difference (IV, Fixed, 95% CI) | Totals not selected | |
| 4 Adherence to data collection protocol | 1 | Odds Ratio (M‐H, Fixed, 95% CI) | Totals not selected | |
| 5 Acceptability (Dichotomous measurements ‐ number of participants expressing their views for each outcome)) | 1 | Odds Ratio (M‐H, Fixed, 95% CI) | Totals not selected | |
| 5.1 Preference | 1 | Odds Ratio (M‐H, Fixed, 95% CI) | 0.0 [0.0, 0.0] | |
| 5.2 Ease of use | 1 | Odds Ratio (M‐H, Fixed, 95% CI) | 0.0 [0.0, 0.0] | |
| 5.3 Length of time that participants would be willing to use a delivery mode | 1 | Odds Ratio (M‐H, Fixed, 95% CI) | 0.0 [0.0, 0.0] | |
| 6 Acceptability (Continuous measurements) | 1 | Mean Difference (IV, Fixed, 95% CI) | Totals not selected |
Characteristics of studies
Characteristics of included studies [ordered by study ID]
Ainsworth 2013.
| Methods |
|
|
| Data |
|
|
| Comparisons |
|
|
| Outcomes |
|
|
| Notes | A semi‐structured interview (PANSS) was conducted after each sampling period. Participants had only 15 minutes from the initial alert within which they had to complete the questions; this was thought to reduce the likelihood of self selection bias (i.e., participants answering questions only when they were asymptomatic) | |
| Risk of bias | ||
| Item | Authors' judgement | Description |
| Random Sequence Generation? | Yes | Irrelevant to crossover designs. |
| Allocation Concealment? | Yes | Irrelevant to crossover designs. |
| Blinding of Participants and Personnel? | Yes | Irrelevant to crossover designs. |
| Blinding of Outcome Assessment? | Yes | Irrelevant to crossover designs. |
| Incomplete Outcome Assessment? | Yes | Irrelevant to crossover designs. |
| Selective Reporting? | Yes | Irrelevant to crossover designs. |
| Other Bias? | Yes | Irrelevant to crossover designs. |
| Suitability of crossover design? | Yes | Coons 2009 recommends using a crossover design when assessing data equivalence between alternative delivery modes. |
| Carry‐over effect? | Yes | Study authors evaluated the interaction between sampling period and method of assessment, finding that the order of the two conditions did not significantly predict the total number of entries an individual completed, or the length of time it took to complete each entry. |
| First period data available? | Yes | Data from both sampling periods were included in the statistical analyses. |
| Correct Analysis? | Yes | Spearman correlation is an accepted measure of similarity between scores across two different delivery modes. |
| Comparability of results with those from parallel trials? | Yes | Appropriate randomisation procedure was followed; adequate washout period (7 days); and absence of carry‐over effect. |
Brunger 2015.
| Methods |
|
|
| Data |
|
|
| Comparisons |
|
|
| Outcomes |
|
|
| Notes | The aim of this study was to validate an improved iPad based rating system relative to an existing iPAQ based system, while contrasting a shorter (64 mm) and a longer (100 mm) scale length. | |
| Risk of bias | ||
| Item | Authors' judgement | Description |
| Random Sequence Generation? | Yes | Irrelevant to paired repeated measures design. |
| Allocation Concealment? | Yes | Irrelevant to paired repeated measures design. |
| Blinding of Participants and Personnel? | Yes | Irrelevant to paired repeated measures design. |
| Blinding of Outcome Assessment? | Yes | Irrelevant to paired repeated measures design. |
| Incomplete Outcome Assessment? | Yes | Irrelevant to paired repeated measures design. |
| Selective Reporting? | Yes | Irrelevant to paired repeated measures design. |
| Other Bias? | Yes | Not relevant to paired repeated measures design. |
| Suitability of crossover design? | Yes | Coons 2009 recommends using a paired repeated measures design when assessing data equivalence between alternative delivery modes. |
| Carry‐over effect? | Yes | Order of the device was counterbalanced. In addition, they accounted for type of device in their statistical analyses. |
| First period data available? | Yes | For each pair of assessments the authors included data from both sampling periods. |
| Correct Analysis? | Yes | Correlation coefficients are one of the recommended measures to assess equivalence between delivery modes. |
| Comparability of results with those from parallel trials? | No | Although the study authors counterbalanced the order of the device and considered the type of device in their statistical analyses, they recruited a small sample of participants (i.e., 18). |
Bush 2013.
| Methods |
|
|
| Data |
|
|
| Comparisons |
|
|
| Outcomes |
|
|
| Notes | One of the objectives of this study was to develop and validate a smartphone app to be used amongst a highly mobile military population. Participants were asked to complete the iPhone measurement for a second time, and this was used to calculate test‐retest reliability | |
| Risk of bias | ||
| Item | Authors' judgement | Description |
| Random Sequence Generation? | Yes | Irrelevant to crossover designs. |
| Allocation Concealment? | Yes | Irrelevant to crossover designs. |
| Blinding of Participants and Personnel? | Yes | Irrelevant to crossover designs. |
| Blinding of Outcome Assessment? | Yes | Irrelevant to crossover designs. |
| Incomplete Outcome Assessment? | Yes | Irrelevant to crossover designs. |
| Selective Reporting? | Yes | Irrelevant to crossover designs. |
| Other Bias? | Yes | Irrelevant to crossover designs. |
| Suitability of crossover design? | Yes | Coons 2009 recommend using a crossover design when measuring data equivalence between alternative delivery modes. Fewer participants are needed (45), variability between participants is removed as each participant acts as her/his own control. |
| Carry‐over effect? | No | The presence of carry‐over effect was not formally tested; however, the washout period does not seem adequate (participants completed both sampling periods within 90 minutes). |
| First period data available? | Yes | Data from both sampling periods were included in the statistical analyses. |
| Correct Analysis? | Yes | Comparison of mean scores and calculation of ICC are recognised measures of data equivalence between alternative delivery modes using the same instrument. |
| Comparability of results with those from parallel trials? | No | Washout period was inadequate. |
Garcia‐Palacios 2014.
| Methods |
|
|
| Data |
|
|
| Comparisons |
|
|
| Outcomes |
|
|
| Notes | A technological profile questionnaire was developed for this study. Participants were asked to attend the clinic at the end of each sampling period and complete a weekly rating of pain and fatigue | |
| Risk of bias | ||
| Item | Authors' judgement | Description |
| Random Sequence Generation? | Yes | Irrelevant to crossover designs. |
| Allocation Concealment? | Yes | Irrelevant to crossover designs. |
| Blinding of Participants and Personnel? | Yes | Irrelevant to crossover designs. |
| Blinding of Outcome Assessment? | Yes | Irrelevant to crossover designs. |
| Incomplete Outcome Assessment? | Yes | Irrelevant to crossover designs. |
| Selective Reporting? | Yes | Irrelevant to crossover designs. |
| Other Bias? | Yes | Irrelevant to crossover designs. |
| Suitability of crossover design? | Yes | Coons 2009 recommends the use of crossover design when assessing data equivalence between alternative delivery modes using the same survey questionnaire. Fewer participants are needed, and variability between participants is minimised as each participant acts as her/his own control. |
| Carry‐over effect? | No | The presence of carry‐over effect was not formally assessed; the washout period was insufficient (participants attended the clinic after the first sampling period for an assessment, and to switch over to the alternative delivery mode). |
| First period data available? | Yes | Data from both sampling periods were included in the statistical analyses. |
| Correct Analysis? | No | Data on mood assessments were not reported; data from 7 participants were excluded as they failed to show up to the assessment session at the end of the first week of sampling. |
| Comparability of results with those from parallel trials? | Unclear | Randomisation procedure was not specified; presence of carry‐over effect was not explored; and unclear whether the washout period was appropriate. |
Khraishi 2012.
| Methods |
|
|
| Data |
|
|
| Comparisons |
|
|
| Outcomes |
|
|
| Notes | Type of publication: abstract | |
| Risk of bias | ||
| Item | Authors' judgement | Description |
| Random Sequence Generation? | Yes | Irrelevant to crossover designs. |
| Allocation Concealment? | Yes | Irrelevant to crossover designs. |
| Blinding of Participants and Personnel? | Yes | Irrelevant to crossover designs. |
| Blinding of Outcome Assessment? | Yes | Irrelevant to crossover designs. |
| Incomplete Outcome Assessment? | Yes | Irrelevant to crossover designs. |
| Selective Reporting? | Yes | Irrelevant to crossover designs. |
| Other Bias? | Yes | Irrelevant to crossover designs. |
| Suitability of crossover design? | Yes | Coons 2009 recommends the use of a crossover design to assess data equivalence between alternative delivery modes using the same survey questionnaire. |
| Carry‐over effect? | Unclear | It is unclear if the presence of carry‐over effect was tested and there is no information available on the duration of the washout period. |
| First period data available? | Unclear | It is unclear if data from both sampling periods were included in the statistical analyses. |
| Correct Analysis? | Unclear | Details of the statistical analyses used are not available. |
| Comparability of results with those from parallel trials? | Unclear | Every other patient was assigned to the reverse order; it is unclear if authors tested for carry‐over effects; no information on the washout period. |
Kim 2014.
| Methods |
|
|
| Data |
|
|
| Comparisons |
|
|
| Outcomes |
|
|
| Notes | N/A | |
| Risk of bias | ||
| Item | Authors' judgement | Description |
| Random Sequence Generation? | Yes | Irrelevant to crossover designs. |
| Allocation Concealment? | Yes | Irrelevant to crossover designs. |
| Blinding of Participants and Personnel? | Yes | Irrelevant to crossover designs. |
| Blinding of Outcome Assessment? | Yes | Irrelevant to crossover designs. |
| Incomplete Outcome Assessment? | Yes | Irrelevant to crossover designs. |
| Selective Reporting? | Yes | Irrelevant to crossover designs. |
| Other Bias? | Yes | Irrelevant to crossover designs. |
| Suitability of crossover design? | Yes | Coons 2009 recommends using crossover designs to assess data equivalence between alternative delivery modes using the same survey questionnaire. Fewer participants are required, and the variability between participants is reduced as each participant acts as her/his own control. |
| Carry‐over effect? | Yes | The presence of carry‐over effect was not formally tested; however, a washout period of one week was chosen to reduce the risk of a carry‐over effect. |
| First period data available? | Yes | Data from both sampling periods were included in the statistical analyses. |
| Correct Analysis? | Yes | ICC and a two‐way random effect model are appropriate techniques to assess the data equivalence between these delivery modes. |
| Comparability of results with those from parallel trials? | Yes | An effort was made to minimise the potential of a carry‐over effect (washout period of one week); the authors managed to recruit a large sample of participants (N = 1581). |
Lamber 2012.
| Methods |
|
|
| Data |
|
|
| Comparisons |
|
|
| Outcomes |
|
|
| Notes | Questions for the usability evaluation questionnaire were extracted from IBM CSUQ | |
| Risk of bias | ||
| Item | Authors' judgement | Description |
| Random Sequence Generation? | No | "The clinicians selected 74 users, who were randomly assigned to one of the 4 devices." However, the procedure by which clinicians selected their patients was not specified in the study report, and almost half of the patients (47.30%) were allocated to the laptop group. |
| Allocation Concealment? | Unclear | Not enough information available from the study report. |
| Blinding of Participants and Personnel? | No | The study report does not state whether participants or personnel were blinded. However, blinding might have not been possible as the type of device would immediately reveal to what group participants were allocated. The motivation to complete the self‐administered survey questionnaire might have been affected if participants were aware of what other delivery modes were being offered to other participants. |
| Blinding of Outcome Assessment? | No | The study report does not state whether outcome assessors were blinded to the allocation of participants. However, if the calculation of final scores was necessary, there is potential for detection bias particularly for the responses collected using pen‐and‐paper instruments. |
| Incomplete Outcome Assessment? | Yes | The study report suggests that all the participants that were enrolled and randomised completed the study and their data were included in the final analysis. |
| Selective Reporting? | No | The study authors also evaluated the impact that the patient profile (both clinical and technological) had on the usability evaluation they conducted. For this, they only concentrated on the laptop group as "this is the only group where enough samples were collected (to assure reliable results)." |
| Other Bias? | No | Although the purpose of this study was to conduct a usability evaluation of the electronic delivery of the EORTC QLQ‐C30, we are concerned that the overall scores (and their SD) were not reported. In addition, the SD for the usability scores was not reported. Finally, the laptop group is over‐represented in this study. |
| Suitability of crossover design? | Yes | Irrelevant to RCTs |
| Carry‐over effect? | Yes | Irrelevant to RCTs |
| First period data available? | Yes | Irrelevant to RCTs |
| Correct Analysis? | Yes | Irrelevant to RCTs |
| Comparability of results with those from parallel trials? | Yes | Irrelevant to RCTs |
Newell 2015.
| Methods |
|
|
| Data |
|
|
| Comparisons |
|
|
| Outcomes |
|
|
| Notes | Participants were drawn from two counties meeting the state of Florida's statutory definition of a rural community with 100 inhabitants or fewer per square mile. The study authors oversampled participants from a black ethnic background in order to have "a representative sample of those who were documented to be disadvantaged and living in the rural South. There was a double randomisation procedure. Participants were randomised to complete the first set of questions using either an iPad or pen‐and‐paper. Participants were subsequently randomised to complete the second survey questionnaire using either an iPad or pen‐and‐paper. For acceptability, the comparison between delivery modes was made between those who completed both sets of survey questionnaires using an iPad (CES‐D and RFQ), and those who completed both sets of questionnaires via pen‐and‐paper. |
|
| Risk of bias | ||
| Item | Authors' judgement | Description |
| Random Sequence Generation? | Yes | Randomisation was conducted using Qualtrics software. |
| Allocation Concealment? | Unclear | The study report does not state if allocation of participants was concealed. |
| Blinding of Participants and Personnel? | No | The study report does not state whether participants or personnel were blinded. However, blinding might have not been possible as the delivery mode (iPad or paper) would have immediately revealed to what group participants had been allocated. In addition, all participants (regardless of their allocation) received a tutorial on how to use an iPad. The motivation to complete the self‐administered survey questionnaire might have been affected due to participants' awareness of the alternative delivery mode. |
| Blinding of Outcome Assessment? | No | The study report does not state whether outcome assessors were blinded to the allocation of participants. However, since the calculation of final scores was necessary, there is potential for detection bias. |
| Incomplete Outcome Assessment? | Yes | The study report suggests that all the participants that were enrolled and randomised completed the study and their data were included in the final analysis. |
| Selective Reporting? | No | For acceptability, the analyses were conducted by comparing those participants who completed both the CES‐D and the RFQ on an iPad against those who complete the same survey questionnaires using pen‐and‐paper (thus excluding those who completed one scale on an iPad and the other one using pen‐and‐paper). Participants in the second community (but not the first) were asked to complete the BRIEF health literacy scale, to report on their technological experience, and to complete additional survey format items. According to the study authors the "rationale for these additions was to enable a more complete description of the sample". |
| Other Bias? | No | All participants received a tutorial on how to use an iPad; this could have acted as an intervention in its own right. In addition, participants in the second community used an iPad to complete the BRIEF scale and to complete additional items. |
| Suitability of crossover design? | Yes | Irrelevant to RCTs |
| Carry‐over effect? | Yes | Irrelevant to RCTs |
| First period data available? | Yes | Irrelevant to RCTs |
| Correct Analysis? | Yes | Irrelevant to RCTs |
| Comparability of results with those from parallel trials? | Yes | Irrelevant to RCTs |
Salaffi 2013.
| Methods |
|
|
| Data |
|
|
| Comparisons |
|
|
| Outcomes |
|
|
| Notes | Test‐retest reliability was assessed in this study | |
| Risk of bias | ||
| Item | Authors' judgement | Description |
| Random Sequence Generation? | Yes | Irrelevant to crossover designs. |
| Allocation Concealment? | Yes | Irrelevant to crossover designs. |
| Blinding of Participants and Personnel? | Yes | Irrelevant to crossover designs. |
| Blinding of Outcome Assessment? | Yes | Irrelevant to crossover designs. |
| Incomplete Outcome Assessment? | Yes | Irrelevant to crossover designs. |
| Selective Reporting? | Yes | Irrelevant to crossover designs. |
| Other Bias? | Yes | Irrelevant to crossover designs. |
| Suitability of crossover design? | Yes | Coons 2009 recommends using a crossover design to assess the data equivalence between alternative delivery modes using the same survey questionnaire. Fewer participants are required, and the between‐participant variability is reduced as each participant acts as her/his own control. |
| Carry‐over effect? | No | The presence of carry‐over effect was not explored in this study; however, the washout period does not seem adequate to minimise the likelihood of carry‐over effect (60 minutes). The authors stated that recall bias was reduced by organising various activities, such as visiting the physician during the interval. |
| First period data available? | Yes | Data from both sampling periods were included in the statistical analyses. |
| Correct Analysis? | Yes | Statistical methods are appropriate for assessing data equivalence between delivery modes. There appears to be some confusion around the reporting of SD of the mean scores. |
| Comparability of results with those from parallel trials? | Unclear | Randomisation procedure followed was not reported; presence of carry‐over effect was not explored; short washout period. |
Schemmann 2013.
| Methods |
|
|
| Data |
|
|
| Comparisons |
|
|
| Outcomes |
|
|
| Notes | Type of publication: abstract | |
| Risk of bias | ||
| Item | Authors' judgement | Description |
| Random Sequence Generation? | Yes | Irrelevant to crossover designs. |
| Allocation Concealment? | Yes | Irrelevant to crossover designs. |
| Blinding of Participants and Personnel? | Yes | Irrelevant to crossover designs. |
| Blinding of Outcome Assessment? | Yes | Irrelevant to crossover designs. |
| Incomplete Outcome Assessment? | Yes | Irrelevant to crossover designs. |
| Selective Reporting? | Yes | Irrelevant to crossover designs. |
| Other Bias? | Yes | Irrelevant to crossover designs. |
| Suitability of crossover design? | Yes | Coons 2009 recommend using a crossover design to assess data equivalence between alternative delivery modes using the same survey questionnaire. Fewer participants are required, and the between participant variability is reduced as each participant acts as her/his control. |
| Carry‐over effect? | Unclear | It is unclear if the authors tested for the presence of carry‐over effect, and it is unclear how long the washout period was. |
| First period data available? | Unclear | It is unclear if data from both sampling periods were included in the analyses. |
| Correct Analysis? | Unclear | It is not possible to assess the appropriateness of the statistical analyses |
| Comparability of results with those from parallel trials? | Unclear | Not enough information about the randomisation procedure, presence of carry‐over effect, or length of the washout period. |
Sigaud 2014.
| Methods |
|
|
| Data |
|
|
| Comparisons |
|
|
| Outcomes |
|
|
| Notes | Type of publication: abstract | |
| Risk of bias | ||
| Item | Authors' judgement | Description |
| Random Sequence Generation? | Unclear | Irrelevant to crossover designs. |
| Allocation Concealment? | Unclear | Irrelevant to crossover designs. |
| Blinding of Participants and Personnel? | Unclear | Irrelevant to crossover designs. |
| Blinding of Outcome Assessment? | Yes | Irrelevant to crossover designs. |
| Incomplete Outcome Assessment? | Yes | Irrelevant to crossover designs. |
| Selective Reporting? | Yes | Irrelevant to crossover designs. |
| Other Bias? | Yes | Irrelevant to crossover designs. |
| Suitability of crossover design? | Yes | Coons 2009 recommends using a crossover design for assessing the data equivalence between alternative delivery modes using the same questionnaire. Fewer patients are required, and the between participant variability is reduced as each participant acts as her/his own control. |
| Carry‐over effect? | Yes | The study authors found that "the sequence of the two diary supports and the specific effect related to the patient had no significant impact on the diary completion (p=0.1960 and p=0.5552, respectively)." |
| First period data available? | Unclear | Insufficient information to determine if data from both sampling periods were included in the statistical analyses. |
| Correct Analysis? | Unclear | Insufficient information to determine the appropriateness of the statistical analyses. |
| Comparability of results with those from parallel trials? | Unclear | Not enough information about the randomisation procedure used, tests for carry over effect, and the duration of the washout period. |
Stomberg 2012.
| Methods |
|
|
| Data |
|
|
| Comparisons | Pen‐and‐paper | |
| Outcomes |
|
|
| Notes | Response rate was measured as compliance with the original data collection protocol | |
| Risk of bias | ||
| Item | Authors' judgement | Description |
| Random Sequence Generation? | Unclear | The study report states that participants were randomly allocated to the experimental groups; however, the specific procedure was not mentioned. |
| Allocation Concealment? | Unclear | The study report does not state if allocation of participants was concealed. |
| Blinding of Participants and Personnel? | No | The study report does not state whether participants or personnel were blinded. However, blinding might have not been possible as the type of device would immediately reveal to what group participants were allocated. The motivation to complete the self‐administered survey questionnaire might have been affected if participants were aware of what other delivery mode was being offered to other participants: "most of them were interested in the mobile phone system, and some expressed disappointment on being allocated to the control group." |
| Blinding of Outcome Assessment? | No | The study report does not state whether outcome assessors were blinded to the allocation of participants. However, if the calculation of final scores was necessary, there is potential for detection bias for the pain assessments collected using the pen‐and‐paper instrument. |
| Incomplete Outcome Assessment? | No | Three participants were not included in the final statistical analysis, and it is unclear how the study authors dealt with this. Moreover, some participants did not submit data. |
| Selective Reporting? | No | Response rate was measured in relation to participants' adherence to the original data collection protocol. Moreover, the unit of reporting of this outcome changed from number of responses obtained to percentage; however, it is not entirely clear what the latter represents. Overall reporting of pain scores was done according to the type of surgery; however, it was not reported at the experimental group level (i.e., mobile versus pen‐and‐paper). Nevertheless, daily pain scores were reported according to group allocation. The authors only included 'correct' responses in their analysis: participants responding correctly at all of the times of the days specified in the data collection protocol. |
| Other Bias? | No | Participants in the intervention group received training on both pain management and use of the mobile technology. When compared to the information received by patients in the control group, this could potentially have acted as an intervention in itself resulting in more engagement from patients in the intervention group. Furthermore, one of the purpose was the evaluation of a commercial product. Finally, the sampling period was not the same for both groups. |
| Suitability of crossover design? | Yes | Irrelevant to RCTs. |
| Carry‐over effect? | Yes | Irrelevant to RCTs. |
| First period data available? | Yes | Irrelevant to RCTs. |
| Correct Analysis? | Yes | Irrelevant to RCTs. |
| Comparability of results with those from parallel trials? | Yes | Irrelevant to RCTs. |
Sun 2013a.
| Methods |
|
|
| Data |
|
|
| Comparisons |
|
|
| Outcomes |
|
|
| Notes | Type of publication: abstract | |
| Risk of bias | ||
| Item | Authors' judgement | Description |
| Random Sequence Generation? | Yes | Irrelevant to crossover designs. |
| Allocation Concealment? | Yes | Irrelevant to crossover designs. |
| Blinding of Participants and Personnel? | Yes | Irrelevant to crossover designs. |
| Blinding of Outcome Assessment? | Yes | Irrelevant to crossover designs. |
| Incomplete Outcome Assessment? | Yes | Irrelevant to crossover designs. |
| Selective Reporting? | Yes | Irrelevant to crossover designs. |
| Other Bias? | Yes | Irrelevant to crossover designs. |
| Suitability of crossover design? | Yes | Coons 2009 recommends using a crossover design for assessing the data equivalence between alternative delivery modes using the same questionnaire. Fewer patients are required, and the between participant variability is reduced as each participant acts as her/his own control. |
| Carry‐over effect? | Unclear | Insufficient information to assess this domain. |
| First period data available? | Unclear | Insufficient information to determine if data from both sampling periods were included in the statistical analyses. |
| Correct Analysis? | Unclear | Insufficient information to determine the appropriateness of the statistical analyses. |
| Comparability of results with those from parallel trials? | Unclear | Not enough information about the randomisation procedure used, tests for carry over effect, and the duration of the washout period. |
Sun 2013b.
| Methods |
|
|
| Data |
|
|
| Comparisons |
|
|
| Outcomes |
|
|
| Notes | Type of publication: abstract | |
| Risk of bias | ||
| Item | Authors' judgement | Description |
| Random Sequence Generation? | Yes | Irrelevant to crossover designs. |
| Allocation Concealment? | Yes | Irrelevant to crossover designs. |
| Blinding of Participants and Personnel? | Yes | Irrelevant to crossover designs. |
| Blinding of Outcome Assessment? | Yes | Irrelevant to crossover designs. |
| Incomplete Outcome Assessment? | Yes | Irrelevant to crossover designs. |
| Selective Reporting? | Yes | Irrelevant to crossover designs. |
| Other Bias? | Yes | Irrelevant to crossover designs. |
| Suitability of crossover design? | Yes | Coons 2009 recommends using a crossover design for assessing the data equivalence between alternative delivery modes using the same questionnaire. Fewer patients are required, and the between participant variability is reduced as each participant acts as her/his own control. |
| Carry‐over effect? | Unclear | Insufficient information to assess this domain. |
| First period data available? | Unclear | Insufficient information to determine if data from both sampling periods were included in the statistical analyses. |
| Correct Analysis? | Unclear | Insufficient information to determine the appropriateness of the statistical analyses. |
| Comparability of results with those from parallel trials? | Unclear | Not enough information about the randomisation procedure used, tests for carry over effect, and the duration of the washout period. |
Characteristics of excluded studies [ordered by study ID]
| Study | Reason for exclusion |
|---|---|
| Abernethy 2008 | This study was conducted between March 19th, 2006 and October 31st, 2006. |
| Ahmad 2012 | The comparison did not meet the eligibility criteria for this systematic review. |
| Aktas 2014 | The comparison and study design did not meet the inclusion criteria for this systematic review. |
| Alhajji 2009 | The comparison did not meet the eligibility criteria for this systematic review. |
| Allena 2012 | The intervention and the study design did not meet the eligibility criteria for this systematic review. The device utilised in this study was released before 2007. |
| Alsip 2014 | The intervention, comparison, outcomes and study design did not meet the inclusion criteria for this systematic review. |
| Bakshi 2013a | The comparison, outcomes and study design did not meet the inclusion criteria for this systematic review. |
| Bakshi 2013b | The intervention, comparison, outcomes and study design did not meet the inclusion criteria for this systematic review. |
| Barentsz 2014 | The study design did not meet the inclusion criteria for this systematic review. |
| Bartlett 2013a | The comparison did not meet the inclusion criteria for this systematic review. |
| Bartlett 2013b | The comparison did not meet the inclusion criteria for this systematic review. |
| Beasley 2008 | The intervention did not meet the inclusion criteria for this systematic review. |
| Bellamy 2009a | The intervention did not meet the inclusion criteria for this systematic review. |
| Bellamy 2009b | The intervention did not meet the inclusion criteria for this systematic review. |
| Bellamy 2011a | The intervention did not meet the inclusion criteria for this systematic review. |
| Bellamy 2011b | The comparison did not meet the inclusion criteria for this systematic review. |
| Ben‐Zeev 2012 | The intervention, comparison and study design did not meet the inclusion criteria for this systematic review. |
| Bernabe‐Ortiz 2008 | The intervention and the study design did not meet the inclusion criteria for this systematic review. |
| Bernhardt 2009 | The intervention, comparison and outcomes did not meet the inclusion criteria for this systematic review. |
| Berry 2014 | The intervention, comparison, and outcomes did not meet the inclusion criteria for this systematic review. |
| Bethoux 2014 | The comparison did not meet the inclusion criteria for this systematic review. |
| Bexelius 2010 | The outcomes and the study design did not meet the inclusion criteria for this systematic review. |
| Blaivas 2013a | The comparison, outcomes and study design did not meet the inclusion criteria for this systematic review. |
| Blaivas 2013b | The comparison, outcomes and study design did not meet the inclusion criteria for this systematic review. |
| Blum 2014 | The intervention, comparison, and study design did not meet the inclusion criteria for this systematic review. |
| Bockenek 2014 | The participants, intervention, and comparison did not meet the inclusion criteria for this systematic review. |
| Bokhour 2013 | The intervention and outcomes did not meet the inclusion criteria for this systematic review. |
| Bond 2013 | The comparison and study design did not meet the inclusion criteria for this systematic review. |
| Boushey 2009 | The intervention, outcomes and study design did not meet the inclusion criteria for this systematic review. |
| Bradbury 2012 | The intervention, comparison and study design did not meet the inclusion criteria for this systematic review. |
| Braun 2008 | The participants and the study design did not meet the inclusion criteria for this systematic review. |
| Burke 2009 | The intervention did not meet the inclusion criteria for this systematic review. |
| Buskirk 2014 | The intervention did not meet the inclusion criteria for this systematic review. |
| Carter 2013a | The comparison and the study design did not meet the inclusion criteria for this systematic review. |
| Carter 2013b | The comparison did not meet the inclusion criteria for this systematic review. |
| Christie 2013 | The intervention did not meet the inclusion criteria for this systematic review. |
| Clionsky 2014 | The intervention, and comparison did not meet the inclusion criteria for this systematic review. |
| Cook 2007 | The intervention did not meet the inclusion criteria for this systematic review. |
| Croff 2012 | The participants, intervention and outcomes did not meet the inclusion criteria for this systematic review. |
| Cudlip 2014 | The comparison, outcomes and study design did not meet the inclusion criteria for this systematic review. |
| Cunningham 2013 | The intervention, comparison and study design did not meet the inclusion criteria for this systematic review. |
| Dale 2007 | The participants, intervention, comparison, outcomes and study design did not meet the inclusion criteria for this systematic review. |
| de Bruijne 2013 | The intervention did not meet the inclusion criteria for this systematic review. |
| DeMaria 2012 | The participants, intervention, comparison, outcomes and study design did not meet the inclusion criteria for this systematic review. |
| Denny 2008 | The outcomes and study design did not meet the inclusion criteria for this systematic review. |
| Depp 2012 | This study was excluded during data extraction: data was entered via a web browser; surveys were delivered via a SMS that automatically redirected participants to the URL of the survey. |
| Desai 2012 | The intervention, comparison and outcomes did not meet the inclusion criteria for this systematic review. |
| Dewit 2012 | The study design did not meet the inclusion criteria for this systematic review. |
| Duncan 2012 | The intervention and comparison did not meet the inclusion criteria for this systematic review. |
| Dupont 2009 | The study design did not meet the inclusion criteria for this systematic review. |
| Dy 2012 | The study design did not meet the inclusion criteria for this systematic review. |
| Edwards 2008 | The intervention did not meet the inclusion criteria for this systematic review. |
| Escandon 2008 | The intervention and the study design did not meet the inclusion criteria for this systematic review. |
| Eskenazi 2014 | The participants, intervention, comparison, outcomes and study design did not meet the inclusion criteria for this systematic review. |
| Fanning 2014 | Study excluded during data extraction: data was entered via a web browser. |
| Farach 2013 | The comparison and the study design did not meet the inclusion criteria for this systematic review. |
| Faurholt‐Jepsen 2013 | The intervention, comparison and outcomes did not meet the inclusion criteria for this systematic review. |
| Fritz 2012 | The study design did not meet the inclusion criteria for this systematic review. |
| Galliber 2008 | The participants, intervention and comparison did not meet the inclusion criteria for this systematic review. |
| Garcia 2010 | The intervention, comparison and outcomes did not meet the inclusion criteria for this systematic review. |
| Gibbons 2011 | The intervention did not meet the inclusion criteria for this systematic review. |
| Giesinger 2013 | The intervention, comparison and study design did not meet the inclusion criteria for this systematic review. |
| Glaser 2013 | The participants, outcomes and study design did not meet the inclusion criteria for this systematic review. |
| Goldstein 2011 | The study design did not meet the inclusion criteria for this systematic review. |
| Gupta 2013 | The participants, intervention and study design did not meet the inclusion criteria for this systematic review. |
| Gurland 2010a | The comparison, outcomes and study design did not meet the inclusion criteria for this systematic review. |
| Gurland 2010b | The intervention, comparison and study design did not meet the inclusion criteria for this systematic review. |
| Hallum‐Montes 2013 | The comparison and outcomes did not meet the inclusion criteria for this systematic review. |
| Harralson 2013 | The intervention, comparison, outcomes and study design did not meet the inclusion criteria for this systematic review. |
| Harris 2013 | The comparison and study design did not meet the inclusion criteria for this systematic review. |
| Hashemian 2012 | The participants, comparison, outcomes and study design did not meet the inclusion criteria for this systematic review. |
| Haver 2011 | Study excluded during data extraction: the survey being evaluated was not health‐related. |
| Heiberg 2007 | The intervention did not meet the inclusion criteria for this systematic review. |
| Hollen 2013 | The study design did not meet the inclusion criteria for this systematic review. |
| Huang 2010 | The intervention did not meet the inclusion criteria for this systematic review. |
| Huang 2012 | The intervention, comparison, outcomes and study design did not meet the inclusion criteria for this systematic review. |
| Huguet 2014 | The intervention, comparison, outcomes and study design did not meet the inclusion criteria for this systematic review. |
| Hundeshagen 2013 | The participants, comparison, outcomes and study design did not meet the inclusion criteria for this systematic review. |
| Hutchesson 2015 | The intervention did not meet the inclusion criteria for this systematic review. |
| Isara 2013 | The intervention, comparison and study design did not meet the inclusion criteria for this systematic review. |
| Jacob 2012 | The study design did not meet the inclusion criteria for this systematic review. |
| Jaspan 2007 | The intervention did not meet the inclusion criteria for this systematic review. |
| Johnson 2014 | The intervention, and the study design did not meet the inclusion criteria for this systematic review. |
| Juniper 2009 | The intervention did not meet the inclusion criteria for this systematic review. |
| Junker 2008 | The intervention did not meet the inclusion criteria for this systematic review. |
| Kajander 2007 | The participants, intervention, comparison, outcomes and study design did not meet the inclusion criteria for this systematic review. |
| Kauer 2012 | The comparison and outcomes did not meet the inclusion criteria for this systematic review. |
| Kaufman 2013 | The comparison and study design did not meet the inclusion criteria for this systematic review. |
| Kelly 2014 | The comparison, outcomes and study design did not meet the inclusion criteria for this systematic review. |
| Khair 2014a | The study design did not meet the inclusion criteria for this systematic review. |
| Khair 2014b | The study design did not meet the inclusion criteria for this systematic review. |
| Khor 2014a | The comparison and outcomes did not meet the inclusion criteria for this systematic review. |
| Khor 2014b | The comparison and outcomes did not meet the inclusion criteria for this systematic review. |
| Khraishi 2013 | The participants, intervention, comparison, outcomes and study design did not meet the inclusion criteria for this systematic review. |
| Kimel 2010 | The intervention and the study design did not meet the inclusion criteria for this systematic review. |
| King 2013 | The participants and study design did not meet the inclusion criteria for this systematic review. |
| Kirwan 2012 | The comparison and study design did not meet the inclusion criteria for this systematic review. |
| Kochan 2007 | The intervention did not meet the inclusion criteria for this systematic review. |
| Krogh 2013 | The intervention did not meet the inclusion criteria for this systematic review: participants entered responses via a web browser on their smartphones (information provided by the contact author). |
| Kuntsche 2013 | The comparison and outcomes did not meet the inclusion criteria for this systematic review. |
| Kuntsche 2014 | The participants, intervention, comparison, outcomes and study design did not meet the inclusion criteria for this systematic review. |
| Lam 2010 | The intervention did not meet the inclusion criteria for this systematic review. |
| Lange 2014 | The comparison and the study design did not meet the inclusion criteria for this systematic review. |
| Lee 2010 | The participants, intervention and study design did not meet the inclusion criteria for this systematic review. |
| Lee 2014 | The intervention, comparison and study design did not meet the inclusion criteria for this systematic review. |
| Levine 2012 | The intervention, comparison, outcomes and study design did not meet the inclusion criteria for this systematic review. |
| Lundy 2013 | The participants, intervention, comparison, outcomes and study design did not meet the inclusion criteria for this systematic review. |
| Malotte 2011 | The comparison and study design did not meet the inclusion criteria for this systematic review. |
| Mangera 2014 | The intervention did not meet the inclusion criteria for this systematic review. |
| Marceau 2007 | The intervention did not meet the inclusion criteria for this systematic review. |
| Marceau 2010 | The intervention did not meet the inclusion criteria for this systematic review. |
| Martin 2012 | The comparison, outcomes and study design did not meet the inclusion criteria for this systematic review. |
| Matthew 2007a | The intervention did not meet the inclusion criteria for this systematic review. |
| Matthew 2007b | The intervention did not meet the inclusion criteria for this systematic review. |
| Mavletova 2013 | Study excluded during data extraction: data was entered via a mobile‐enabled web browser; both smartphones and feature phones were used to collect responses. |
| Mays 2010 | The intervention did not meet the inclusion criteria for this systematic review. |
| McCaw 2010 | The intervention did not meet the inclusion criteria for this systematic review. |
| McIntosh 2013 | The study design did not meet the inclusion criteria for this systematic review. |
| Michalak 2009 | The intervention did not meet the inclusion criteria for this systematic review: devices used PALM Treo (information obtained from contact author). |
| Miller 2013 | The comparison, outcomes and study design did not meet the inclusion criteria for this systematic review. |
| Mulvaney 2012 | The intervention, comparison and outcomes did not meet the inclusion criteria for this systematic review. |
| Nishiguchi 2014 | The comparison and the study design did not meet the inclusion criteria for this systematic review. |
| Oliver 2013 | The intervention did not meet the inclusion criteria for this systematic review. |
| Pakhare 2013 | The participants, intervention, comparison, outcomes and study design did not meet the inclusion criteria for this systematic review. |
| Patel 2012 | The comparison and outcomes did not meet the inclusion criteria for this systematic review. |
| Patnaik 2009 | The participants and study design did not meet the inclusion criteria for this systematic review. |
| Pau 2013 | The comparison and study design did not meet the inclusion criteria for this systematic review. |
| Pfaeffli 2013 | The comparison did not meet the inclusion criteria for this systematic review. |
| Phillips 2014 | The comparison, outcomes and study design did not meet the inclusion criteria for this systematic review. |
| Polak 2014 | The intervention did not meet the inclusion criteria for this systematic review. |
| Quadri 2012 | The study design did not meet the inclusion criteria for this systematic review. |
| Rao 2014 | The comparison did not meet the inclusion criteria for this systematic review. |
| Raptis 2011 | This is an ongoing study; however, the participants and outcomes did not meet the inclusion criteria for this systematic review. |
| Richter 2008 | The intervention did not meet the inclusion criteria for this systematic review. |
| Ring 2008 | The intervention did not meet the inclusion criteria for this systematic review. |
| Roth 2014 | The comparison and study design did not meet the inclusion criteria for this systematic review. |
| Runyan 2013 | The intervention, comparison and outcomes did not meet the inclusion criteria for this systematic review. |
| Russman 2014 | The comparison and study design did not meet the inclusion criteria for this systematic review. |
| Sage 2012 | The study design did not meet the inclusion criteria for this systematic review (information provided by the contact author, as it was not clear from the original publication). |
| Sander 2012 | The comparison did not meet the inclusion criteria for this systematic review. |
| Scheers 2012 | The intervention, comparison and study design did not meet the inclusion criteria for this systematic review. |
| Schlechtweg 2013 | The study design did not meet the inclusion criteria for this systematic review. |
| Seebregts 2009 | The intervention did not meet the inclusion criteria for this systematic review. |
| Shafran 2009 | The comparison, outcomes and study design did not meet the inclusion criteria for this systematic review. |
| Shapiro 2011 | The intervention and the outcomes did not meet the inclusion criteria for this systematic review. |
| Shay 2009 | The intervention did not the inclusion criteria for this systematic review. |
| Short 2013 | The participants, intervention and study design did not meet the inclusion criteria for this systematic review. |
| Smith 2011 | The study design did not meet the inclusion criteria for this systematic review. |
| Smith 2014 | The intervention did not meet the inclusion criteria for this systematic review. |
| Spark 2015 | The intervention did not meet the inclusion criteria for this systematic review. |
| Sternfeld 2012 | The intervention did not meet the inclusion criteria for this systematic review. |
| Stukenborg 2013 | The comparison and outcomes did not meet the inclusion criteria for this systematic review. |
| Swartz 2007 | The intervention did not meet the inclusion criteria for this systematic review. |
| Tegang 2009 | The participants, intervention, comparison and study design did not meet the inclusion criteria for this systematic review. |
| Temple 2014 | This trial is currently recruiting participants; however, the study design did not meet the inclusion criteria for this systematic review. |
| Tolley 2013 | The comparison and study design did not meet the inclusion criteria for this systematic review. |
| Trapl 2007 | The intervention did not meet the inclusion criteria for this systematic review. |
| Trapl 2013 | The intervention did not meet the inclusion criteria for this systematic review. Data were collected before 2007. |
| Tully 2014 | The comparison and study design did not meet the inclusion criteria for this systematic review. |
| Tyser 2015 | The intervention did not meet the inclusion criteria for this systematic review. |
| Unver 2009 | The intervention, comparison and study design did not meet the inclusion criteria for this systematic review. |
| van Duinen 2008 | The intervention did not meet the inclusion criteria for this systematic review. |
| van Heerden 2014 | The comparison and study design did not meet the inclusion criteria for this systematic review. |
| Vargas 2010 | The comparison did not meet the inclusion criteria for this systematic review. |
| Viana 2014 | The comparison did not meet the inclusion criteria for this systematic review. |
| Vinney 2012 | The intervention did not meet the inclusion criteria for this systematic review: a custom‐made handheld device was comissioned for this study (information obtained from the contact author). |
| Walther 2011 | The participants, intervention, comparison and outcomes did not meet the inclusion criteria for this systematic review. |
| Wells 2014 | Study excluded during data extraction: the survey being evaluated was not health‐related. |
| Wharton 2014 | The comparison did not meet the inclusion criteria for this systematic review. |
| Wilcox 2012 | The participants, intervention, comparison, outcomes and study design did not meet the inclusion criteria for this systematic review. |
| Wilson 2013a | The comparison, outcomes and study design did not meet the inclusion criteria for this systematic review. |
| Wilson 2013b | The comparison, outcomes and study design did not meet the inclusion criteria for this systematic review. |
| Witt 2015 | The study design did not meet the inclusion criteria for this systematic review. |
| Wofford 2014 | The comparison and study design did not meet the inclusion criteria for this systematic review. |
| Wood 2011 | The intervention did not meet the inclusion criteria for this systematic review. |
| Woods 2009 | This study was excluded during data extraction: the device used was discontinued before 2007. |
| Wundes 2011 | The study design did not meet the inclusion criteria for this systematic review. |
| Yon 2007 | The intervention and outcomes did not meet the inclusion criteria for this systematic review. |
| Yu 2009 | The participants and intervention did not meet the inclusion criteria for this systematic review. |
| Zhang 2012 | The participants and intervention did not meet the inclusion criteria for this systematic review. |
| Zhu 2009 | The comparison and outcomes did not meet the inclusion criteria for this systematic review. |
Characteristics of studies awaiting assessment [ordered by study ID]
Anand 2015.
| Methods | User interface on electronic tablet to support a clinical decision support system in paediatric care |
| Data | Unclear |
| Comparisons | Scanable paper form |
| Outcomes | Data completeness |
| Notes | We need to access the full text report in order to assess this study against our inclusion and exclusion criteria |
Benway 2013.
| Methods | Overall, 226 men with prostate cancer were asked to complete either a traditional paper survey, or an electronic survey administered on an iPad |
| Data | Data collected using The Expanded Prostate Cancer Index ‐ Composite for Clinical Practice (EPIC‐CP) |
| Comparisons | Paper EPIC‐CP survey (113 male participants) versus an electronic version of the EPIC‐CP survey administered on an iPad (113 male participants) |
| Outcomes | (i) Data completeness; (ii) satisfaction and comfort with the data collection method; (iii) self assessment of computer literacy |
| Notes | We were unable to get in touch with the contact author to request additional information that would have allowed us to reach a final decision about study inclusion |
Bjorner 2014a.
| Methods | Randomised crossover design |
| Data | Forms containing eight items from each of three Patient Reported Outcomes Measurement Information System (PROMIS) item banks: physical function, fatigue and depression |
| Comparisons | Interactive Voice Response (IVR), paper questionnaires (PQ), PDA, or personal computer (PC) |
| Outcomes | (i) Difference scores; (ii) intraclass correlation; (iii) convergent/discriminant validity |
| Notes | Two attempts were made to contact the contact author: 01 September 2014 and 22 September 2014. However, no reply has been received yet We need information concerning the model of the PDA used in this study, and to establish whether this report and Bjorner 2014b correspond to the same study |
Bjorner 2014b.
| Methods | Randomised crossover design |
| Data | Two non‐overlapping parallel 8‐item forms from each of three PROMIS domains: physical function, fatigue and depression |
| Comparisons | IVR, paper questionnaires (PQ), PDA or PC |
| Outcomes | Equivalence between scores across different methods of administration |
| Notes | Two attempts were made to contact the contact author: 01 September 2014 and 22 September 2014. However, no reply has been received yet We need information concerning the PDA model used in this study, and to establish whether this report and Bjorner 2014a correspond to the same study |
Burke 2012.
| Methods | RCT |
| Data | Self reported adherence to weight self monitoring, exercise, dietary goals, and attendance |
| Comparisons | Paper diary, PDA, and PDA plus daily tailored feedback message (FB) |
| Outcomes | (i) Adherence to the five components of a standard behavioural weight loss intervention |
| Notes | An attempt to contact the contact author was made on 01 September 2014. However, we have not received a reply yet We need additional information about the PDA model used in this study |
Cunha‐Miranda 2014.
| Methods | Crossover study |
| Data | BASDAI, BASFI and AsQoL completed on a touch‐screen device |
| Comparisons | Pen‐and‐paper |
| Outcomes | Equivalence: ICC coefficient |
| Notes | We need additional information about the devices used to administer the survey questionnaires. We attempted to contact the contact author on 04 May 2015. |
Nandkeshore 2013.
| Methods | Randomised crossover trial |
| Data | Total Nasal Symptom Scores (TNSS) |
| Comparisons | Paper diaries and an electronic patient acquisition tablet (ePDAT) system |
| Outcomes | (i) Acceptability; (ii) ability to accommodate a switch between paper and electronic diary card formats |
| Notes | We made one attempt to contact the contact author on 01 September 2014. However, we have not received a reply yet We need additional information about the model of the ePDAT system and the software used in this study |
O'Gorman 2014.
| Methods | Mobile phone administration of a survey questionnaire |
| Data | Responses collected using the EQ‐5D‐5L |
| Comparisons | Pen‐and‐paper |
| Outcomes | Equivalence |
| Notes | We need to gather more information about the type of devices used, and the app. Additionally, we need additional information about the study design. One of the authors was contacted on 29 April 2015 via ResearchGate |
Pfizer 2009.
| Methods | Interventional: random allocation, crossover assignment |
| Data | Questions about pain and sleep interference in patients with fibromyalgia |
| Comparisons | PDA versus IVR system |
| Outcomes | Daily questions about (i) pain, (ii) sleep, (iii) fatigue; questionnaires about pain, fatigue, function, quality of life, patients impression of change and diary ease of use |
| Notes | Trial has now been completed; however, there is not published data available |
Schaffeler 2014.
| Methods | Randomised study; tablet computer questionnaire |
| Data | Data collected from cancer patients using the Hornheider Screening Instrument, Distress Thermometer, Hospital Anxiety and Depression Scale, Patient Health Questionnaire 2, and the EORTC QLQ‐C30 |
| Comparisons | Pen‐and‐paper |
| Outcomes | Equivalence |
| Notes | We need additional information about the device and the app used in this study; contact author was contacted via email on 29 April 2015 |
Characteristics of ongoing studies [ordered by study ID]
Khair 2015.
| Trial name or title | Physical function and quality of life in adolescents with haemophilia (SO‐FIT study) |
| Methods | Multi‐centre, randomised cross‐over trial. Randomisation is at centre‐level |
| Data | Self reported data collected from boys with severe Haemophilia A or B using the following validated survey questionnaires:
|
| Comparisons | Pen‐and‐paper survey questionnaires |
| Outcomes |
|
| Starting date | Study protocol published in 2014; the first 6 months of the study have been completed |
| Contact information | Kate Khair |
| Notes | Contact with Kate Khair was made through ResearchGate |
Kingston 2014.
| Trial name or title | Mental Health E‐screening in Pregnant and Postpartum Women |
| Methods | Allocation: randomised Endpoint classification: efficacy study Intervention model: parallel assignment Masking: single blind Primary Purpose: screening |
| Data | Self reported data on:
|
| Comparisons | E‐screening (conducted on a wireless‐enabled tablet computer), and paper‐based screening |
| Outcomes |
|
| Starting date | July 2013 |
| Contact information | Dawn A Kingston (dawn.kingston@ualberta.ca) Marie B Lane‐Smith (mlanesmi@ualberta.ca) |
| Notes | ClinicalTrials.gov Identifier: NCT01899534 |
Differences between protocol and review
We only included health‐related survey questionnaires. This was not specified in the original systematic review protocol.
Data generated by children (aged ≤ 18 years) were analysed separately from data generated by adult participants.
We only included native apps or web apps wrapped within a native app, and excluded web apps rendered on a mobile web browser.
We reported our results according to the setting in which the included studies were conducted: controlled settings versus uncontrolled settings.
Contributions of authors
JMB conceived the study and drafted the protocol. KH and CM contributed to the design of the protocol and provided feedback on several protocol versions. JMB conducted the electronic searches. JMB and JJ conducted the screening of citations and extracted data from included studies. JMB analysed and interpreted the results, and drafted the first version of the manuscript. JJ verified the accuracy of the results. JC, CM and JOD supervised JMB's work. All the review authors read and provided critical feedback on the manuscript.
Sources of support
Internal sources
None, Other.
External sources
None, Other.
Declarations of interest
JMB: none to report.
JJ: none to report.
KH: none to report.
JOD: none to report.
CPM: none to report.
JC: none to report.
New
References
References to studies included in this review
Ainsworth 2013 {published data only}
- Ainsworth J, Palmier‐Claus JE, Machin M, Barrowclough C, Dunn G, Rogers A, et al. A comparison of two delivery modalities of a mobile phone‐based assessment for serious mental illness: native smartphone application vs text‐messaging only implementations. Journal of Medical Internet Research 2013;15(4):e60. [DOI] [PMC free article] [PubMed] [Google Scholar]
Brunger 2015 {published data only}
- Brunger L, Smith A, Re R, Wickham M, Philippides A, Watten P, et al. Validation of an iPad visual analogue rating system for assessing appetite and satiety. Appetite 2015;84:259‐63. [DOI] [PubMed] [Google Scholar]
Bush 2013 {published data only}
- Bush NE, Skopp N, Smolenski D, Crumpton R, Fairall J. Behavioral screening measures delivered with a smartphone app: psychometric properties and user preference. Journal of Nervous and Mental Disease 2013;201(11):991‐5. [DOI] [PubMed] [Google Scholar]
Garcia‐Palacios 2014 {published data only}
- Garcia‐Palacios A, Herrero R, Belmonte MA, Castilla D, Guixeres J, Molinari G, et al. Ecological momentary assessment for chronic pain in fibromyalgia using a smartphone: a randomized crossover study. European Journal of Pain 2014;18(6):862‐72. [DOI] [PubMed] [Google Scholar]
Khraishi 2012 {published data only}
- Khraishi M, Aslanov R. The use of an Apple iPad‐based© health assessment questionnaire (HAQ) application in psoriatic and rheumatoid arthritis. Dermatology and Therapy 2012;2(10):S58. [Google Scholar]
- Khraishi M, Aslanov R, Ogunyemi B, Gu M, Lin L. Comparing touch screen Apple iPad‐based© Health Assessment Questionnaire (HAQ) to the paper version in patients with inflammatory arthritis. Journal of Rheumatology 2012;39(8):1752. [Google Scholar]
Kim 2014 {published data only}
- Kim JH, Kwon SS, Shim SR, Sun HY, Ko YM, Chun DI, et al. Validation and reliability of a smartphone application for the International Prostate Symptom Score questionnaire: a randomized repeated measures crossover study. Journal of Medical Internet Research 2014;16(2):e38. [DOI: 10.2196/jmir.3042] [DOI] [PMC free article] [PubMed] [Google Scholar]
Lamber 2012 {published data only}
- Lamber P, Mitterer M, Napolitano L, Ricci F, Zini F. Surveying patients with smart devices. 25th International Symposium on Computer‐Based Medical Systems. 2012 Jun 20‐22:1‐4.
Newell 2015 {published data only}
- Newell SM, Logan HL, Guo Y, Marks JG, Shepperd JA. Evaluating tablet computers as a survey tool in rural communities. Journal of Rural Health 2015;31(1):108‐17. [DOI: 10.1111/jrh.12095] [DOI] [PMC free article] [PubMed] [Google Scholar]
Salaffi 2013 {published data only}
- Salaffi F, Gasparini S, Ciapetti A, Gutierrez M, Grassi W. Usability of an innovative and interactive electronic system for collection of patient‐reported data in axial spondyloarthritis: comparison with the traditional paper‐administered format. Rheumatology 2013;52(11):2062‐70. [DOI] [PubMed] [Google Scholar]
Schemmann 2013 {published data only}
- Schemmann D, Rudolph J, Haas H, Müller‐Stromberg J. Validation and patient acceptance of a touch tablet version of the iHOT‐12 questionnaire. Arthroscopy 2013;29(12 (Suppl)):e188. [Google Scholar]
Sigaud 2014 {published data only}
- Sigaud M, Horvais V, Chamouard V, Guillet B, Lambert T, Borel‐Derlon A, et al. Comparison of paper diary and B‐CoNect (telemetric smartphone application) at home treatment monitoring of severe hemophilia A patients. Haemophilia 2014;20(Suppl. 3):180. [Google Scholar]
Stomberg 2012 {published data only}
- Stomberg MW, Platon B, Widén A, Wallner I, Karlsson O. Health information: what can mobile phone assessments add?. Perspectives in Health Information Management 2012;9:1‐10. [PMC free article] [PubMed] [Google Scholar]
Sun 2013a {published data only}
- Sun T, West N, Ansermino M, Montgomery C, Lauder G, Baeyer C. PANDA: Evaluation of a smartphone‐based perioperative pain assessment tool. Journal of Investigative Medicine 2013;61(1):115. [Google Scholar]
- Sun T, West N, Ansermino M, Montgomery CJ, Myers D, Baeyer CL, et al. PANDA: Evaluation of a smartphone‐based peri‐operative pain assessment tool. Canadian Journal of Anesthesia 2013;60:S25. [Google Scholar]
Sun 2013b {published data only}
- Sun T, West N, Ansermino M, Montgomery C, Lauder G, Baeyer C. PANDA: Evaluation of a smartphone‐based perioperative pain assessment tool. Journal of Investigative Medicine 2013;61(1):115. [Google Scholar]
- Sun T, West N, Ansermino M, Montgomery CJ, Myers D, Baeyer CL, et al. PANDA: Evaluation of a smartphone‐based peri‐operative pain assessment tool. Canadian Journal of Anesthesia 2013;60:S25. [Google Scholar]
References to studies excluded from this review
Abernethy 2008 {published data only}
- Abernethy AP, Herndon JE 2nd, Wheeler JL, Patwardhan M, Shaw H, Lyerly HK, et al. Improving health care efficiency and quality using tablet personal computers to collect research‐quality, patient‐reported data. Health Services Research 2008;43(6):1975‐91. [DOI: 10.1111/j.1475-6773.2008.00887.x] [DOI] [PMC free article] [PubMed] [Google Scholar]
Ahmad 2012 {published data only}
- Ahmad F, Shakya Y, Li J, Khoaja K, Norman CD, Lou W, et al. A pilot with computer‐assisted psychosocial risk‐assessment for refugees. BMC Medical Informatics and Decision Making 2012;12:71. [DOI] [PMC free article] [PubMed] [Google Scholar]
Aktas 2014 {published data only}
- Aktas A, Hullihen B, Shrotriya S, Thomas S, Walsh D, Estfan B. Connected health: a pilot study of cancer symptom and quality of life assessment with a tablet computer. Palliative Medicine 2014;28:755‐6. [DOI] [PubMed] [Google Scholar]
Alhajji 2009 {published data only}
- Alhajji M, Jeffrey A, Datta A. Tablet PC to evaluate respiratory patient preference and satisfaction using the 18‐element Consultation Specific Questionnaire. Thorax 2009;64(Suppl IV):A90. [DOI: 10.1136/thx.2009.127134i] [DOI] [Google Scholar]
Allena 2012 {published data only}
- Allena M, Cuzzoni MG, Tassorelli C, Nappi G, Antonaci F. An electronic diary on a palm device for headache monitoring: a preliminary experience. Journal of Headache and Pain 2012;13(7):537‐41. [DOI: 10.1007/s10194-012-0473-2] [DOI] [PMC free article] [PubMed] [Google Scholar]
Alsip 2014 {published data only}
- Alsip C, Rich A. Using iPads to improve patient care. Radiology Management 2014;36(2):20‐1. [PubMed] [Google Scholar]
Bakshi 2013a {published data only}
- Bakshi N, Stinson J, Lukombo I, Ross D, Mittal N, Vinod Joshi S, et al. Development, establishment of the psychometric properties and usability testing of a novel multi‐dimensional web based diary for children with sickle cell disease. Blood 2013;122:21. [Google Scholar]
Bakshi 2013b {published data only}
- Bakshi N, Stinson J, Rice K, Ross D, Krishnamurti L. Preliminary validation of a multi‐dimensional electronic pain diary for children with sickle cell disease. Pediatric Blood and Cancer 2013;60:S31. [Google Scholar]
Barentsz 2014 {published data only}
- Barentsz MW, Wessels H, Diest PJ, Pijnappel RM, Pol CC, Witkamp AJ, et al. IPad versus paper questionnaires for patients with suspicion of breast cancer: Patients' preferences and quality of collected data. European Journal of Cancer 2014;50:S66. [DOI] [PMC free article] [PubMed] [Google Scholar]
Bartlett 2013a {published data only}
- Bartlett SJ, Orbai AM, Duncan T, Bingham III CO. How well do generic patient reported outcomes measurement information system instruments capture health status in rheumatoid arthritis?. Arthritis & Rheumatism 2013;65(10 (Supplement)):S972. [Google Scholar]
Bartlett 2013b {published data only}
- Bartlett SJ, Orbai AM, Duncan T, Leon E, Jones M, Bingham III CO. Preliminary data supporting the feasibility and construct validity of promis fatigue instrument in an academic rheumatoid arthritis clinic. Annals of the Rheumatic Diseases 2013;72(Suppl 3):585. [Google Scholar]
Beasley 2008 {published data only}
- Beasley JM, Riley WT, Davis A, Singh J. Evaluating of a PDA‐based dietary assessment and intervention program: a randomized controlled trial. Journal of the American College of Nutrition 2008;27(2):280‐6. [DOI: 10.1080/07315724.2008.10719701] [DOI] [PubMed] [Google Scholar]
Bellamy 2009a {published data only}
- Bellamy N, Wilson C, Hendrikz J, Patel B, Dennison S. Electronic data capture (EDC) using cellular technology: implications for clinical trials and practice, and preliminary experience with the m‐Womac Index in hip and knee OA patients. Inflammopharmacology 2009;17(2):93‐9. [DOI: 10.1007/s10787-008-8045-4] [DOI] [PubMed] [Google Scholar]
Bellamy 2009b {published data only}
- Bellamy N, Wilson C, Hendrikz J, Patel B, Dennison S. Validation study of electronic data capture (EDC) using the WOMAC® NRS 3.1 Index (m‐WOMAC®): preliminary interim analysis. Internal Medicine Journal 2009;39(Suppl 2):A67. [Google Scholar]
Bellamy 2011a {published data only}
- Bellamy N, Wilson C, Hendrikz J, Whitehouse SL, Patel B, Dennison S, et al. Osteoarthritis Index delivered by mobile phone (m‐WOMAC) is valid, reliable, and responsive. Journal of Clinical Epidemiology 2011;64(2):182‐90. [DOI: 10.1016/j.jclinepi.2010.03.013] [DOI] [PubMed] [Google Scholar]
Bellamy 2011b {published data only}
- Bellamy N, Hendrikz J, Wilson C. Comparison of transformed visual analogue and native numerical rating scaled patient responses to the WOMAC® Index. Internal Medicine Journal 2011;41(Suppl 1):23. [Google Scholar]
Ben‐Zeev 2012 {published data only}
- Ben‐Zeev D, McHugo GJ, Xie H, Dobbins K, Young MA. Comparing retrospective reports to real‐time/real‐place mobile assessments in individuals with schizophrenia and a nonclinical comparison group. Schizophrenia Bulletin 2012;38(3):396‐404. [DOI: 10.1093/schbul/sbr171] [DOI] [PMC free article] [PubMed] [Google Scholar]
Bernabe‐Ortiz 2008 {published data only}
- Bernabe‐Ortiz A, Curioso WH, Gonzales MA, Evangelista W, Castagnetto JM, Carcamo CP, et al. Handheld computers for self‐administered sensitive data collection: a comparative study in Peru. BMC Medical Informatics and Decision Making 2008;8:11. [DOI: 10.1186/1472-6947-8-11] [DOI] [PMC free article] [PubMed] [Google Scholar]
Bernhardt 2009 {published data only}
- Bernhardt JM, Usdan S, Mays D, Martin R, Cremeens J, Arriola KJ. Alcohol assessment among college students using wireless mobile technology. Journal of Studies on Alcohol and Drugs 2009;70(5):771‐5. [DOI] [PMC free article] [PubMed] [Google Scholar]
Berry 2014 {published data only}
- Berry DL, Hong F, Halpenny B, Partridge A, Fox E, Fann JR, et al. The electronic self report assessment and intervention for cancer: promoting patient verbal reporting of symptom and quality of life issues in a randomized controlled trial. BMC Cancer 2014;14:513. [DOI] [PMC free article] [PubMed] [Google Scholar]
Bethoux 2014 {published data only}
- Bethoux F, Rudick R, Miller D, Rao S, Lee JC, Stough D, et al. The Multiple Sclerosis Performance Test: an innovative approach to measuring MS‐related manual dexterity impairment. Neurology 2014;82(10 (Supplement)):P3.132. [Google Scholar]
Bexelius 2010 {published data only}
- Bexelius C, Löf M, Sandin S, Lagerros YT, Forsum E, Litton JE. Measures of physical activity using cell phones: validation using criterion methods. Journal of Medical Internet Research 2010;12(1):e2. [DOI: 10.2196/jmir] [DOI] [PMC free article] [PubMed] [Google Scholar]
Blaivas 2013a {published data only}
- Blaivas JG, Weinberger JM, Weiss JP, Kashan M. Validation of an electronic bladder diary application. Journal of Urology 2013;189(4S):e804‐5. [Google Scholar]
Blaivas 2013b {published data only}
- Blaivas JG, Weinberger JM, Weiss JP, Kashan M. Validation of WESHARETM: a new bladder diary application. Neurourology and Urodynamics 2013;32(2):119. [Google Scholar]
Blum 2014 {published data only}
- Blum D, Koeberle D, Omlin A, Walker J, Moos R, Mingrone W, et al. Feasibility and acceptance of electronic monitoring of symptoms and syndromes using a handheld computer in patients with advanced cancer in daily oncology practice. Support Care Cancer 2014;22(9):2425‐34. [DOI: 10.1007/s00520-014-2201-8] [DOI] [PubMed] [Google Scholar]
Bockenek 2014 {published data only}
- Bockenek JA, Brooks BR, Sanjak MS, Lucas NM, Smith NP, Nichols MS, et al. New disease management tools – Cerner electronic medical record deployment of Amyotrophic Lateral Sclerosis Functional Rating Scale‐Revised (ALSFRS‐R) validated with mobile smartphone (iPhone/Android) application (ALSFRSR‐Lite). Amyotrophic Lateral Sclerosis and Frontotemporal Degeneration 2014;15(Suppl 1):121‐2. [DOI: 10.3109/21678421.2014.960178/122] [DOI] [Google Scholar]
Bokhour 2013 {published data only}
- Bokhour BG, Solomon J, Laws MB, Gifford AL, Goetz MB. The impact of an HIV adherence informatics intervention on patient‐provider communication about ART adherence. Poster presentation at the Society of General Internal Medicine Annual Meeting. Denver, CO, 2013 Apr 25‐27.
Bond 2013 {published data only}
- Bond S, Devitt B, Lane H, McLachlan SA, Philip J. Can older patients use an electronic tablet to complete a cancer specific geriatric assessment? Results of a pilot study. Asia‐Pacific Journal of Clinical Oncology 2013;9(Suppl 3):150. [Google Scholar]
Boushey 2009 {published data only}
- Boushey CJ, Kerr DA, Wright J, Lutes KD, Ebert DS, Delp EJ. Use of technology in children's dietary assessment. European Journal of Clinical Nutrition 2009;63(Suppl 1):S50‐7. [DOI: 10.1038/ejcn.2008.65] [DOI] [PMC free article] [PubMed] [Google Scholar]
Bradbury 2012 {published data only}
- Bradbury A, Bate G, Thomas E, King T, Wright D. Varicose Veins (VV) Symptoms Questionnaire: a simple, validated measure of VV symptoms that can be administered daily using a Personal Digital Assistant (PDA). Journal of Vascular Surgery 2012;55(6):64‐5. [Google Scholar]
Braun 2008 {published data only}
- Braun MD, Elliot N, Pantel A. Rangeland health data collection and analysis improved with mobile GIS. 2008. ArcNews Online (accessed 07 August 2014). [http://www.esri.com/news/arcnews/spring08articles/rangeland‐health.html]
Burke 2009 {published data only}
- Burke LE, Styn MA, Glanz K, Ewing LJ, Elci OK, Conroy MB, et al. SMART trial: A randomized clinical trial of self‐monitoring in behavioral weight management‐design and baseline findings. Contemporary Clinical Trials 2009;30(6):540‐51. [DOI: 10.1016/j.cct.2009.07.003] [DOI] [PMC free article] [PubMed] [Google Scholar]
Buskirk 2014 {published data only}
- Buskirk TD, Andrus CH. Making mobile browser surveys smarter: results from a randomized experiment comparing online surveys completed via computer or smartphone. Field Methods 2014;26(4):322‐42. [Google Scholar]
Carter 2013a {published data only}
- Carter MC, Burley VJ, Nykjaer C, Cade JE. 'My Meal Mate' (MMM): validation of the diet measures captured on a smartphone application to facilitate weight loss. British Journal of Nutrition 2013;109(3):539‐46. [DOI: 10.1017/S0007114512001353] [DOI] [PubMed] [Google Scholar]
Carter 2013b {published data only}
- Carter MC, Burley VJ, Nykjaer C, Cade JE. Adherence to a smartphone application for weight loss compared to website and paper diary: pilot randomized controlled trial. Journal of Medical Internet Research 2013;15(4):e32. [DOI: 10.2196/jmir.2283] [DOI] [PMC free article] [PubMed] [Google Scholar]
Christie 2013 {published data only}
- Christie A, Dagfinrud H, Dale Ø, Schulz T, Hagen KB. Why use pen and paper in data collection when you can use a mobile phone? ‐ comparison of the two methods. Annals of the Rheumatic Diseases 2013;72(Suppl 3):1053. [Google Scholar]
Clionsky 2014 {published data only}
- Clionsky M, Clionsky E. Psychometric equivalence of a paper‐based and computerized (iPad) version of the Memory Orientation ScreeningTest (MOST®). The Clinical Neuropsychologist 2014;28(5):747‐55. [DOI: 10.1080/13854046.2014.913686] [DOI] [PubMed] [Google Scholar]
Cook 2007 {published data only}
- Cook IA, Balasubramani GK, Eng H, Friedman E, Young EA, Martin J, et al. Electronic source materials in clinical research: acceptability and validity of symptom self‐rating in major depressive disorder. Journal of Psychiatric Research 2007;41(9):737‐43. [DOI: 10.1016/j.jpsychires.2006.07.015] [DOI] [PubMed] [Google Scholar]
Croff 2012 {published data only}
- Croff JM. Feasibility of using iPads for data collection at college parties. Alcoholism: Clinical and Experimental Research 2012;36:66A. [Google Scholar]
Cudlip 2014 {published data only}
- Cudlip F, Swatzell V, Alexandrov DA, Freier MR, Rowek T, Wojner AJ, et al. Feasibility of an electronic point‐of‐discharge tablet for collection of perception of stroke care quality data. Stroke 2014;45:AN55. [Google Scholar]
Cunningham 2013 {published data only}
- Cunningham JA, Neighbors C, Bertholet N, Hendershot CS. Use of mobile devices to answer online surveys: implications for research. BMC Research Notes 2013;6:258. [DOI] [PMC free article] [PubMed] [Google Scholar]
Dale 2007 {published data only}
- Dale O, Hagen KB. Despite technical problems personal digital assistants outperform pen and paper when collecting patient diary data. Journal of Clinical Epidemiology 2007;60(1):8‐17. [DOI: 10.1016/j.jclinepi.2006.04.005] [DOI] [PubMed] [Google Scholar]
de Bruijne 2013 {published data only}
- Bruijne M, Wijnant A. Comparing survey results obtained via mobile devices and computers: an experiment with a mobile web survey on a heterogeneous group of mobile devices versus a computer‐assisted web survey. Social Science Computer Review 2013;31(4):482‐504. [DOI: 10.1177/0894439313483976] [DOI] [Google Scholar]
DeMaria 2012 {published data only}
- DeMaria AN. Self quantification of health and fitness. Journal of the American College of Cardiology 2012;60(16):1574‐5. [DOI] [PubMed] [Google Scholar]
Denny 2008 {published data only}
- Denny SJ, Milfont TL, Utter J, Robinson EM, Ameratunga SN, Merry SN, et al. Hand‐held internet tablets for school‐based data collection. BMC Research Notes 2008;1:52. [DOI: 10.1186/1756-0500-1-52] [DOI] [PMC free article] [PubMed] [Google Scholar]
Depp 2012 {published data only}
- Depp CA, Kim DH, Dios LV, Wang V, Ceglowski J. A pilot study of mood ratings captured by mobile phone versus paper‐and‐pencil mood charts in bipolar disorder. Journal of Dual Diagnosis 2012;8(4):326‐32. [DOI] [PMC free article] [PubMed] [Google Scholar]
Desai 2012 {published data only}
- Desai S, Witkiewitz K, Bowen S, Larimer M. The moderating effect of behavioral monitoring on the association between urgency and drinking outcomes among college students. Alcoholism: Clinical and Experimental Research 2012;36:243A. [Google Scholar]
Dewit 2012 {published data only}
- Dewit MA. Evaluating the impact of an iPad application on the efficiency and accuracy of data collection in clinical sessions of Acceptance and Commitment Therapy. Carbondale, IL: Southern Illinois University Carbondale, 2012. [Google Scholar]
Duncan 2012 {published data only}
- Duncan MJ, Vandelanotte C, Rosenkranz RR, Caperchione CM, Ding H, Ellison M, et al. Effectiveness of a website and mobile phone based physical activity and nutrition intervention for middle‐aged males: trial protocol and baseline finding of the ManUp Study. BMC Public Health 2012;12:656. [DOI] [PMC free article] [PubMed] [Google Scholar]
Dupont 2009 {published data only}
- Dupont A, Wheeler J, Herndon JE 2nd, Coan A, Zafar SY, Hood L, et al. Use of tablet personal computers for sensitive patient‐reported information. Journal of Supportive Oncology 2009;7(3):91‐7. [PubMed] [Google Scholar]
Dy 2012 {published data only}
- Dy CJ, Schmicker T, Tran Q, Chadwick B, Daluiski A. The use of a tablet computer to complete the DASH questionnaire. Journal of Hand Surgery 2012;37(12):2589‐94. [DOI] [PubMed] [Google Scholar]
Edwards 2008 {unpublished data only}
- Edwards JF. The Pyschometric Equivalency of Scores from a Web‐Based Questionnaire Administered via Cellphone versus Desktop Computer. Mississippi State University, 2008. [Google Scholar]
Escandon 2008 {published data only}
- Escandon IN, Searing H, Goldberg R, Duran R, Arce JM. The use of PDAs to collect baseline survey data: Lessons learned from a pilot project in Bolivia. Global Public Health 2008;3(1):93‐104. [DOI: 10.1080/17441690701437021] [DOI] [PubMed] [Google Scholar]
Eskenazi 2014 {published data only}
- Eskenazi B, Quiros‐Alcalá L, Lipsitt JM, Wu LD, Kruger P, Ntimbane T, et al. mSpray: a mobile phone technology to improve malaria control efforts and monitor human exposure to malaria control pesticides in Limpopo, South Africa. Environment International 2014;68:219‐26. [DOI] [PMC free article] [PubMed] [Google Scholar]
Fanning 2014 {published and unpublished data}
- Fanning J, McAuley E. A comparison of tablet computer and paper‐based questionnaires in healthy aging research. Journal of Medical Internet Research ‐ Research Protocols 2014;3(3):e38. [DOI: 10.2196/resprot.3291] [DOI] [PMC free article] [PubMed] [Google Scholar]
- Fanning JT, McAuley E. A comparison of iPad and paper‐based questionnaires in healthy aging research. Annals of Behavioral Medicine 2014;47:S22. [DOI: 10.1007/s12160-014-9596-9] [DOI] [PMC free article] [PubMed] [Google Scholar]
Farach 2013 {published data only}
- Farach N, Galindo H, Tinajeros F, Guardado M. Use of tablets for data collection among female sex workers: lessons learned from a behavioural surveillance study in Honduras, 2012. Sexually Transmitted Infections 2013;89:A248. [DOI: 10.1136/sextrans-2013-051184.0771] [DOI] [Google Scholar]
Faurholt‐Jepsen 2013 {published data only}
- Faurholt‐Jepsen M, Vinberg M, Christenses EM, Frost M, Bardram J, Kessing LV. Daily electronic self‐monitoring of subjective and objective symptoms in bipolar disorder ‐ the MONARCA trial protocol (MONitoring, treATment and pRediCtion of bipolAr disorder episodes): a randomised controlled single‐blind trial. BMJ Open 2013;3(7):e003353. [DOI: 10.1136/bmjopen-2013-003353] [DOI] [PMC free article] [PubMed] [Google Scholar]
Fritz 2012 {published data only}
- Fritz F, Balhorn S, Riek M, Breil B, Dugas M. Qualitative and quantitative evaluation of EHR‐integrated mobile patient questionnaires regarding usability and cost‐efficiency. International Journal of Medical Informatics 2012;81(5):303‐13. [DOI] [PubMed] [Google Scholar]
Galliber 2008 {published data only}
- Galliber JM, Stewart TV, Patbak PK, Werner JJ, Dickinson LM, Hickner JM. Data Collection Outcomes Comparing Paper Forms With PDA Forms in an Office‐Based Patient Survey. Annals of Family Medicine 2008;6(2):154‐60. [DOI] [PMC free article] [PubMed] [Google Scholar]
Garcia 2010 {published data only}
- Garcia Vega OA, Buendía Rodriguez JA. Concordance among three self‐reported measures of medication adherence and count of tablets records in Colombian hypertensive patients. Value in Health 2010;13(3):A167. [Google Scholar]
Gibbons 2011 {published data only}
- Gibbons C, Caudwell P, Finlayson G, King N, Blundell J. Validation of a new hand‐held electronic data capture method for continuous monitoring of subjective appetite sensations. International Journal of Behavioral Nutrition and Physical Activity 2011;8:57. [DOI] [PMC free article] [PubMed] [Google Scholar]
Giesinger 2013 {published data only}
- Giesinger JM, Kuster MS, Holzner B, Giesinger K. Development of a computer‐adaptive version of the forgotten joint score. Journal of Arthroplasty 2013;28(3):418‐22. [DOI] [PMC free article] [PubMed] [Google Scholar]
Glaser 2013 {published data only}
- Glaser D, Jain S, Kortum P. Benefits of a physician‐facing tablet presentation of patient symptom data: comparing paper and electronic formats. BMC Medical Informatics and Decision Making 2013;13:99. [DOI] [PMC free article] [PubMed] [Google Scholar]
Goldstein 2011 {published data only}
- Goldstein LA, Connolly Gibbons MB, Thompson SM, Scott K, Heintz L, Green P, et al. Outcome assessment via handheld computer in community mental health: consumer satisfaction and reliability. Journal of Behavioral Health Services & Research 2011;38(3):414‐23. [DOI] [PMC free article] [PubMed] [Google Scholar]
Gupta 2013 {published data only}
- Gupta A, Thapar J, Singh A, Singh P, Srinivasan V, Vardhan V. Simplifying and improving mobile based data collection. Proceedings of the Sixth International Conference on Information and Communications Technologies and Development. Cape Town, South Africa: ACM, 2013 Dec 07‐10:45‐8.
Gurland 2010a {published data only}
- Gurland B, Ferreira PCA, Sobol T, Kiran RP. Using technology to facilitate data capture and integration of patient reported outcomes (PRO) into colorectal surgical practice. Colorectal Disease 2010;12(Suppl 1):45. [Google Scholar]
Gurland 2010b {published data only}
- Gurland B, Alves‐Ferreira PC, Sobol T, Kiran RP. Using technology to improve data capture and integration of patient‐reported outcomes into clinical care: pilot results in a busy colorectal unit. Diseases of the Colon & Rectum 2010;53:1168‐75. [DOI] [PubMed] [Google Scholar]
Hallum‐Montes 2013 {published data only}
- Hallum‐Montes RM, Opdyke KM, Ruggeri C, Aliaga M, Bal D, Hurlbert M, et al. Implementation of electronic client‐level data collection via tablet technology among organizations supported by the Avon breast health outreach program. Cancer Research 2013;73:P6‐08‐15. [Google Scholar]
Harralson 2013 {published data only}
- Harralson T, Toche‐Manley L, Dietzen L, Grissom G, O'Hea E, Boudreaux E. Development and implementation of an automated distress management system for cancer patients. American Psychosocial Oncology Society 10th Annual Conference. 2013 Feb 13‐15.
Harris 2013 {published data only}
- Harris MA, Duke DC, Raymond JK, Harris JB, Shimomaeda L, Shimomaeda K. Self‐administered diabetes self‐management profile (SA‐DSMP): reliability, validity, and utility. Diabetes 2013;62:A636. [Google Scholar]
Hashemian 2012 {published data only}
- Hashemian M, Knowles D, Calver J, Qian W, Bullock MC, Bell S, et al. iEpi: An end to end solution for collecting, conditioning and utilizing epidemiologically relevant data. Proceedings of the 2nd ACM International Workshop on Pervasive Wireless Healthcare. Hilton Head, South Carolina, USA: ACM, 2012 Jun 11‐14:3‐8.
Haver 2011 {published data only}
- Haver AE, Marcotulio N, Elliott JP. Utilization of iPads to facilitate data collection during pediatric screening events. Pharmacotherapy 2011;31(10):418e‐9e. [Google Scholar]
Heiberg 2007 {published data only}
- Heiberg T, Kvien TK, Dale Ø, Mowinckel P, Aanerud GJ, Songe‐Møller AB, et al. Daily health status registration (patient diary) in patients with rheumatoid arthritis: a comparison between personal digital assistant and paper‐pencil format. Arthritis and Rheumatism 2007;57(3):454‐60. [DOI] [PubMed] [Google Scholar]
Hollen 2013 {published data only}
- Hollen PJ, Gralla RJ, Stewart JA, Meharchand JM, Wierzbicki R, Leighl N. Can a computerized format replace a paper form in PRO and HRQL evaluation? Psychometric testing of the computer‐assisted LCSS instrument (eLCSS‐QL). Supportive Care in Cancer 2013;21(1):165‐72. [DOI] [PubMed] [Google Scholar]
Huang 2010 {published data only}
- Huang F, Zhu ZH, Wang WZ, Zhang JX, Ji Y, Zhang K, et al. Psychometric equivalence between mobile phone based and paper‐and‐pencil tests: a case with children's revised impact of event scale. Chinese Journal of Clinical Psychology 2010;18(1):31‐3. [Google Scholar]
Huang 2012 {published data only}
- Zirong H, Junqing W, Coffey PS, Kilbourne‐Brook M, Yufeng Z, Wang C, et al. Performance of the woman's condom among couples in Shanghai, China. European Journal of Contraception and Reproductive Health Care 2012;17(3):212‐8. [DOI] [PubMed] [Google Scholar]
Huguet 2014 {published data only}
- Huguet A, Stinson J, MacKay B, Watters C, Tougas M, White M, et al. Bringing psychosocial support to headache sufferers using information and communication technology: lessons learned from asking potential users what they want. Pain Research & Management 2014;19(1):e1‐e8. [DOI] [PMC free article] [PubMed] [Google Scholar]
Hundeshagen 2013 {published data only}
- Hundeshagen G, Weissman O, Farber N, Winkler E, Haik J. Approaches to clinical research: alternative use of the Google Docs survey function for mobile data collection using physicians' smartphones. Plastic & Reconstructive Surgery 2013;131(1):135e‐6e. [DOI] [PubMed] [Google Scholar]
Hutchesson 2015 {published data only}
- Hutchesson MJ, Rollo ME, Callister R, Collins CE. Self‐monitoring of dietary intake by young women: online food records completed on computer or smartphone are as accurate as paper‐based food records but more acceptable. Journal of the Academy of Nutrition and Dietetics 2015;115(1):87‐94. [DOI] [PubMed] [Google Scholar]
Isara 2013 {published data only}
- Isara AR, Onyeagwara NC, Lawin H, Irabor I, Igwenyi C, Kabamba L. Survey of airflow obstruction in two African countries: paper questionnaire versus mobile phone technology. African Journal of Respiratory Medicine 2013;8(2):13‐6. [Google Scholar]
Jacob 2012 {published data only}
- Jacob E, Stinson J, Duran J, Gupta A, Gerla M, Lewis MA, et al. Usability testing of a smartphone for accessing a web‐based e‐diary for self‐monitoring of pain and symptoms in sickle cell disease. Journal of Pediatric Hematology/Oncology 2012;34(5):326‐35. [DOI] [PMC free article] [PubMed] [Google Scholar]
Jaspan 2007 {published data only}
- Jaspan HB, Flisher AJ, Myer L, Mathews C, Seebregts C, Berwick JR, et al. Brief report: methods for collecting sexual behaviour information from South African adolescents ‐ a comparison of paper versus personal digital assistant questionnaires. Journal of Adolescence 2007;30(2):353‐9. [DOI] [PubMed] [Google Scholar]
Johnson 2014 {published data only}
- Johnson EK, Estrada CR, Johnson KL, Nguyen HT, Rosoklija I, Nelson CP. Evaluation of a mobile voiding diary for pediatric patients with voiding dysfunction: a prospective comparative study. Journal of Urology 2014;192(3):908‐13. [DOI] [PMC free article] [PubMed] [Google Scholar]
Juniper 2009 {published data only}
- Juniper EF, Langlands JM, Juniper BA. Patients may respond differently to paper and electronic versions of the same questionnaires. Respiratory Medicine 2009;103(6):932‐4. [DOI] [PubMed] [Google Scholar]
Junker 2008 {published data only}
- Junker U, Freynhagen R, Längler K, Gockel U, Schmidt U, Tölle TR, et al. Paper versus electronic rating scales for pain assessment: a prospective, randomised, cross‐over validation study with 200 chronic pain patients. Current Medical Research and Opinion 2008;24(6):1797‐806. [DOI] [PubMed] [Google Scholar]
Kajander 2007 {published data only}
- Kajander K, Lätti M, Hatakka K, Korpela R. An electronic diary versus a paper diary in measuring gastrointestinal symptoms. Digestive and Liver Disease 2007;39(3):288‐9. [DOI] [PubMed] [Google Scholar]
Kauer 2012 {published data only}
- Kauer SD, Reid SC, Crooke AHD, Khor A, Hearps SJC, Jorm AF, et al. Self‐monitoring using mobile phones in the early stages of adolescent depression: randomized controlled trial. Journal of Medical Internet Research 2012;14(3):e67. [DOI] [PMC free article] [PubMed] [Google Scholar]
Kaufman 2013 {published data only}
- Kaufman ZA, Hershow R, DeCelles J, Bhauti K, Dringus S, Delany‐Moretlwe S, et al. Acceptability of data collection on mobile phones using ODK software for self‐administered sexual behaviour questionnaires. Sexually Transmitted Infections 2013;89(Suppl 1):A249. [Google Scholar]
Kelly 2014 {published data only}
- Kelly SM, Gryczynski J, Mitchell SG, Kirk A, O'Grady KE, Schwartz RP. Validity of brief screening instrument for adolescent tobacco, alcohol, and drug use. Pediatrics 2014;133(5):819‐26. [DOI] [PMC free article] [PubMed] [Google Scholar]
Khair 2014a {published data only}
- Khair K, Barrie A, Hubert N, Holland M. Pedhal goes electronic ‐ results of a single centre pilot study. Haemophilia 2014;20(Suppl 2):33. [Google Scholar]
Khair 2014b {published data only}
- Khair K, Hubert N, Barri A, Spires J, Griffioen A, Holland M. IPad‐based PedHAL app is intuitive and acceptable to boys with hemophilia. Haemophilia 2014;20(Suppl 3):84. [Google Scholar]
Khor 2014a {published data only}
- Khor AS, Gray KM, Reid SC, Melvin GA. Feasibility and validity of ecological momentary assessment in adolescents with high‐functioning autism and Asperger's disorder. Journal of Adolescence 2014;37(1):37‐46. [DOI] [PubMed] [Google Scholar]
Khor 2014b {published data only}
- Khor AS, Melvin GA, Reid SC, Gray KM. Coping, daily hassles and behavior and emotional problems in adolescents with high‐functioning autism/Asperger's disorder. Journal of Autism and Developmental Disorders 2014;44(3):593‐608. [DOI] [PubMed] [Google Scholar]
Khraishi 2013 {published data only}
- Khraishi M, Aslanov R, Fudge K. The validation of a new simple disease activity tool in Systemic Lupus Erythematosus (SLE): the Lupus Activity Scoring Tool (LAST) as compared to the SLEDAI SELENA modification. Lupus 2013;22(1):70‐1. [Google Scholar]
Kimel 2010 {published data only}
- Kimel M, McCormak J, Chen WH, Brunt K, Runken MC. A comparative trial of paper‐and‐pencil versus electronic administration of the Patient Perception of Migraine Questionnaire‐Revised (PPMQ‐R). 52nd Annual Scientific Meeting of the American Headache Society. Los Angeles, CA, 2010 Jun 24‐27.
King 2013 {published data only}
- King JD, Buolamwini J, Cromwell EA, Panfel A, Teferi T, Zerihun M, et al. A novel electronic data collection system for large‐scale surveys of neglected tropical diseases. PLoS ONE 2013;8(9):e74570. [DOI: 10.1371/journal.pone.0074570] [DOI] [PMC free article] [PubMed] [Google Scholar]
Kirwan 2012 {published data only}
- Kirwan M, Duncan MJ, Vandelanotte C, Mummery WK. Using smartphone technology to monitor physical activity in the 10,000 steps program: a matched case‐control trial. Journal of Medical Internet Research 2012;14(2):e55. [DOI: 10.2196/jmir.1950] [DOI] [PMC free article] [PubMed] [Google Scholar]
Kochan 2007 {published data only}
- Kochan B, Bellemans T, Janssens D, Wets G, Timmermans H. Paper‐and‐pencil versus personal digital assistant enabled surveys: a comparison. Transportation Systems: Engineering & Management. 12th Conference of the Hong‐Kong Society for Transportation Studies. Hong Kong University Science & Technology, 2007 Dec 08‐10.
Krogh 2013 {published and unpublished data}
- Krogh AB, Larsson B, Linde M. Comparing electronic and paper diary recordings of headache among adolescents in the general population. Cephalalgia 2013;33(8):142‐3. [DOI] [PubMed] [Google Scholar]
Kuntsche 2013 {published data only}
- Kuntsche E, Labhart F. Internet‐based data collection method for ecological momentary assessment using personal cell phones. European Journal of Psychological Assessment 2013;29(2):140‐8. [DOI: 10.1027/1015-5759/a000137] [DOI] [PMC free article] [PubMed] [Google Scholar]
Kuntsche 2014 {published data only}
- Kuntsche E, Labhart F. The future is now‐‐using personal cellphones to gather data on substance use and related factors. Addiction 2014;109(7):1052‐3. [DOI] [PubMed] [Google Scholar]
Lam 2010 {published data only}
- Lam J, Barr RG, Catherine N, Tsui H, Hahnhaussen CL, Pauwels J, et al. Electronic and paper diary recording of infant and caregiver behaviors. Journal of Developmental and Behavioral Pediatrics 2010;31(9):685‐93. [DOI] [PubMed] [Google Scholar]
Lange 2014 {published data only}
- Lange S, Süß HM. Measuring slips and lapses when they occur ‐ ambulatory assessment in application to cognitive failures. Consciousness and Cognition 2014;24:1‐11. [DOI] [PubMed] [Google Scholar]
Lee 2010 {published data only}
- Lee IJ, Huang S‐Y, Tsou M‐Y, Chan K‐H, Chang K‐Y. Decision analysis for a data collection system of patient‐controlled analgesia with a multi‐attribute utility model. Journal of the Chinese Medical Association 2010;73(10):533‐9. [DOI] [PubMed] [Google Scholar]
Lee 2014 {published data only}
- Lee H, Ahn H, Choi S, Choi W. The SAMS: Smartphone Addiction Management System and verification. Journal of Medical Systems 2014;38(1):1. [DOI] [PubMed] [Google Scholar]
Levine 2012 {published data only}
- Levine J, Wolf RL, Chinn C, Edelstein BL. MySmileBuddy: an iPad‐based interactive program to assess dietary risk for early childhood caries. Journal of the Academy of Nutrition & Dietetics 2012;112(10):1539‐42. [DOI] [PMC free article] [PubMed] [Google Scholar]
Lundy 2013 {published data only}
- Lundy JJ. Implementing New COA Instruments on Alternative Data Collection Modes: The Electronic Implementation Assessment. Value in Health 2013;16(3):A39. [Google Scholar]
Malotte 2011 {published data only}
- Malotte C, Cutting A, Huettner S, Matson P, Ellen J. Feasibility of using cell phones for daily data collection within adolescent cohort studies. Sexually Transmitted Infections 2011;87:A260‐1. [Google Scholar]
Mangera 2014 {published data only}
- Mangera A, Marzo A, Heron N, Fernando D, Hameed K, Soliman A‐HA, et al. Development of two electronic bladder diaries: a patient and healthcare professionals pilot study. Neurourology and Urodynamics 2014;33(7):1101–9. [DOI] [PubMed] [Google Scholar]
Marceau 2007 {published data only}
- Marceau LD, Link C, Jamison RN, Carolan S. Electronic diaries as a tool to improve pain management: is there any evidence?. Pain Medicine 2007;8(Suppl 3):S101‐9. [DOI] [PubMed] [Google Scholar]
Marceau 2010 {published data only}
- Marceau LD, Link CL, Smith LD, Carolan SJ, Jamison RN. In‐Clinic use of electronic pain diaries: barriers of implementation among pain physicians. Journal of Pain and Symptom Management 2010;40(3):391‐404. [DOI] [PMC free article] [PubMed] [Google Scholar]
Martin 2012 {published data only}
- Martin P, Brown C, Cuffe S, Pringle D, Mahler M, Villeneuve J, et al. Use of iPad technology to determine cancer patient‐reported preferences for and understanding of pharmacogenetic testing (PGT). Journal of Clinical Oncology 2012;Suppl 34:Abstract 319. [Google Scholar]
Matthew 2007a {published data only}
- Matthew AG, Currie KL, Irvine J, Ritvo P, Santa Mina D, Jamnicky L, et al. Serial personal digital assistant data capture of health‐related quality of life: a randomized controlled trial in a prostate cancer clinic. Health and Quality of Life Outcomes 2007;5:38. [DOI] [PMC free article] [PubMed] [Google Scholar]
Matthew 2007b {published data only}
- Matthew AG, Currie KL, Ritvo P, Nam R, Nesbitt ME, Kalnin RW, et al. Personal digital assistant data capture: the future of quality of life measurement in prostate cancer treatment. Journal of Oncology Practice 2007;3(3):115‐20. [DOI] [PMC free article] [PubMed] [Google Scholar]
Mavletova 2013 {published data only}
- Mavletova 2013. Data quality in PC and mobile web surveys. Social Science Computer Review 2013;31(6):725‐43. [DOI] [PMC free article] [PubMed] [Google Scholar]
- Mavletova A, Couper MC. Sensitive topics in PC web and mobile web surveys: is there a difference?. Survey Research Methods 2013;7(3):191‐205. [Google Scholar]
Mays 2010 {published data only}
- Mays D, Cremeens J, Usdan S, Martin RJ, Arriola KJ, Bernhardt JM. The feasibility of assessing alcohol use among college students using wireless mobile devices: Implications for health education and behavioural research. Health Education Journal 2010;69(3):311‐20. [Google Scholar]
McCaw 2010 {published data only}
- McCaw JM, Forbes K, Nathan PM, Pattison PE, Robins GL, Nolan TM, et al. Comparison of three methods for ascertainment of contact information relevant to respiratory pathogen transmission in encounter networks. BMC Infectious Diseases 2010;10:166. [DOI] [PMC free article] [PubMed] [Google Scholar]
McIntosh 2013 {published data only}
- McIntosh LD, Black L, Morley J, Long S, Carter P, Jones E, et al. Assessing the feasibility of electronic data collection for men with prostate cancer. Journal of Urology 2013;189(4S):e185‐6. [Google Scholar]
Michalak 2009 {published and unpublished data}
- Michalak EE, Kreindler DM, Murray G, Suto M, Johnson S, Amari E, et al. Mood monitoring in bipolar disorder: a hand‐held computer intervention. Bipolar Disorders 2009;11(Suppl 1):63. [Google Scholar]
Miller 2013 {published data only}
- Miller DP, Denizard‐Thompson NM, Wofford JL, Babcock D, Weaver KE, Case LD, et al. iPad‐based patient education and data collection for colorectal cancer screening. Journal of General Internal Medicine 2013;28:S245‐6. [Google Scholar]
Mulvaney 2012 {published data only}
- Mulvaney SA, Rothman RL, Dietrich MS, Wallston KA, Grove E, Elasy TA, et al. Using mobile phones to measure adolescent diabetes adherence. Health Psychology 2012;31(1):43‐50. [DOI] [PMC free article] [PubMed] [Google Scholar]
Nishiguchi 2014 {published data only}
- Nishiguchi S, Ito H, Yamada M, Yoshitomi H, Furu M, Ito T, et al. Self‐assessment tool of disease activity of rheumatoid arthritis by using a smartphone application. Telemedicine Journal and e‐Health 2014;20(3):235‐40. [DOI] [PubMed] [Google Scholar]
Oliver 2013 {published data only}
- Oliver E, Baños RM, Cebolla A, Lurbe E, Alvarez‐Pitti J, Botella C. An electronic system (PDA) to record dietary and physical activity in obese adolescents; data about efficiency and feasibility [Un sistema electrónico (PDA) para el registro de ingesta y actividad física en adolescentes obesos; datos sobre eficiencia y viabilidad]. Nutrición Hospitalaria 2013;28(6):1860‐6. [DOI: 10.3305/nh.2013.28.6.6784] [DOI] [PubMed] [Google Scholar]
Pakhare 2013 {published data only}
- Pakhare AP, Bali S, Kalra G. Use of mobile phones as research instrument for data collection. Indian Journal of Community Health 2013;25(2):95‐8. [Google Scholar]
Patel 2012 {published data only}
- Patel RA, Klasnja P, Hartzler A, Unruh KT, Pratt W. Probing the benefits of real‐time tracking during cancer care. AMIA Annual Symposium Proceedings. Chicago, IL, 2012 Nov 03‐07:1340‐9. [PMC free article] [PubMed]
Patnaik 2009 {published data only}
- Patnaik S, Brunskill E, Thies W. Evaluating the accuracy of data collection on mobile phones: a study of forms, SMS, and voice. International Conference on Information and Communication Technologies and Development. 2009 Apr 17‐19:74‐84.
Pau 2013 {published data only}
- Pau D, Nguyen L, Pibre S, Gokou S, Paget J. Results of a study using a tablet PC to collect PROS in elderly population. Value in Health 2013;16(7):A604. [Google Scholar]
Pfaeffli 2013 {published data only}
- Pfaeffli L, Maddison R, Jiang Y, Dalleck L, Löf M. Measuring physical activity in a cardiac rehabilitation population using a smartphone‐based questionnaire. Journal of Medical Internet Research 2013;15(3):e61. [DOI] [PMC free article] [PubMed] [Google Scholar]
Phillips 2014 {published data only}
- Phillips KA, Epstein DH, Jobes ML, Preston KL. Smartphone‐reported stress and drug events and day‐end perceived stress, hassles, and mood in methadone‐maintained individuals. Journal of General Internal Medicine 2014;29:S209‐10. [Google Scholar]
Polak 2014 {published data only}
- Polak E, Apfel A, Privitera M, Buse D, Haut S. Daily diaries in epilepsy research: does electronic format improve adherence?. Epilepsy Currents 2014;14:180. [Google Scholar]
Quadri 2012 {published data only}
- Quadri N, Langel K, Muehlhausen W, O'Donohoe P, Wild D. Exploring patient perceptions of, and preferences for, pain response scales. Value in Health 2012;15:A482. [Google Scholar]
Rao 2014 {published data only}
- Rao S, Alberts J, Miller D, Bethoux F, Lee JC, Stough D, et al. Processing Speed Test (PST): A self‐administered iPad®‐based tool for assessing MS‐related cognitive dysfunction. Neurology 2014;82(10 (Suppl)):S33.001. [Google Scholar]
Raptis 2011 {unpublished data only}
- Raptis DA, Rolf G. Desktop Versus Mobile Data Collection in Clinical Trial. ClinicalTrials.gov 2011. [NCT01473238]
Richter 2008 {published data only}
- Richter JG, Becker A, Koch T, Nixdorf M, Willers R, Monser R, et al. Self‐assessments of patients via Tablet PC in routine patient care: comparison with standardised paper questionnaires. Annals of the Rheumatic Diseases 2008;67(12):1739‐41. [DOI: 10.1136/ard.2008.090209] [DOI] [PubMed] [Google Scholar]
Ring 2008 {published data only}
- Ring AE, Cheong KA, Watkins CL, Meddis D, Cella D, Harper PG. A randomized study of electronic diary versus paper and pencil collection of patient‐reported outcomes in patients with non‐small cell lung cancer. Patient 2008;1(2):105‐13. [DOI] [PubMed] [Google Scholar]
Roth 2014 {published data only}
- Roth AM, Hensel DJ, Fortenberry JD, Garfein RS, Gunn JKL, Wiehe SE. Feasibility and acceptability of cell phone diaries to measure HIV risk behavior among female sex workers. AIDS and Behavior 2014;18(12):2314‐24. [DOI] [PMC free article] [PubMed] [Google Scholar]
Runyan 2013 {published data only}
- Runyan JD, Steenbergh TA, Bainbridge C, Daugherty DA, Oke L, Fry BN. A smartphone ecological momentary assessment/intervention "app'' for collecting real‐time data and promoting self‐awareness. PLoS One 2013;8(8):e71325. [DOI] [PMC free article] [PubMed] [Google Scholar]
Russman 2014 {published data only}
- Russman A, Hirsch J, Schindler D, Burke D, Linder S, Alberts J. Validation of a self‐administered iPad®‐ and iPod®‐based tool for assessing information processing. Neurology 2014;82(10 (Suppl)):P5.302. [Google Scholar]
Sage 2012 {published and unpublished data}
- Sage JM, Ali A, Farrell J, Huggins JL, Covert K, Eskra D, et al. Moving into the electronic age: validation of rheumatology self‐assessment questionnaires on tablet computers. Arthritis & Rheumatism 2012; Vol. 64, issue Suppl:S1102.
Sander 2012 {published data only}
- Sander P, Chung S, Ellen J, Matson P. Missing data in a mobile phone daily diary study of adolescents. American Journal of Epidemiology 2012;175(11 Suppl):S137. [Google Scholar]
Scheers 2012 {published data only}
- Scheers T, Philippaerts R, Lefevre J. Assessment of physical activity and inactivity in multiple domains of daily life: a comparison between a computerized questionnaire and the SenseWear Armband complemented with an electronic diary. International Journal of Behavioral Nutrition and Physical Activity 2012;9:71. [DOI] [PMC free article] [PubMed] [Google Scholar]
Schlechtweg 2013 {published data only}
- Schlechtweg PM, Hammon M, Heberlein C, Giese D, Uder M, Schwab SA. Can the documented patient briefing be carried out with an iPad app?. Journal of Digital Imaging 2013;26(3):383‐92. [DOI] [PMC free article] [PubMed] [Google Scholar]
Seebregts 2009 {published data only}
- Seebregts CJ, Zwarenstein M, Mathews C, Fairall L, Flisher AJ, Seebregts C, et al. Handheld computers for survey and trial data collection in resource‐poor settings: development and evaluation of PDACT, a Palm Pilot interviewing system. International Journal of Medical Informatics 2009;78(11):721‐31. [DOI] [PubMed] [Google Scholar]
Shafran 2009 {published data only}
- Shafran I, Burgunder P, Shamosh B. Mobile and web‐based application for IBD tracking. Inflammatory Bowel Diseases 2009;15:S40. [Google Scholar]
Shapiro 2011 {published data only}
- Shapiro S, Stuckey M, Sabourin K, Munoz C, Petrella RJ. Smartphone technology versus paper‐based logs for type II diabetes prevention: psychological and behavioral outcomes. Canadian Journal of Cardiology 2011;27(5 Suppl):S173‐4. [Google Scholar]
Shay 2009 {published data only}
- Shay LE, Seibert D, Watts D, Sbrocco T, Pagliara C. Adherence and weight loss outcomes associated with food‐exercise diary preference in a military weight management program. Eating Behaviors 2009;10(4):220‐7. [DOI] [PMC free article] [PubMed] [Google Scholar]
Short 2013 {published data only}
- Short J, Johnson R, Barr L, Yeh WC, Harvey J, Mathen V. iPad based applications have the potential to revolutionise cancer data collection. European Journal of Surgical Oncology 2013;39(11):S81. [Google Scholar]
Smith 2011 {published data only}
- Smith PH, Homish GG, Barrick C, Grier NL. Using touch‐screen technology to assess smoking in a low‐income primary care clinic: a pilot study. Substance Use & Misuse 2011;46(14):1750‐4. [DOI] [PubMed] [Google Scholar]
Smith 2014 {published data only}
- Smith LP, Hua J, Seto E, Du S, Zang J, Zou S, et al. Development and validity of a 3‐day smartphone assisted 24‐hour recall to assess beverage consumption in a Chinese population: a randomized cross‐over study. Asia Pacific Journal of Clinical Nutrition 2014;23(4):678‐90. [DOI] [PMC free article] [PubMed] [Google Scholar]
Spark 2015 {published data only}
- Spark S, Lewis D, Vaisey A, Smyth E, Wood A, Temple‐Smith M, et al. Using computer‐assisted survey instruments instead of paper and pencil increased completeness of self‐administered sexual behavior questionnaires. Journal of Clinical Epidemiology 2015;68(1):94‐101. [DOI] [PubMed] [Google Scholar]
Sternfeld 2012 {published data only}
- Sternfeld B, Jiang SF, Picchi T, Chasan‐Taber L, Ainsworth B, Quesenberry CP Jr. Evaluation of a cell phone‐based physical activity diary. Medicine and Science in Sports and Exercise 2012;44(3):487‐95. [DOI] [PubMed] [Google Scholar]
Stukenborg 2013 {published data only}
- Stukenborg G, Blackhall L, Harrison J, Read P. Palliative care cancer patient reported outcomes assessment using tablets. Supportive Care in Cancer 2013;21(Suppl 1):S118‐9. [Google Scholar]
Swartz 2007 {published data only}
- Swartz RJ, Moor C, Cook KF, Fouladi RT, Basen‐Engquist K, Eng C, et al. Mode effects in the center for epidemiologic studies depression (CES‐D) scale: personal digital assistant vs. paper and pencil administration. Quality of Life Research 2007;16(5):803‐13. [DOI] [PubMed] [Google Scholar]
Tegang 2009 {published data only}
- Tegang SP, Emukule G, Wambugu S, Kabore I, Mwarogo P. A comparison of paper‐based questionnaires with PDA for behavioral surveys in Africa: findings from a behavioral monitoring survey in Kenya. Journal of Health Informatics in Developing Countries 2009;3(1):22‐5. [Google Scholar]
Temple 2014 {unpublished data only}
- Temple L, Patil S. Feasibility and Psychometric Properties of Paper vs. Web vs. Automated Telephone Administration of Patient Reported Outcome Surveys. ClinicalTrials.gov 2014. [NCT01458509]
Tolley 2013 {published data only}
- Tolley C, Lalonde J, Rofail D, Gater A. "It was easier than dealing with a pen and paper...": exploring the usability of electronic devices for completion of Clinical Outcome Assessments (COAs) in schizophrenia. European Archives of Psychiatry and Clinical Neuroscience 2013;263(Suppl 1):S87. [Google Scholar]
Trapl 2007 {published data only}
- Trapl ES. Understanding adolescent survey responses: impact of mode and other characteristics on data outcomes and quality. Dissertation Abstracts International: Section B: The Sciences and Engineering 2007; Vol. 68:2303.
Trapl 2013 {published data only}
- Trapl ES, Taylor HG, Colabianchi N, Litaker D, Borawski EA. Value of audio‐enhanced handheld computers over paper surveys with adolescents. American Journal of Health Behavior 2013;37(1):62‐9. [DOI: 10.5993/AJHB.37.1.7] [DOI] [PMC free article] [PubMed] [Google Scholar]
Tully 2014 {published data only}
- Tully LM, Leon E, Motoru S, Wahba K, Smith P, Singh K, et al. Using a novel mobile health application to monitor symptoms and functioning in an early psychosis program: preliminary data on feasibility and acceptability. Biological Psychiatry 2014;75:387S. [Google Scholar]
Tyser 2015 {published data only}
- Tyser AR, Beckmann J, Weng C, O'Farrell A, Hung M. A randomized trial of the disabilities of the arm, shoulder, and hand administration: tablet computer versus paper and pencil. Journal of Hand Surgery ‐ American Volume 2015;40(3):554‐9. [DOI] [PubMed] [Google Scholar]
Unver 2009 {published data only}
- Unver YB, Yavuz GA, Sinclair SH. Interactive, computer‐based, self‐reported, visual function questionnaire: the PalmPilot‐VFQ. Eye 2009;23(7):1572‐81. [DOI] [PubMed] [Google Scholar]
van Duinen 2008 {published data only}
- Duinen M, Rickelt J, Griez E. Validation of the electronic Visual Analogue Scale of Anxiety. Progress in Neuro‐Psychopharmacology & Biological Psychiatry 2008;32(4):1045‐7. [DOI] [PubMed] [Google Scholar]
van Heerden 2014 {published data only}
- Heerden AC, Norris SA, Tollman SM, Stein AD, Richter LM. Field lessons from the delivery of questionnaires to young adults using mobile phones. Social Science Computer Review 2014;32:105‐12. [Google Scholar]
Vargas 2010 {published data only}
- Vargas PA, Robles E, Harris J, Radford P. Using information technology to reduce asthma disparities in underserved populations: a pilot study. Journal of Asthma 2010;47(8):889‐94. [DOI] [PMC free article] [PubMed] [Google Scholar]
Viana 2014 {published data only}
- Viana JS, Pombo N, Araújo P, Dias da Costa M. Evaluation of a smartphone application connected to a web based system for remote monitoring of post‐operative pain in ambulatory surgery: a randomised controlled trial. European Journal of Anaesthesiology 2014;31:225‐6. [Google Scholar]
Vinney 2012 {published and unpublished data}
- Vinney LA, Grade JD, Connor NP. Feasibility of using a handheld electronic device for the collection of patient reported outcomes data from children. Journal of Communication Disorders 2012;45(1):12‐9. [DOI: 10.1016/j.jcomdis.2011.10.001] [DOI] [PMC free article] [PubMed] [Google Scholar]
Walther 2011 {published data only}
- Walther B, Hossin S, Townend J, Abernethy N, Parker D, Jeffries D. Comparison of electronic data capture (EDC) with the standard data capture method for clinical trial data. PLoS One 2011;6(9):e25348. [DOI] [PMC free article] [PubMed] [Google Scholar]
Wells 2014 {published data only}
- Wells T, Bailey JT, Link MW. Comparison of smartphone and online computer survey administration. Social Science Computer Review 2014;32(2):238‐55. [DOI: 10.1177/0894439313505829] [DOI] [Google Scholar]
Wharton 2014 {published data only}
- Wharton CM, Johnston CS, Cunningham BK, Sterner D. Dietary self‐monitoring, but not dietary quality, improves with use of smartphone app technology in an 8‐week weight loss trial. Journal of Nutrition Education and Behavior 2014;46(5):440‐4. [DOI] [PubMed] [Google Scholar]
Wilcox 2012 {published data only}
- Wilcox AB, Gallagher KD, Boden‐Albala B, Bakken SR. Research data collection methods ‐ from paper to tablet computers. Medical Care 2012;50(Suppl):S68‐S73. [DOI] [PubMed] [Google Scholar]
Wilson 2013a {published data only}
- Wilson D, Wilson G, Patel P. A novel validated electronic patient data acquisition tool standardizes patient reported outcomes (PRO) data acquisition across multi‐center environmental exposure chamber and field studies. Journal of Allergy and Clinical Immunology 2013;131(2 Suppl):AB226. [Google Scholar]
Wilson 2013b {published data only}
- Wilson D, Nandkeshore H, Patel P. Development and validation of an electronic patient data acquisition tablet for allergy symptom collection in an environmental exposure chamber and at‐home. Allergy 2013;68(Suppl 97):466‐7. [Google Scholar]
Witt 2015 {published data only}
- Witt J, Brown A, Kaler P, Pannell C, Murtagh FEM. The future of data collection in palliative care practice. BMJ Supportive & Palliative Care 2015;5(1):116. [DOI: 10.1136/bmjspcare-2014-000838.36] [DOI] [Google Scholar]
Wofford 2014 {published data only}
- Wofford JL, Campos CL, Stevens SR, Jones RE. Real‐time patient survey data during real‐time clinics: Implementing technology‐enhanced rapid‐cycle quality improvement. Journal of General Internal Medicine 2014;29:S493‐4. [Google Scholar]
Wood 2011 {published data only}
- Wood C, Baeyer CL, Falinower S, Moyse D, Annequin D, Legout V. Electronic and paper versions of a faces pain intensity scale: concordance and preference in hospitalized children. BMC Pediatrics 2011;11:87. [DOI] [PMC free article] [PubMed] [Google Scholar]
Woods 2009 {published data only}
- Woods CA, Cumming B. The impact of test medium on use of visual analogue scales. Eye & Contact Lens 2009;35(1):6‐10. [DOI: 10.1097/ICL.0b013e3181909b03] [DOI] [PubMed] [Google Scholar]
Wundes 2011 {published data only}
- Wundes A, Amtmann D, Johnson K, Salem R, Yang DS, Schulz L, et al. Collecting health‐related information using a laptop or iPad during regular MS clinic visits: a pilot study. Multiple Sclerosis Journal 2011;17:S317. [Google Scholar]
Yon 2007 {published data only}
- Yon BA, Johnson RK, Harvey‐Berino J, Gold BC, Howard AB. Personal digital assistants are comparable to traditional diaries for dietary self‐monitoring during a weight loss program. Journal of Behavioral Medicine 2007;30(2):165‐75. [DOI] [PubMed] [Google Scholar]
Yu 2009 {published data only}
- Yu P, Courten M, Pan E, Galea G, Pryor J. The development and evaluation of a PDA‐based method for public health surveillance data collection in developing countries. International Journal of Medical Informatics 2009;78(8):532‐42. [DOI] [PubMed] [Google Scholar]
Zhang 2012 {published data only}
- Zhang S, Wu Q, Velthoven MH, Chen L, Car J, Rudan I, et al. Smartphone versus pen‐and‐paper data collection of infant feeding practices in rural china. Journal of Medical Internet Research 2012;14(5):e119. [DOI] [PMC free article] [PubMed] [Google Scholar]
Zhu 2009 {published data only}
- Zhu ZH, Huang F, Wang WZ, Zhang JX, Ji Y, Zhang K. The psychometric properties of children's impact of event scale administered via mobile phone. Third International Conference on Bioinformatics and Biomedical Engineering. Beijing, China, 2009 Jun 11‐13:1‐3.
References to studies awaiting assessment
Anand 2015 {published data only (unpublished sought but not used)}
- Anand V, McKee S, Dugan TM, Downs SM. Leveraging electronic tablets for general pediatric care: a pilot study. Applied Clinical Informatics 2015;6(1):1‐15. [DOI: 10.4338/ACI-2014-09-RA-0071] [DOI] [PMC free article] [PubMed] [Google Scholar]
Benway 2013 {published data only}
- Benway B, McIntosh L, Black L, Morley J, Long S, Carter P, et al. Electronic data collection for patient‐reported outcomes in men with prostate cancer: assessing ease of use and patient satisfaction. Journal of Endourology 2013;27(Suppl 1):A62. [DOI: 10.1089/end.2013.2001] [DOI] [Google Scholar]
Bjorner 2014a {published data only}
- Bjorner JB, Rose M, Gandek B, Stone AA, Junghaenel DU, Ware JE Jr. Method of administration of PROMIS scales did not significantly impact score level, reliability, or validity. Journal of Clinical Epidemiology 2014;67(1):108‐13. [DOI: 10.1016/j.jclinepi.2013.07.016] [DOI] [PMC free article] [PubMed] [Google Scholar]
Bjorner 2014b {published data only}
- Bjorner JB, Rose M, Gandek B, Stone AA, Junghaenel DU, Ware JE Jr. Difference in method of administration did not significantly impact item response: an IRT‐based analysis from the Patient‐Reported Outcomes Measurement Information System (PROMIS) initiative. Quality of Life Research 2014;23(1):217‐27. [DOI: 10.1007/s11136-013-0451-4] [DOI] [PMC free article] [PubMed] [Google Scholar]
Burke 2012 {published data only}
- Burke LE, Styn MA, Conroy MB, Ye L, Glanz K, Sevick MA, et al. Adherence to weight loss treatment across three self‐monitoring approaches and the association with weight change. Circulation 2012;125:A026. [Google Scholar]
Cunha‐Miranda 2014 {published data only}
- Cunha‐Miranda L, Santos H, Miguel C, Barcelos F, Silva C, Fernandes S, et al. Validation of touch‐screen questionnaires in spondyloarthropathies. Clinical and Experimental Rheumatology 2014;32:793‐4. [Google Scholar]
Nandkeshore 2013 {published data only}
- Nandkeshore H, Recker S, Patel P, Salapatek AM. Electronic patient acquisition tabletdemonstrates a high level of useracceptability and accommodation bypatients with allergic rhinitis studied inin environmental exposure chamber. Allergy: European Journal of Allergy and Clinical Immunology 2013;68(Suppl 97):360. [Google Scholar]
O'Gorman 2014 {published data only (unpublished sought but not used)}
- O'Gorman H, Mulhern B, Brazier J, Rotherham N. Comparing the equivalence of Eq‐5d‐5l across different modes of administration. Value in Health 2014;17:A517. [DOI] [PubMed] [Google Scholar]
Pfizer 2009 {unpublished data only}
- Pfizer. A Study to Compare Two Ways of Completing Pain and Sleep Questions and to Evaluate a New Daily Questionnaire for Assessing Fatigue in Fibromyalgia Patients. ClinicalTrials.gov 2009. [NCT00819624]
Schaffeler 2014 {published data only (unpublished sought but not used)}
- Schäffeler N, Wickert M, Wallwiener D, Zipfel S, Teufel M. Electronic psychooncological screening of cancer patients (ePOS): diagnostics and clinical pathways. Oncology Research and Treatment 2014;37(Suppl 1):106‐7. [Google Scholar]
References to ongoing studies
Khair 2015 {published and unpublished data}
- Khair K, Bladen M, Holland M. Physical function and quality of life in adolescents with haemophilia (SO‐FIT study). The Journal of Haemophilia Practice 2014;1(2):11‐4. [DOI: 10.17225/jhp.00018] [DOI] [Google Scholar]
- Khair K, Holland M. Acceptability of patient related outcome measures by young people: the SO‐FIT study. Haemophilia 2015;21(Suppl 2):53‐4. [Google Scholar]
Kingston 2014 {published data only}
- Kingston D, McDonald S, Biringer A, Austin MP, Hegadoren K, McDonald S, et al. Comparing the feasibility, acceptability, clinical‐, and cost‐effectiveness of mental health e‐screening to paper‐based screening on the detection of depression, anxiety, and psychosocial risk in pregnant women: a study protocol of a randomized, parallel‐group, superiority trial. Trials 2014;15:3. [DOI: 10.1186/1745-6215-15-3] [DOI] [PMC free article] [PubMed] [Google Scholar]
Additional references
Aanensen 2009
- Aanensen DM, Huntley DM, Feil EJ, al‐Own F, Spratt BG. EpiCollect: linking smartphones to web applications for epidemiology, ecology and community data collection. PLoS One 2009;4(9):e6968. [DOI: 10.1371/journal.pone.0006968] [DOI] [PMC free article] [PubMed] [Google Scholar]
Adams 2014
- Adams P, Baumer EPS, Gay G. Staccato social support in mobile health applications. Proceedings of the SIGCHI Conference on Human Factors in Computing Systems. 2014 Apr 26‐May 01:653‐62. [DOI: 10.1145/2556288.2557297] [DOI]
Armstrong 2009
- Armstrong AW, Watson AJ, Makredes M, Frangos JE, Kimball AB, Kvedar JC. Text‐message reminders to improve sunscreen use: a randomized, controlled trial using electronic monitoring. Archives of Dermatology 2009;145(11):1230‐6. [DOI: 10.1001/archdermatol.2009.269] [DOI] [PubMed] [Google Scholar]
Barry 1992
- Barry MJ, Fowler FJ, O'Leary MP, Bruskewitz RC, Holtgrewe HL, Mebust WK, et al. The American Urological Association symptom index for benign prostatic hyperplasia. The Measurement Committee of the Americal Urological Association. Journal of Urology 1992;148(5):1549‐57. [DOI] [PubMed] [Google Scholar]
Blundell 2010
- Blundell J, Graaf C, Hulshof T, Jebb S, Livingstone B, Lluch A, et al. Appetite control: methodological aspects of the evaluation of foods. Obesity Reviews 2010;11(3):251‐70. [DOI: 10.1111/j.1467-789X.2010.00714.x] [DOI] [PMC free article] [PubMed] [Google Scholar]
Bowling 2005
- Bowling A. Mode of questionnaire administration can have serious effects on data quality. Journal of Public Health 2005;27(3):281‐91. [DOI] [PubMed] [Google Scholar]
Bowling 2009
- Bowling A. Research Methods in Health. 3rd Edition. New York, NY: Open University Press, 2009. [Google Scholar]
Boynton 2004
- Boynton PM, Greenhalgh T. Selecting, designing, and developing your questionnaire. BMJ 2004;328(7451):1312‐5. [DOI] [PMC free article] [PubMed] [Google Scholar]
Bruce 2003
- Bruce B, Fries JF. The Stanford Health Assessment Questionnaire: dimensions and practical applications. Health and Quality of Life Outcomes 2003;1:20. [DOI] [PMC free article] [PubMed] [Google Scholar]
Bulloch 2009
- Bulloch B, Garcia‐Filion P, Notricia D, Bryson M, McConahay T. Reliability of the color analog scale: repeatability of scores in traumatic and nontraumatic injuries. Academic Emergency Medicine 2009;16(5):465‐9. [DOI: 10.1111/j.1553-2712.2009.00404.x] [DOI] [PubMed] [Google Scholar]
Calin 1994
- Calin A, Garrett S, Whitelock H, Kennedy LG, O'Hea J, Mallorie P, et al. A new approach to defining functional ability in ankylosing spondylitys: the development of the Bath Ankylosing Spondylitis Functional Index. Journal of Rheumatology 1994;21(12):2281‐5. [PubMed] [Google Scholar]
Carter 2000
- Carter Y, Shaw S, Thomas C. The Use and Design of Questionnaires. London: Royal College of General Practitioners, 2000. [Google Scholar]
Coons 2009
- Coons SJ, Gwaltney CJ, Hays RD, Lundy JJ, Sloan JA, Revicki DA, et al. ISPOR ePRO Task Force. Recommendations on evidence needed to support measurement equivalence between electronic and paper‐based patient‐reported outcome (PRO) measures: ISPOR ePRO Good Research Practices Task Force report. Value in Health 2009;12(4):419‐29. [DOI: 10.1111/j.1524-4733.2008.00470.x] [DOI] [PubMed] [Google Scholar]
Eaton 2004
- Eaton WW, Muntaner C, Smith C, Tien A, Ybarra M. Center for epidemiologic studies depression scale: review and revision (CESD and CESD‐R). In: Maruish ME editor(s). The Use of Psychological Testing for Treatment Planning and Outcomes Assessment. 3rd Edition. London: Lawrence Erlbaum, 2004. [Google Scholar]
EndNote X5 [Computer program]
- Thomson Reuters. EndNote X5. Philadelphia, PA: Thomson Reuters, 2011.
EORTC QLQ‐C30
- EORTC Quality of Life. EORTC QLQ ‐ C30. http://groups.eortc.be/qol/eortc‐qlq‐c30 (accessed 31 October 2014).
Eyler 2013
- Eyler AA. Are diabetes self‐management apps based on evidence?. Translational Behavioral Medicine 2013;3(3):233. [DOI: 10.1007/s13142-013-0233-0] [DOI] [PMC free article] [PubMed] [Google Scholar]
Fan 2010
- Fan W, Yan Z. Factors affecting response rates of the web survey: a systematic review. Computers in Human Behaviour 2010;26(2):132‐9. [Google Scholar]
Gaggioli 2013
- Gaggioli A, Pioggia G, Tartarisco G, Baldus G, Corda D, Cipresso P, et al. A mobile data collection platform for mental health research. Personal and Ubiquitous Computing 2013;17(2):241‐51. [DOI: 10.1007/s00779-011-0465-2] [DOI] [Google Scholar]
Garrett 1994
- Garrett S, Jenkinson T, Kennedy LG, Whitelock H, Gaisford P, Calin A. A new approach to defining disease status in ankylosing spondylitis: the Bath Ankylosing Spondylitis Disease Activity Index. Journal of Rheumatology 1994;21(12):2286‐91. [PubMed] [Google Scholar]
Ghersi 2009
- Ghersi D, Pang T. From Mexico to Mali: four years in the history of clinical trial registration. Journal of Evidence‐Based Medicine 2009;2(1):1‐7. [DOI: 10.1111/j.1756-5391.2009.01014.x; PUBMED: 21348976] [DOI] [PubMed] [Google Scholar]
Griffin 2012
- Griffin DR, Parsons N, Mohtadi NG, Safran MR, Multicenter Arthroscopy of the Hip Outcomes Research Network. A short version of the International Hip Outcome Tool (iHOT‐12) for use in routine clinical practice. Arthroscopy 2012;28(5):611‐6. [DOI: 10.1016/j.arthro.2012.02.027] [DOI] [PubMed] [Google Scholar]
Groves 2009
- Groves RM, Fowler FJ, Couper MP, Lepkowski JM, Singer E, Tourangeau R. Survey Methodology. 2nd Edition. Chichester: John Wiley & Sons, 2009. [Google Scholar]
Gwaltney 2008
- Gwaltney CJ, Shields AL, Shiffman S. Equivalence of electronic and paper‐and‐pencil administration of patient‐reported outcome measures: a meta‐analytic review. Value in Health 2008;11(2):322‐33. [DOI: 10.1111/j.1524-4733.2007.00231.x] [DOI] [PubMed] [Google Scholar]
Hicks 2001
- Hicks CL, Baeyer CL, Spafford PA, Korlaar I, Goodenough B. The Faces Pain Scale‐Revised: toward a common metric in pediatric pain measurement. Pain 2001;93(2):173‐83. [DOI] [PubMed] [Google Scholar]
Higgins 2001
- Higgins ET, Friedman RS, Harlow RE, Idson LC, Ayduk ON, Taylor A. Achievement orientations from subjective histories of success: promotion pride versus prevention pride. European Journal of Social Psychology 2001;31(1):3‐23. [DOI: 10.1002/ejsp.27] [DOI] [Google Scholar]
Higgins 2011
- Higgins JPT, Green S (editors). Cochrane Handbook for Systematic Reviews of Interventions Version 5.1.0 [updated March 2011]. The Cochrane Collaboration, 2011. Available from www.cochrane‐handbook.org.
Hosking 1995
- Hosking JD, Newhouse MM, Bagniewska A, Hawkins BS. Data collection and transcription. Controlled Clinical Trials 1995;16(2 Suppl):66S‐103S. [DOI] [PubMed] [Google Scholar]
Huckvale 2012
- Huckvale K, Car M, Morrison C, Car J. Apps for asthma self‐management: a systematic assessment of content and tools. BMC Medicine 2012;10:144. [DOI: 10.1186/1741-7015-10-144] [DOI] [PMC free article] [PubMed] [Google Scholar]
Ishii 2004
- Ishii K. Internet use via mobile phone in Japan. Telecommunications Policy 2004;28(1):43‐58. [Google Scholar]
Klasnja 2012
- Klasnja P, Pratt W. Healthcare in the pocket: mapping the space of mobile‐phone health interventions. Journal of Biomedical Informatics 2012;45(1):184‐98. [DOI: 10.1016/j.jbi.2011.08.017] [DOI] [PMC free article] [PubMed] [Google Scholar]
Lampe 1998
- Lampe AJ, Weiler JM. Data capture from the sponsoners' and investigators' perspectives: balancing quality, speed, and cost. Therapeutic Innovation & Regulatory Science 1998;32(4):871‐86. [DOI: 10.1177/009286159803200403] [DOI] [Google Scholar]
Lane 2006
- Lane SJ, Heddle NM, Arnold E, Walker I. A review of randomized controlled trials comparing the effectiveness of hand held computers with paper methods for data collection. BMC Medical Informatics and Decision Making 2006;6:23. [DOI: 10.1186/1472-6947-6-23] [DOI] [PMC free article] [PubMed] [Google Scholar]
Lavrakas 2008
- Lavrakas PJ. Encyclopedia of Survey Research Methods. Los Angeles; London: SAGE Publications, Inc, 2008. [ISBN: 9781412918084] [Google Scholar]
Link 2014
- Link MW, Murphy J, Schober MF, Buskirk TD, Cilds JH, Tesfaye CL. Mobile Technologies for Conducting, Augmenting and Potentially Replacing Surveys: Report of the AAPOR Task Force on Emerging Technologies in Public Opinion Research. 25th April 2014. https://www.aapor.org/AAPORKentico/AAPOR_Main/media/MainSiteFiles/REVISED_Mobile_Technology_Report_Final_revised10June14.pdf (accessed 20 April 2015).
Manfreda 2008
- Manfreda L, Bosnjak M, Berzelak J, Haas I, Vehovar V. Web surveys versus other survey modes ‐ a meta‐analysis comparing response rates. International Journal of Market Research 2008;50(1):79‐104. [Google Scholar]
Marcano Belisario 2013
- Marcano Belisario JS, Huckvale K, Greenfield G, Car J, Gunn LH. Smartphone and tablet self management apps for asthma. Cochrane Database of Systematic Reviews 2013, Issue 11. [DOI: 10.1002/14651858.CD010013.pub2] [DOI] [PMC free article] [PubMed] [Google Scholar]
Mavletova 2014
- Mavletova A, Couper MP. Mobile web survey design: scrolling versus paging, SMS versus e‐mail invitations. Journal of Survey Statistics and Methodology 2014;2(4):498‐518. [DOI: 10.1093/jssam/smu015] [DOI] [Google Scholar]
Oulasvirta 2012
- Oulasvirta A, Rattenbury T, Ma L, Raita E. Habits make smartphone use more pervasive. Personal and Ubiquitous Computing 2012;16:105‐14. [Google Scholar]
Radloff 1977
- Radloff LS. The CES‐D scale: a self‐report depression scale for research in the general population. Applied Psychological Measurement 1977;1:385‐401. [Google Scholar]
REDCap 2009
- Harris PA, Taylor R, Thielke R, Payne J, Gonzalez N, Conde JG. Research electronic data capture (REDCap) ‐ a metadata driven methodology and workflow process for providing translational research informatics support. Journal of Biomedical Informatics 2009;42(2):377‐81. [DOI] [PMC free article] [PubMed] [Google Scholar]
RevMan 2014 [Computer program]
- The Nordic Cochrane Centre, The Cochrane Collaboration. Review Manager (RevMan). Version 5.3. Copenhagen: The Nordic Cochrane Centre, The Cochrane Collaboration, 2014.
Rodgers 2009
- Rodgers M, Sowden A, Petticrew M, Arai L, Roberts H, Britten N, et al. Testing methodological guidance on the conduct of narrative synthesis in systematic reviews: effectiveness of interventions to promote smoke alarm ownership and function. Evaluation 2009;15:49. [DOI: 10.1177/1356389008097871] [DOI] [Google Scholar]
Rodrigues 2012
- Rodrigues R, Shet A, Antony J, Sidney K, Arumugam K, Krishnamurthy S, et al. Supporting adherence to antiretroviral therapy with mobile phone reminders: results from a cohort in South India. PLoS One 2012;7(8):e40723. [DOI: 10.1371/journal.pone.0040723] [DOI] [PMC free article] [PubMed] [Google Scholar]
Sesto 2012
- Sesto ME, Irwin CB, Chen KB, Chourasia AO, Wiegmann DA. Effect of touch screen button size and spacing on touch characteristics of users with and without disabilities. Human Factors 2012;54(3):425‐36. [DOI] [PubMed] [Google Scholar]
Shih 2009
- Shih TH, Fan X. Comparing response rates in e‐mail and paper surveys: a meta‐analysis. Educational Research Review 2009;4(1):26‐40. [DOI: 10.1016/j.edurev.2008.01.003] [DOI] [Google Scholar]
Tourangeau 2000
- Tourangeau R, Rips LJ, Rasinski K. The Psychology of Survey Response. Cambridge: Cambridge University Press, 2000. [Google Scholar]
Wallace 2014
- Wallace LS, Dhingra LK. A systematic review of smartphone applications for chronic pain available for download in the United States. Journal of Opioid Management 2014;10(1):63‐8. [DOI: 10.5055/jom.2014.0193] [DOI] [PubMed] [Google Scholar]
Wells 2014
- Wells T, Bailey JT, Link MW. Comparison of smartphone and online computer survey administration. Social Science Computer Review 2014;32(2):238‐55. [DOI: 10.1177/0894439313505829] [DOI] [Google Scholar]
Wilcox 2012
- Wilcox AB, Gallagher KD, Boden‐Albala B, Bakken SR. Research data collection methods: from paper to tablet computers. Medical Care 2012;50(Suppl):S68‐73. [DOI: 10.1097/MLR.0b013e318259c1e7] [DOI] [PubMed] [Google Scholar]
References to other published versions of this review
Marcano Belisaro 2014
- Marcano Belisario JS, Huckvale K, Saje A, Porcnik A, Morrison CP, Car J. Comparison of self administered survey questionnaire responses collected using mobile apps versus other methods. Cochrane Database of Systematic Reviews 2014, Issue 4. [DOI: 10.1002/14651858.MR000042] [DOI] [PMC free article] [PubMed] [Google Scholar]