Abstract
Trigeminal sensorimotor activity stimulates arousal and cognitive performance, likely through activation of the locus coeruleus (LC). In this study we investigated, in normal subjects, the effects of bilateral trigeminal nerve stimulation (TNS) on the LC-dependent P300 wave, elicited by an acoustic oddball paradigm. Pupil size, a proxy of LC activity, and electroencephalographic power changes were also investigated. Before TNS/sham-TNS, pupil size did not correlate with P300 amplitude across subjects. After TNS but not sham-TNS, a positive correlation emerged between P300 amplitude and pupil size within frontal and median cortical regions. TNS also reduced P300 amplitude in several cortical areas. In both groups, before and after TNS/sham-TNS, subjects correctly indicated all the target stimuli. We propose that TNS activates LC, increasing the cortical norepinephrine release and the dependence of the P300 upon basal LC activity. Enhancing the signal-to-noise ratio of cortical neurons, norepinephrine may improve the sensory processing, allowing the subject to reach the best discriminative performance with a lower level of neural activation (i.e., a lower P300 amplitude). The study suggests that TNS could be used for improving cognitive performance in patients affected by cognitive disorders or arousal dysfunctions.
Keywords: acoustic oddball, locus coeruleus activity, pupil size, P300, trigeminal nerve stimulation
Introduction
Trigeminal afferents play a particularly important role in the control of arousal/alertness and attention through their connections with structures belonging to the Ascending Reticular Activating System (ARAS) (Roger et al. 1956). Trigeminal primary and/or secondary neurons project to the pontomedullary reticular formation, to the cholinergic pedunculopontine and the laterodorsal tegmental nuclei, to the histaminergic tuberomammillary, and to the noradrenergic locus coeruleus (LC) neurons (De Cicco et al. 2018). In particular, trigeminal mesencephalic nucleus (Me5), including the cell bodies of spindle afferents in masticatory muscles and of mechanoreceptors in the periodontal ligament (Yoshida et al. 2017), projects to LC (Luo et al. 1991) that affects vigilance via its mainly ipsilateral projections to cortical regions (Waterhouse et al. 1983) and influences cognitive processes (Usher et al. 1999).
Accordingly, in humans, chewing quickens cognitive processing (Hirano et al. 2013) and improves arousal (Allen and Smith 2012; Johnson et al. 2012) and attention (Tucha et al. 2004), leading to an increment of blood perfusion in several cortical and subcortical structures (Hirano et al. 2013). Moreover, chewing can prevent degenerative process in older animals (Chen et al. 2015) and, possibly, in humans, where it is related to preserved cognitive functions (Moriya et al. 2011), thus prompting its use in the field of neurorehabilitation for contrasting the cognitive decline associated to age-related neurodegenerative processes (Wilson et al. 2010).
In order to exploit the potential protective effects of mastication on the brain, the subjects have to be motivated to perform this activity, a condition that can be absent in individuals affected by cognitive impairments or by disorders of consciousness. This problem requires a noninvasive method for eliciting trigeminal activation, mimicking—to some extent—the sensorimotor signals elicited during chewing, by-passing the subject’s cooperation.
In this respect, the trigeminal nerve stimulation (TNS) applied to the mandibular branch—currently used in the gnathology practice for inducing masticatory muscle relaxation and achieving a correct occlusal contact between the dental arches (Nnoaham and Kumbang 2008; De Cicco 2012)—activates the large proprioceptive fibers that fire rhythmically during mastication (Goodwin and Luschei 1975).
An established quantitative index of cognitive processing is represented by the P300 wave, an event-related potential (ERP), consisting in a parietal–central positivity occurring together with the conscious detection of stimuli carrying important information about the performed task (Huang et al. 2015). This ERP has been largely studied and can be elicited in populations of patients with minimal or absent levels of collaboration (Polich and Corey-Bloom 2005; Parra et al. 2012; Pedroso et al. 2012; Wang et al. 2017; Zhang et al. 2017). Although several factors may affect the P300 amplitude, in memory recall tasks of written words, its size was related to task performance (Polich 2007). More specifically, the recall of a word dispersed among others of slightly different font was easier for those words eliciting P300 with a larger amplitude. This suggests an association between P300 amplitude and subsequent recognition performance.
In particular, the P300 wave can be elicited during an acoustic oddball paradigm, when a subject detects infrequent target stimuli randomly presented in a train of standard stimuli; it shows a latency of approximately 250–400 ms from stimulus onset (Huang et al. 2015). In this condition, the P300 amplitude reflects the amount of brain activity related to updating the mental stimulus representation in response to the target stimuli (Polich 2007; van Dinteren et al. 2014). In parallel, the P300 latency is related to stimuli classification speed, which reflects the time required for the sensory processing leading to target recognition (Polich 2007; van Dinteren et al. 2014). Consistently, the P300 and the associated detection performance are lower in patients affected by Alzheimer’s disease and schizophrenia (Jeon and Polich 2003; Hedges et al. 2014).
The P300 can be recorded over extended frontal–central–parietal regions and its rather stereotyped latency suggests that it could be attributed to a diffuse system synchronizing the activity of several cortical regions (Nieuwenhuis et al. 2005). There is indeed evidence that at least some components of this wave are related to the phasic LC activity elicited by the stimulus, which induces a widespread noradrenaline release at cortical level. In particular, the decrease of norepinephrine release by clonidine in humans leads to a reduced P300 amplitude and target recognition in an acoustic oddball paradigm (Nieuwenhuis et al. 2005). In this respect, it has to be noted that the activity level of LC neurons can be inferred by pupil size recordings (Rajkowski et al. 1994; Murphy et al. 2014). For this reason, the relation between pupil size and P300 amplitude was investigated in several studies: despite baseline pupil size was related to the P300 amplitude by an inverted-U relation (Murphy et al. 2011; Hong et al. 2014), the pupil dilation during the task did not correlate with the P300 amplitude (Kamp and Donchin 2015).
In conclusion, the P300 is an indicator of cognitive processing and depends upon the noradrenergic system, whose activity is strongly influenced by sensorimotor trigeminal activity. For these reasons, in order to clarify the suitability of TNS in boosting cognitive performance through LC activation, we studied, in healthy volunteers, its effects on the P300 wave elicited during the acoustic oddball task as well as on the electroencephalographic (EEG) activity recorded at rest. Moreover, since LC activity is closely related to pupil size, the effects of TNS on pupil diameter were also evaluated.
Materials and Methods
This study was approved by the Ethical Committee of the University of Pisa (approval no. 12/2019). According to the Declaration of Helsinki, each subject signed an informed consent.
Subjects
Experiments were carried out in 13 voluntary healthy subjects (8 females) aged between 24 and 31 years (mean ± standard deviation [SD], age: 27.4 ± 2.4), not affected by pain in the masticatory/neck muscles and by neurological, psychiatric, metabolic, or endocrine diseases.
Experimental Procedure
Participants were seated in a comfortable armchair located in the laboratory. One couple of recording electrodes for surface electromyography (EMG) recordings was applied over the masseter belly on both sides, and the subjects were prepared for the EEG recording. Each session started with a 5-min eyes-open recording. In the eyes-open condition, participants were instructed to fixate a small cross presented on the wall in front of them. Then, the pupil size was evaluated. Since the occlusal condition strongly affects the pupil diameter (De Cicco et al. 2014, 2016), recordings were taken both with the arches slightly apart and in contact. At this point, a 20-min auditory oddball task was performed. For this purpose, subjects wore acoustic headphones through which a random sequence of frequent standard tones (n = 400) and rare (target) oddball tones (n = 100) were simultaneously delivered to both ears. Rare and frequent stimuli were pure tones lasting 50 ms at 2000 and 1000 Hz frequencies, respectively. Participants were instructed to mentally count the rare tones and, at the conclusion of the oddball, to report their number. Subsequently, TNS was performed in 7 subjects (4 females, age: 26.9 ± 2.0) and sham-TNS in another sample of 6 subjects (4 females, age: 28.0 ± 2.9). Soon after the end of TNS/sham-TNS the oddball task was repeated, followed by pupil size and eye-open EEG recordings (Fig. 1).
Figure 1 .

Time course of the experimental protocol. The line represents the whole experimental protocol and each box corresponds to a specific step. For each step the duration expressed in minutes is reported.
Trigeminal Nerve Stimulation
TNS consisted of 10-min bilateral transcutaneous stimulation of the trigeminal motor branches through couples of electrodes applied at the level of incisura sigmoidea, leading to small and symmetrical mandibular movements (cathodal/anodal current pulses, 0.54 ms, 21–25 mA, 0.618 Hz). The amplitude and frequency of stimulation used in the present experiments were well below the pain threshold. The intensity of the right and left current was adjusted to obtain a symmetrical EMG response (amplitude) of the masseter muscles on both sides.
Sham-TNS
In the sham-TNS condition, electrodes were applied at the level of the incisura sigmoidea of both sides, but no stimulation was given for 10 min.
Pupil Size Evaluation
Pupil diameter was recorded from both eyes in standard condition of artificial lighting by using a corneal topographer–pupillographer (MOD i02, with chin support, CSO), under standard illumination (halogen lamp, white light, ensuring a constant luminance level) while continuously recording pupil size via a camera sensor CCD1/3”, with a 56-mm working distance and at a sampling rate of 120 frames per second (fps). Measurements were triggered with 33 ms of delay with respect to the time the constant level of lightning provided by the device (40 lux) was switched off and before the beginning of pupil dilatation (~300 ms from light off; Bitsios et al. 1996).
Only the initial frame from light-off was analyzed. Measurements were taken in the following order:
with the dental arches 1–2-mm apart, without chin support;
with the dental arches in contact, the chin being supported.
Only measurements taken in position 2 were utilized for the analysis (see Results section).
Diameter values were stored for further analysis and displayed online on the computer screen.
Electrophysiological Recordings and EEG Data Analysis
EEG data were acquired at the sampling rate of 1024 Hz from 20 gold-plated cup electrodes (Fp1, Fpz, Fp2, F7, F3, Fz, F4, F8, T3, C3, C4, T4, T5, P3, P4, T6, O1, Pz, O2, and Cz), affixed with EC2 paste (EC2® Genuine Grass Electrode Cream, Grass Instruments), taped on the scalp and positioned according to the 10–20 International Electrodes Placement System. The reference was placed on a common neutral auricular derivation. Data were analyzed via custom routines based on EEGLAB toolbox (Delorme and Makeig 2004) and Matlab R2017b. Offline, the whole EEG signals were digitally band-pass filtered between 0.5–30 Hz and re-referenced to T5. The EEG data recorded during the oddball tasks and at rest were processed for ERPs and power spectrum density (PSD) analysis, respectively.
Event Related Potentials
The EEG data were segmented into epochs time-locked to the onset of the stimuli, with pre- and poststimulus time windows of 0.5 and 1 s, respectively. The average baseline, prestimulus value was subtracted from each trial. Epochs with large prominent artifacts were removed by visual inspection followed by Independent Component Analysis (ICA) (Hyvärinen and Oja 2000), for stereotyped artifacts elicited by ocular movements and muscle activation. EEG signals related to standard and target stimuli were separately averaged before and after TNS/sham-TNS.
For ERPs analysis, the amplitude and latency of N100, P200, and P300 were extracted from 19 electrodes for each subject. Figure 2 shows the grand average obtained for the whole population of TNS group at 3 different derivations (Fz, Cz, Pz), before and after stimulation.
Figure 2 .
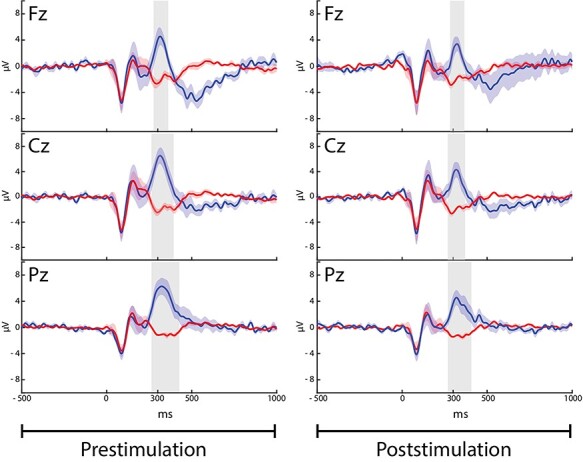
Grand average (n = 7) of ERPs waveforms measured in Fz, Cz, and Pz electrodes within the TNS group. Blue and red traces represent responses to the rare and frequent standard stimuli, respectively. The color-coded shadowed regions around the traces correspond to standard error (SE) values. Significant differences between rare and frequent responses over the interval 250–400 ms identify the P300 event and are here highlighted by the gray areas (Table 1).
The amplitudes of the N100, P200, and P300 peaks were determined using an automatic local peak detection relative to different time windows as follows. N100 and P200 reflect the neural processes that are sensitive to sound stimulus features (intensity, frequency) (Remijn et al. 2014). As a routine procedure, N100, P200, and P300 were identified as the most negative (for N100) and positive (for P200 and P300) peaks in the 0–130, 150–250, and 250–400 ms time windows following stimulus onset, respectively. The latency of each ERP component was defined as the point in time of the peak with respect to the stimulus onset.
Power Spectrum Density
EEG resting data, relative to the 5-min periods in the eyes open condition, were processed by rejecting the same ICA components discarded during ERPs processing. The EEGLAB Matlab tool “spectopo” function was used for obtaining the PSD (in μv2) in all the EEG channels with a resolution of 1 Hz. Further analysis was clustered in standard delta (0.5–4 Hz), theta (4–8 Hz), alpha (8–13 Hz), and beta (13–30 Hz) bands.
Cognitive Performance
The cognitive performance was evaluated as the difference between the actual number of rare tones included in the oddball sequence and that reported by the subject.
Statistical Analysis
The original database is publicly available online at the following address: osf.io/jsvnk.
Pupil Size Evaluation
The differences in average pupil size and anisocoria (individual absolute difference between right and left pupil size), evaluated with the dental arches in contact between the 2 groups (TNS/sham-TNS) or between pre- and poststimulation, were evaluated by independent and paired t-tests, respectively. Moreover, possible linear correlations between pupil size and P300 amplitude were analyzed using Pearson’s correlations.
Event-Related Potentials
Measurements were focused on N100, P200, and P300 peak amplitudes and latencies. P300 peak and latency were evaluated only for target stimuli. To investigate the changes in all the ERPs components between pre- and poststimulation, a paired sample t-test was used (Li et al. 2019) on the corresponding peak features. Moreover, a point-by-point comparison was performed between responses to rare and frequent stimuli in the whole poststimulus interval by t-test, in order to highlight the P300-related time interval, where the EEG signal relative to the rare stimulus response was significantly higher than that relative to the frequent stimulus (Table 1).
Table 1.
P300 intervals
| Stimulation type | Electrode | Rare vs. standard responses | |
|---|---|---|---|
| P300 interval, prestimulation | P300 interval, poststimulation | ||
| TNS | Fz | 275.4 ≤ ms ≤ 363.3 | 283.2 ≤ ms ≤ 365.2 |
| Cz | 262.7 ≤ ms ≤ 393.6 | 268.6 ≤ ms ≤ 369.1 | |
| Pz | 263.7 ≤ ms ≤ 426.8 | 269.5 ≤ ms ≤ 407.2 | |
| sham-TNS | Fz | 252 ≤ ms ≤ 347.7 | 260.7 ≤ ms ≤ 373 |
| Cz | 252 ≤ ms ≤ 367.2 | 260.7 ≤ ms ≤ 421.9 | |
| Pz | 258.8 ≤ ms ≤ 417 | 260.7 ≤ ms ≤ 436.5 | |
Note: P300 intervals detected in Fz, Cz, and Pz, pre- and post-TNS/sham-TNS conditions. In all the points of these intervals, a significant difference (P < 0.05) was found, point-by-point, between the response to rare and the frequent stimuli (Fig. 2).
PSD of EEG Open Eyes
Changes in the oscillatory EEG activity were investigated to evaluate the effects of TNS/sham-TNS on ongoing brain activity. In particular, for each electrode, pre- and post-TNS/sham-TNS spectral power was compared within the delta (0.5–4 Hz), theta (4–8 Hz), alpha (8–13 Hz), and beta (12–30 Hz) bands, with a resolution of 1 Hz bins, through a paired t-test.
Cognitive Performance
The effects of TNS/sham-TNS on the number of errors made in the oddball paradigms were evaluated by paired t-test.
All statistical analyses were conducted with both Matlab—Statistical Toolbox and the Statistical Package for Social Sciences (SPSS, version 20). The level of statistical significance was set at P < 0.05. To control for possible false positives introduced by multiple comparisons, a bootstrap procedure was used. Subjects were randomly extracted from both TNS and sham-TNS groups for a number of times corresponding to the sample size of each experimental group (sham-TNS: n = 6; TNS: n = 7), so to generate new populations (either sham-TNS or TNS) where a given subject could be represented more than once. Within the populations so obtained, the amplitudes of P300 observed before and after TNS/sham-TNS were compared by paired t-test for each of the 19 electrodes. The random extraction from the 2 groups and the comparison of the P300 amplitudes was repeated 1000 times and the average P values and their 5% confidence intervals were evaluated in both groups for each electrode.
The same approach was implemented to compare the changes in EEG power induced by TNS/sham-TNS in the different frequency bands. Thus, data relative to each of the 1000 random extractions were used to perform 30 (frequency points) × 19 (electrodes) comparisons of the power values observed before and after TNS/sham-TNS.
Results
Event-Related Potentials
The individual and grand averages of scalp EEG signals recorded before and after TNS/sham-TNS revealed typical ERPs responses to the target stimuli consisting of N100 and P200 followed by P300 waveforms. The P300 was not found after frequent stimuli (Fig. 2) and showed a typical midline central–parietal distribution (Fig. 3) (Picton 1992). The extent of P300 intervals recorded at the different electrodes is shown in Table 1.
Figure 3 .
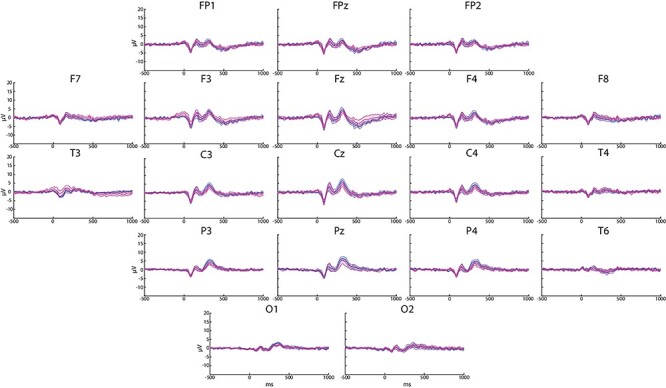
Grand average (n = 7) of ERP responses to rare stimuli for the TNS group recorded at all the electrodes. The blue and the magenta lines represent the pre- and the poststimulation waveforms, respectively. The shadowed regions around the traces correspond to SE values.
T-test comparisons showed no differences in N100 and P200 amplitude and latency between pre- and post-TNS or sham-TNS, with the only exception of O1 and O2, where sham-TNS modified the amplitude of P200 (O1: from 2.1 ± 1.19 to 1.43 ± 0.97 μV, P = 0.022) and N100 (O2: from −1.22 ± 1.13 to −1.72 ± 1.35 μV, P = 0.010), respectively. As to the P300, this component showed a poststimulation amplitude decrease in the TNS group, statistically significant in 8 out of 19 electrodes (Fig. 4).
Figure 4 .
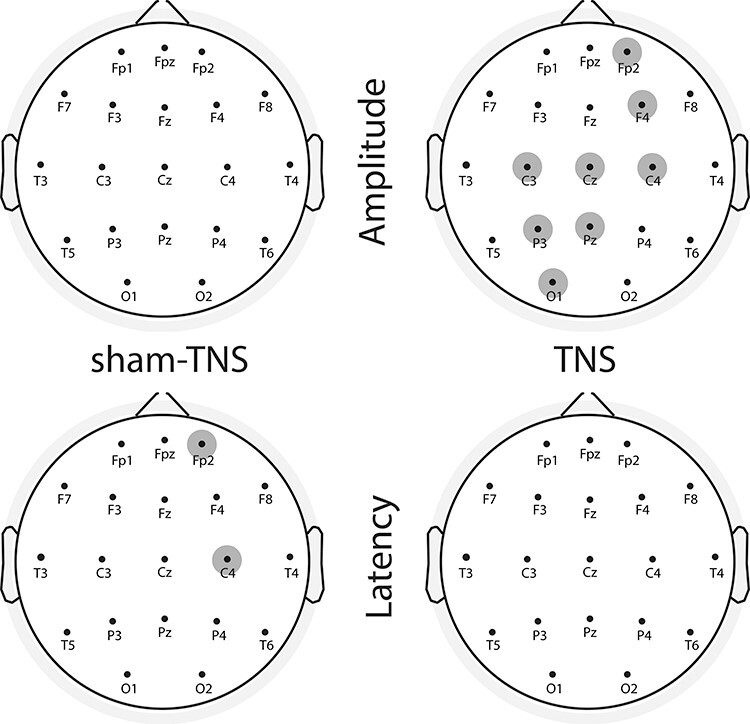
Results of the statistical analysis for the P300 component in sham-TNS/TNS groups. The electrodes showing significant differences (in amplitude or in latency) between pre- and post-stimulation are indicated by the highlighted electrodes.
Following the bootstrap-based procedure the significance was maintained at all these electrodes, but C4 (P = 0.093) (Fig. 5).
Figure 5 .
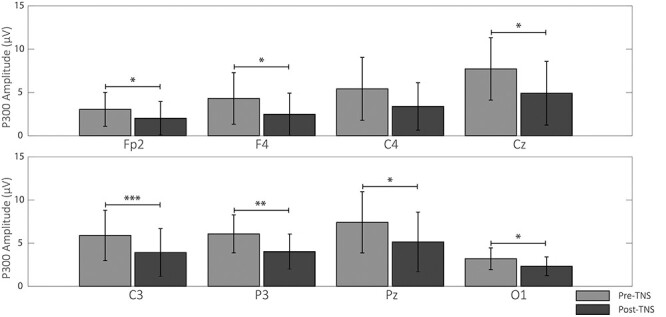
P300 amplitude before and after TNS. Mean ± SD of the P300 peak amplitude in pre- (light gray bars) and post- (heavy gray bars) TNS condition evaluated at the electrodes showing a significant pre–post difference, based on uncorrected P values. Asterisks indicate the significance level of the corresponding comparison after correction through bootstrap procedure (*P < 0.05**; P < 0.01***; P < 0.005). See text for further explanations.
As for the P300 latency, this changed only at FP2 (from 310.22 ± 35.99 to 322.43 ± 31.54 ms, P = 0.029) and C4 electrodes (from 301.11 ± 18.72 to 309.41 ± 18.13 ms, P = 0.023) in the sham-TNS group. This result was confirmed by the bootstrap procedure. Although the P300 amplitude tended to be higher in the prestimulation period in the sham-TNS with respect to TNS groups, none of these differences reached statistical significance. Moreover, no between-groups difference in latencies could be found. Figure 6 shows the superimposition of ERP average response to rare tones of all 19 EEG electrodes, aligned to stimulus onset, recorded before and after TNS and the corresponding average scalp potential maps obtained at the latencies of N100, P200, P300, and at 550-ms poststimulus onset.
Figure 6 .
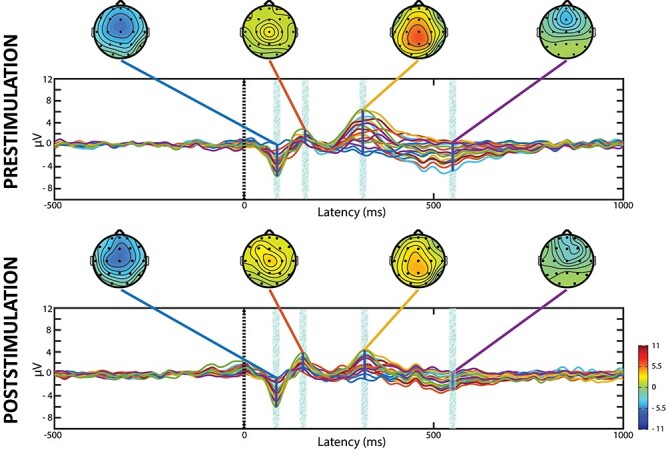
Grand average ERPs evaluated in the TNS group for each of the 19 channels investigated have been superimposed before and after the stimulus. The scalp maps show the topographic distributions of voltage value, color-coded and recorded at the times of N100, P200, and P300 peaks and at 550-ms poststimulus onset.
As shown in Figure 7, where pre- and poststimulation data were averaged, the N100, P200, and P300 waveforms were spatially consistent across subjects. The N100 and the P200 scalp maps showed greater negativity in the frontal and in the central regions, respectively. The P300 was observed diffusely from frontal to parietal regions both in the sham-TNS and in the TNS groups.
Figure 7 .
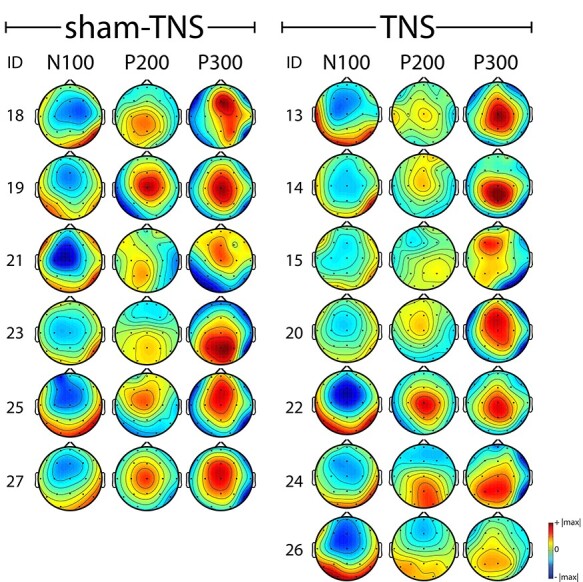
Scalp maps for each and all subjects, belonging to sham-TNS and TNS groups, showing EEG activations at N100, P200, and P300 latency. In both groups, each line corresponds to a single subject. Maps were obtained by averaging pre- and post-TNS-sham/TNS stimulation. In each subject, the range of the color scale was the same in all the scalp maps and corresponded to ±the highest absolute value observed at the 3 time points.
PSD of EEG Open Eyes
Power spectra of EEG open eyes signal obtained in the pre- and poststimulation periods were compared by paired t-test for TNS and sham-TNS groups. As shown in Figure 8, point-by-point analysis of the power spectrum (1 Hz bins) showed that several frequency clusters displayed significant differences between pre- and poststimulation. It is worth noting that in the TNS group (Fig. 8, lower row), a significant reduction was observed at 24 frequency points within the beta band, distributed across 7 electrodes, whereas this was the case only for one point (electrode) in the same band of sham-TNS group. However, in the TNS group, the bootstrapping procedure did not confirm significance for 23 out of the 24 frequency bins.
Figure 8 .
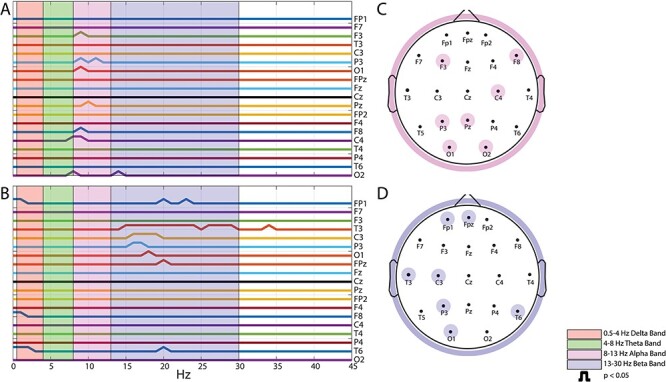
Comparison between pre- and poststimulation values of the PSD of rest EEG signal (open-eyes) relative to sham-TNS (A, C) and TNS (B, D). In A and B, each line corresponds to a single electrode. Upper deflections represent points of significant pre-/postdifferences. The highlighted areas in red, green, pink, and blue represent the delta (0.5–4 Hz), theta (4–8 Hz), alpha (8–13 Hz) and beta (13–30 Hz) band, respectively. In C and D, the highlighted electrodes show significant PSD differences in the alpha and in the beta band for the sham-TNS and TNS conditions, respectively.
On the other hand, following sham-TNS (Fig. 8, upper row), 9 frequency bins within the alpha range showed a significant enhancement. The bootstrapping procedure showed that in 6 of these bins and in 2 of the adjacent ones P values ranged from 0.055 to 0.025, whereas from 0.067 to 0.084 in the remaining 3.
Pupil Size Measurements and Correlations with P300 Amplitude
Since no significant differences were observed between pupil size recorded with the dental arches apart and in contact, neither before, nor after TNS/sham-TNS, only results obtained in the contact position will be described. The average pupil size evaluated in contact position, before TNS/sham-TNS, corresponded to 3.91 ± 0.54 and 3.85 ± 0.46 mm, respectively, without significant differences between the 2 experimental groups. Details about right, left, and average pupil size values obtained with the arches in contact, pre- and post-TNS/sham-TNS are given in Figure 9.
Figure 9 .
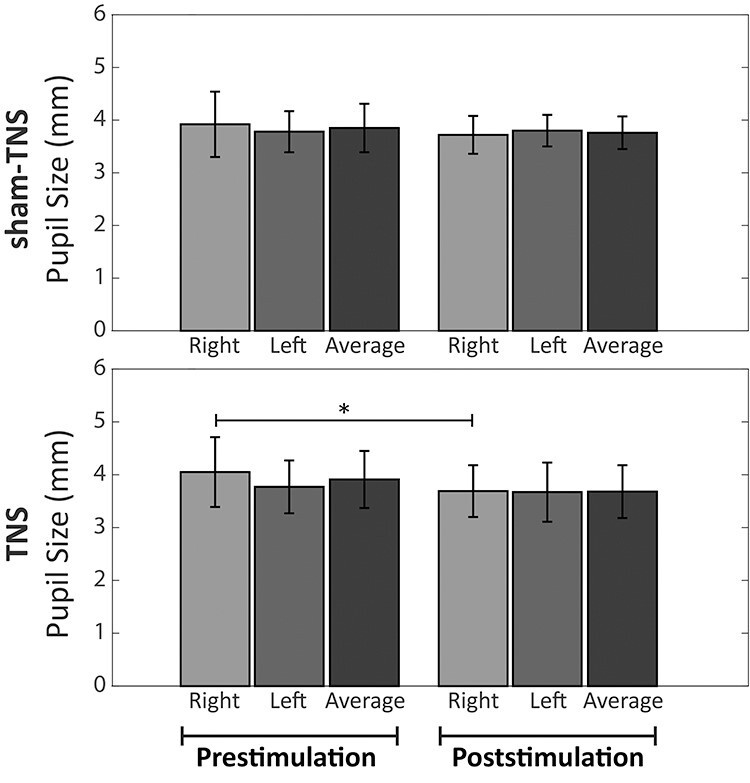
Mean ± SD of pupil size evaluated with the dental arches in contact in pre- and post-TNS/sham-TNS conditions.
When data obtained pre- and post-TNS/sham-TNS were compared, a significant difference emerged only for the right side of the TNS group when the teeth were in contact, pupil size being 9% smaller in the poststimulus period (Fig. 9).
The anisocoria values (absolute difference between right and left pupil size) observed in contact position before TNS and sham-TNS corresponded to 0.36 ± 0.40 and 0.37 ± 0.31, respectively. These values were reduced, following both treatments, to 0.24 ± 0.23 and 0.22 ± 0.34, respectively. These differences, however, did not reach the significance level.
The study of the correlation between pupil size and P300 amplitude was restricted to F3, C3, P3 (left side), Fz, Cz, Pz (middle), and F4, C4, P4 (right side), where the P300 was prominent (Fig. 3) (Picton 1992). So, for this analysis, the significance level acceptable for a single correlation corresponded to P = 0.006 (Bonferroni’s correction). This analysis was performed separately for TNS and sham-TNS groups, before and after the treatment. Before the treatment, left, average, and right pupil size values were not correlated with left, middle, and right values of P300 amplitude, neither in the TNS nor in the sham-TNS group, whatever electrode (frontal, central, and parietal) was considered.
However, following TNS, but not sham-TNS, a significant positive correlation could be found between the P300 recorded at Fz and the average pupil size (R = 0.905, P = 0.005). Individual values of P300 amplitude recorded at Fz are represented as a function of the average pupil size by black dots in Figure 10. At Fz, before TNS, the correlation coefficient was 0.546 (P = 0.205).
Figure 10 .
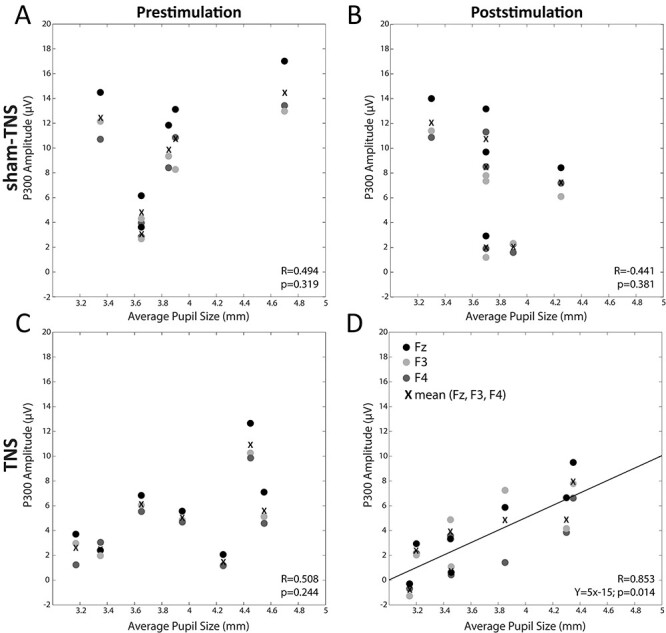
Regression analysis between the P300 amplitude in frontal electrodes and the average pupil size observed before (A,C) and after (B,D) sham-TNS (A,B) and TNS (C,D) condition. The regression lines have calculated for the average values of the 3 frontal electrodes represented in the plot, which are indicated by crosses.
As to the sham-TNS group, no correlation was found at Fz, neither before (R = 0.502, P = 0.310), nor after the treatment (R = 0.448, P = 0.373). A further analysis was performed by averaging the P300 values of left, central, and right electrodes at frontal (F: F3, Fz, F4), central (C: C3, Cz, C4), and parietal (P: P3, Pz, P4) regions. Moreover, we also averaged the P300 values of frontal, central, and parietal electrodes located on the left (L: F3, C3, P3), on the right (R: F4, C4, P4) and on the midline (M: Fz, Cz, Pz). These averaged P300 values were correlated with the left, right, and average pupil size, respectively. In this analysis, according to Bonferroni’s correction, the significance level was P = 0.017. Also, for these averaged values, no significant correlation could be found in the prestimulation period both in the TNS and the sham-TNS group. In particular, in the TNS group, before the treatment, the correlation coefficients for the average frontal electrode corresponded to 0.508 (P = 0.245), whereas in the sham-TNS group, pretreatment value was 0.495 (P = 0.318).
The lack of correlation persisted following sham-TNS (R = −0.441, P = 0.381), whereas, following TNS a significant, positive correlation could be found in the frontal region (F: R = 0.853, n = 7, P = 0.015), with pupil size representing the source of 72% of P300 variability. Figure 10 shows that, although a significant correlation between pupil size and P300 amplitude was observed only for Fz, similar trends characterized also F3 and F4, well fitted by the regression line obtained for the averaged values (Fig. 10D).
When the averaged middle electrodes (Fz, Cz, Pz) were taken into account, in the TNS and sham-TNS group, before the treatment, the correlation coefficients corresponded to 0.547 (P = 0.204) and 0.408 (P = 0.422), respectively. Following stimulation, the correlation coefficient was unmodified in the sham-TNS group (R = 0.538, P = 0.271), whereas increased in the TNS group (R = 0.774, P = 0.041). However, in the latter instance, the corresponding P value was higher than the significance level imposed by Bonferroni’s correction.
Cognitive Performance
In both TNS and sham-TNS groups, the number of errors in the oddball paradigm was not significantly different between pre- and poststimulation periods (pre-TNS: 0.33 ± 0.52; post-TNS: 0.33 ± 0.52, paired t-test NS; pre-sham-TNS: 0.60 ± 1.34; post-sham-TNS: 1.20 ± 1.64, paired t-test: not significant).
Discussion
The present experiments show that the P300 ERPs amplitude decreases following TNS in several brain regions, whereas it was not significantly affected when subjects were resting without stimulation (sham-TNS) for a comparable amount of time. In addition, neither TNS, nor sham-TNS significantly modified the EEG average power spectrum in the delta, theta, alpha, and beta bands. However, in the sham-TNS group, localized significant enhancements in power occurred between 8 and 11 Hz, thus indicating a tendency to cortical synchronization within the alpha band during the experimental session. No major differences in pupil size were observed following both TNS and sham-TNS, except for a 9% decrease in the right pupil size following TNS. Moreover, in both the TNS and sham-TNS groups no correlation was found between P300 amplitude and pupil size before the treatment, whereas a significant, positive correlation in the frontal and midline electrode was observed following TNS but not sham-TNS.
The absence of major TNS effects on the pupil size (an indicator of basal LC activity) is consistent with the study of Tramonti Fantozzi et al. (2017), who showed that short bouts of masticatory activity do not modify pupil size at rest. This activity, however, led to long-lasting effects on cognitive performance, as TNS did on the P300 amplitude in the present experiments. However, in spite of the lack of major TNS-induced pupil size changes, TNS led to a strong correlation between P300 amplitude and pupil size in the frontal and midline brain regions, not observed before the stimulation. We may suggest that repeated trigeminal activation enhances the coupling of this ERP with the basal level of central noradrenergic modulation and that trigeminal activation, anyhow achieved (chewing or TNS), could represent a viable approach capable of modulating noradrenergic afferents, cortical excitability, and performance.
In the present experiments, the P300 amplitude was modified by TNS in frontal, central, and parietal spots. This observation suggests that trigeminal stimulation may modify neural processing in regions that play different functions in the oddball task: orienting selective attention, elaborating sensory information, storing, and retrieving information, comparing present sensory experience with memory content and, finally, mentally counting the detected rare events (Polich 2007).
Although TNS has been repeatedly tested as a noninvasive treatment for refractory epilepsy and mood disorders (DeGiorgio et al. 2003, 2006, 2013; Aaronson et al. 2013), only another study—to the best of our knowledge—has so far investigated its effect on the P300 amplitude/latency in healthy subjects (Gadeyne et al. 2016). In this paper, the ophthalmic trigeminal branch was activated without significant effects on the P300 amplitude. So, the effects observed in the present experiments could be attributed to the activation of inputs from muscle spindles and periodontal receptors traveling within the mandibular branch.
The extensive connections of the trigeminal input with LC neurons (De Cicco et al. 2018) and the dependence of the P300 generation upon the central noradrenergic system (Nieuwenhuis et al. 2005) are the anatomofunctional ground possibly explaining the present results. However, the knowledge about trigeminal–LC relationships would have suggested an enhancement, rather than a decrease in P300 amplitude following TNS. It is known, in fact that, in subjects showing an asymmetric masseter EMG activity during clenching, pupil size—a fine indicator of the level of LC activity—is larger on the side of higher trigeminal sensorimotor activity (De Cicco et al. 2018), suggesting an excitatory trigeminal input to the ipsilateral LC. Moreover, the P300 is related to phasic LC activity, leading to noradrenaline release from axon terminals (Nieuwenhuis et al. 2005), as indicated by its sensitivity to noradrenergic drugs (Swick et al. 1994; Brown et al. 2015; de Rover et al. 2015) and by the P300 amplitude decrease after LC lesion in monkeys (Pineda et al. 1989). Based on these data, suggesting that an higher noradrenergic activity corresponds to a larger P300 amplitude, it was reasonable to expect an increased P300 amplitude following TNS.
Several factors may modify the P300 amplitude, such as the frequency of the targets (Croft et al. 2003), the probability of the rare events in the oddball sequence (Nieuwenhuis et al. 2005) and the discriminability between rare and frequent events (Picton 1992): all these parameters, however, were kept constant across the experimental sessions. In particular, the ratio between target/standard stimuli always corresponded to 1/4 (Polich 2007).
Moreover, the P300 amplitude is usually increased by motivational instructions that enhance the attention to the task (Carrillo-de-la-Peña and Cadaveira 2000) or by adding another cognitive task to distinguish rare and frequent tones (Alexander et al. 2005). However, none of these confounding factors were present in our experiments.
Finally, the P300 amplitude depends upon the level of arousal and basal LC activity, as indicated by simultaneous pupil size and ERPs recordings during oddball tasks (Murphy et al. 2011) but, in the present study, the decrease in the P300 amplitude was not associated to major changes in pupil size.
Given the relation between LC activity, P300 amplitude and cognitive performance, the results of this study could be explained when taking into account that, in our subjects, the performance was at the ceiling (>99% of correct reports of rare stimuli) and was not modified, neither by TNS, nor by sham-TNS.
On the bases of our findings, we can speculate that a preceding period of TNS leads to a large release of noradrenaline at cortical level during target discrimination, which modifies the processing of cortical networks and promotes an improvement in detection/recognition skills (Gelbard-Sagiv et al. 2018; Devilbiss 2019). This enhanced efficiency of cortical circuits may persist also when LC activity is back to the prestimulation levels (Klukowski and Harley 1994; Tramonti Fantozzi et al. 2017) and could be related to the signal-to-noise ratio enhancement (Foote et al. 1975; Moxon et al. 2007; Devilbiss 2019) in brain regions involved in perceptual processing (Fazlali et al. 2016). As a result, once the trigeminal nerve has been activated, a lower network activity is necessary for obtaining the same discriminative outcome. In this respect, noradrenaline often reduces both spontaneous and evoked activity when applied to individual neurons (Kasamatsu and Heggelund 1982; Kolta and Reader 1989; Manunta and Edeline 1997; Ego-Stengel et al. 2002; Ikeda et al. 2015). This would result in a lower cortical activation during target recognition, and, in particular, in a lower amplitude of P300, specifically related to this process. This hypothesis is consistent with the assumption that the P300 amplitude reflects the amount of useful sensory information transmitted during perception (Picton 1992). A lower activation in cortical motor areas also underlines skill acquisition in sensorimotor processes (Saling and Phillips 2007; Wu et al. 2008). In this respect, a functional magnetic resonance imaging study (Tramonti Fantozzi et al. 2019) has shown that finger movement executed with a balanced trigeminal input were associated with lower neural activation, which is indicative of higher skill and less attentive effort during motor performance.
Since we did not perform any recording during TNS, we cannot exclude an initial increase in P300 amplitude, due to the enhanced norepinephrine release elicited by the stimulation. However, it is reasonable to assume that the drop in P300 amplitude, observed after TNS, begins during the stimulation and persists after its end.
The results can be also interpreted within the framework of the “adaptive gain theory” proposed by Aston-Jones and Cohen (2005), stating that phasic LC activation during task enhances cortical processing of task-related stimuli, boosting performance, whereas a very low or high basal level of tonic LC activity decreases LC phasic activation promoting task disengagement. It is likely that TNS enhances LC phasic activation, in a manner similar to that achieved by 2 min of chewing (Tramonti Fantozzi et al. 2017). Moreover, the tonic LC activity level does not seem to be modified after chewing and only slightly after TNS. However, following TNS, the underlying enhancement in LC phasic activation could not lead to a performance improvement, already at ceiling. However, the enhanced phasic release of norepinephrine might increase the efficiency of cortical processing leading to a lower neural engagement for achieving an identical task performance.
It still has to be established whether TNS effectively enhances phasic pupil dilation following rare stimuli and whether a reduction of P300 by TNS also underlies more difficult tasks, where the discrimination between target and frequent stimuli has been made challenging by reducing the corresponding difference in spectral content, so that the performance is not at ceiling. Additional studies, applying more demanding cognitive tasks, are necessary to further support the promising perspective of a clinical application. The preliminary observations described in the present report, however, suggest a possible use of the TNS for improving cognitive performance in patients affected by cognitive disorders or ARAS dysfunctions.
Notes
We would like to thank Mrs Cristina Pucci, Mr Francesco Montanari, and Mr Paolo Orsini for their technical support. We are grateful to Dr Silvano Presciuttini for a useful discussion about the statistical approach, to Dr Federico Cucchiara, and to Dr Tommaso Banfi for helping setting up data.
Conflict of Interest: None declared.
Funding
ARPA Foundation, Pisa, Italy (liberal donation to U.F.), the Italian Ministry of Health (grant GR-2011-02348998 to U.F.); University of Pisa, Pisa, Italy (Fondi di Ateneo to D.M., P.d.A, L.B., U.F.).
Contributor Information
Maria Paola Tramonti Fantozzi, Department of Translational Research and of New Surgical and Medical Technologies, University of Pisa, Pisa 56123, Italy.
Fiorenzo Artoni, Bertarelli Foundation Chair in Translational Neuroengineering, Center for Neuroprosthetics, Institute of Bioengineering, School of Engineering, École Polytechnique Fédérale de Lausanne, Genève 1202, Switzerland.
Marco Di Galante, SleepActa s.r.l., Pontedera 56025, Italy.
Lucia Briscese, Department of Translational Research and of New Surgical and Medical Technologies, University of Pisa, Pisa 56123, Italy.
Vincenzo De Cicco, Department of Translational Research and of New Surgical and Medical Technologies, University of Pisa, Pisa 56123, Italy.
Luca Bruschini, Department of Surgical, Medical, Molecular Pathology and Critical Care Medicine, University of Pisa, Pisa 56123, Italy.
Paola d’Ascanio, Department of Translational Research and of New Surgical and Medical Technologies, University of Pisa, Pisa 56123, Italy.
Diego Manzoni, Department of Translational Research and of New Surgical and Medical Technologies, University of Pisa, Pisa 56123, Italy.
Ugo Faraguna, Department of Translational Research and of New Surgical and Medical Technologies, University of Pisa, Pisa 56123, Italy; Department of Developmental Neuroscience, IRCCS Fondazione Stella Maris, Pisa 56128, Italy.
Maria Chiara Carboncini, Department of Translational Research and of New Surgical and Medical Technologies, University of Pisa, Pisa 56123, Italy.
References
- Aaronson ST, Carpenter LL, Conway CR, Reimherr FW, Lisanby SH, Schwartz TL, Moreno FA, Dunner DL, Lesem MD, Thompson PM, et al. 2013. Vagus nerve stimulation therapy randomized to different amounts of electrical charge for treatment-resistant depression: acute and chronic effects. Brain Stimul. 6:631–640. [DOI] [PubMed] [Google Scholar]
- Alexander JE, Alexander RG, Crowson B, Machan K, Hall C-A, Lockwood D, Godinez D. 2005. Effects of self-evaluation on the P300 event-related potential. Percept Mot Skills. 100:409–420. [DOI] [PubMed] [Google Scholar]
- Allen AP, Smith AP. 2012. Effects of chewing gum and time-on-task on alertness and attention. Nutr Neurosci. 15:176–185. [DOI] [PubMed] [Google Scholar]
- Aston-Jones G, Cohen JD. 2005. An integrative theory of locus coeruleus-norepinephrine function: adaptive gain and optimal performance. Annu Rev Neurosci. 28:403–450. [DOI] [PubMed] [Google Scholar]
- Bitsios P, Prettyman R, Szabadi E. 1996. Changes in autonomic function with age: a study of pupillary kinetics in healthy young and old people. Age Ageing. 25:432–438. [DOI] [PubMed] [Google Scholar]
- Brown SBRE, van der Wee NJA, van Noorden MS, Giltay EJ, Nieuwenhuis S. 2015. Noradrenergic and cholinergic modulation of late ERP responses to deviant stimuli. Psychophysiology. 52:1620–1631. [DOI] [PubMed] [Google Scholar]
- Carrillo-de-la-Peña MT, Cadaveira F. 2000. The effect of motivational instructions on P300 amplitude. Neurophysiol Clin. 30:232–239. [DOI] [PubMed] [Google Scholar]
- Chen H, Iinuma M, Onozuka M, Kubo K-Y. 2015. Chewing maintains hippocampus-dependent cognitive function. Int J Med Sci. 12:502–509. [DOI] [PMC free article] [PubMed] [Google Scholar]
- Croft RJ, Gonsalvez CJ, Gabriel C, Barry RJ. 2003. Target-to-target interval versus probability effects on P300 in one- and two-tone tasks. Psychophysiology. 40:322–328. [DOI] [PubMed] [Google Scholar]
- De Cicco V. 2012. Central syntropic effects elicited by trigeminal proprioceptive equilibrium in Alzheimer’s disease: a case report. J Med Case Reports. 6:161. [DOI] [PMC free article] [PubMed] [Google Scholar]
- De Cicco V, Barresi M, Tramonti Fantozzi MP, Cataldo E, Parisi V, Manzoni D. 2016. Oral implant-prostheses: new teeth for a brighter brain. PLoS One. 11:e0148715. [DOI] [PMC free article] [PubMed] [Google Scholar]
- De Cicco V, Cataldo E, Barresi M, Parisi V, Manzoni D. 2014. Sensorimotor trigeminal unbalance modulates pupil size. Arch Ital Biol. 152:1–12. [PubMed] [Google Scholar]
- De Cicco V, Tramonti Fantozzi MP, Cataldo E, Barresi M, Bruschini L, Faraguna U, Manzoni D. 2018. Trigeminal, visceral and vestibular inputs may improve cognitive functions by acting through the locus coeruleus and the Ascending Reticular Activating System: a new hypothesis. Front Neuroanat. 11:1–17. [DOI] [PMC free article] [PubMed] [Google Scholar]
- de Rover M, Brown SBRE, Band GP, Giltay EJ, van Noorden MS, van der Wee NJA, Nieuwenhuis S. 2015. Beta receptor-mediated modulation of the oddball P3 but not error-related ERP components in humans. Psychopharmacology (Berl). 232:3161–3172. [DOI] [PMC free article] [PubMed] [Google Scholar]
- DeGiorgio CM, Shewmon A, Murray D, Whitehurst T. 2006. Pilot study of trigeminal nerve stimulation (TNS) for epilepsy: a proof-of-concept trial. Epilepsia. 47:1213–1215. [DOI] [PubMed] [Google Scholar]
- DeGiorgio CM, Shewmon DA, Whitehurst T. 2003. Trigeminal nerve stimulation for epilepsy. Neurology. 61:421–422. [DOI] [PubMed] [Google Scholar]
- DeGiorgio CM, Soss J, Cook IA, Markovic D, Gornbein J, Murray D, Oviedo S, Gordon S, Corralle-Leyva G, Kealey CP, et al. 2013. Randomized controlled trial of trigeminal nerve stimulation for drug-resistant epilepsy. Neurology. 80:786–791. [DOI] [PMC free article] [PubMed] [Google Scholar]
- Delorme A, Makeig S. 2004. EEGLAB: an open source toolbox for analysis of single-trial EEG dynamics including independent component analysis. J Neurosci Methods. 134:9–21. [DOI] [PubMed] [Google Scholar]
- Devilbiss DM. 2019. Consequences of tuning network function by tonic and phasic locus coeruleus output and stress: regulating detection and discrimination of peripheral stimuli. Brain Res. 1709:16–27. [DOI] [PubMed] [Google Scholar]
- Ego-Stengel V, Bringuier V, Shulz DE. 2002. Noradrenergic modulation of functional selectivity in the cat visual cortex: an in vivo extracellular and intracellular study. Neuroscience. 111:275–289. [DOI] [PubMed] [Google Scholar]
- Fazlali Z, Ranjbar-Slamloo Y, Adibi M, Arabzadeh E. 2016. Correlation between cortical state and locus coeruleus activity: implications for sensory coding in rat barrel cortex. Front Neural Circuits. 10:1–16. [DOI] [PMC free article] [PubMed] [Google Scholar]
- Foote SL, Freedman R, Oliver AP. 1975. Effects of putative neurotransmitters on neuronal activity in monkey auditory cortex. Brain Res. 86:229–242. [DOI] [PubMed] [Google Scholar]
- Gadeyne S, Bourgeois A, Boon P, Carrette E, Carrette S, Raedt R, Vonck K. 2016. The effect of trigeminal nerve stimulation (TNS) on the noradrenergic signaling in the brains of healthy volunteers. Front Aging Neurosci. Conference Abstract: 6th Belgian Brain Congress. [Google Scholar]
- Gelbard-Sagiv H, Magidov E, Sharon H, Hendler T, Nir Y. 2018. Noradrenaline modulates visual perception and late visually evoked activity. Curr Biol 28. e6:2239–2249. [DOI] [PubMed] [Google Scholar]
- Goodwin GM, Luschei ES. 1975. Discharge of spindle afferents from jaw-closing muscles during chewing in alert monkeys. J Neurophysiol. 38:560–571. [DOI] [PubMed] [Google Scholar]
- Hedges D, Janis R, Mickelson S, Keith C, Bennett D, Brown BL. 2014. P300 amplitude in Alzheimer’s disease: a meta-analysis and meta-regression. Clin EEG Neurosci. 47:48–55. [DOI] [PubMed] [Google Scholar]
- Hirano Y, Obata T, Takahashi H, Tachibana A, Kuroiwa D, Takahashi T, Ikehira H, Onozuka M. 2013. Effects of chewing on cognitive processing speed. Brain Cogn. 81:376–381. [DOI] [PubMed] [Google Scholar]
- Hong L, Walz JM, Sajda P. 2014. Your eyes give you away: prestimulus changes in pupil diameter correlate with poststimulus task-related EEG dynamics. PLoS One. 9:e91321. [DOI] [PMC free article] [PubMed] [Google Scholar]
- Huang W-J, Chen W-W, Zhang X. 2015. The neurophysiology of P 300--an integrated review. Eur Rev Med Pharmacol Sci. 19:1480–1488. [PubMed] [Google Scholar]
- Hyvärinen A, Oja E. 2000. Independent component analysis: algorithms and applications. Neural Netw. 13:411–430. [DOI] [PubMed] [Google Scholar]
- Ikeda MZ, Jeon SD, Cowell RA, Remage-Healey L. 2015. Norepinephrine modulates coding of complex vocalizations in the songbird auditory cortex independent of local neuroestrogen synthesis. J Neurosci. 35:9356–9368. [DOI] [PMC free article] [PubMed] [Google Scholar]
- Jeon Y-W, Polich J. 2003. Meta-analysis of P300 and schizophrenia: patients, paradigms, and practical implications. Psychophysiology. 40:684–701. [DOI] [PubMed] [Google Scholar]
- Johnson AJ, Miles C, Haddrell B, Harrison E, Osborne L, Wilson N, Jenks R. 2012. The effect of chewing gum on physiological and self-rated measures of alertness and daytime sleepiness. Physiol Behav. 105:815–820. [DOI] [PubMed] [Google Scholar]
- Kamp S-M, Donchin E. 2015. ERP and pupil responses to deviance in an oddball paradigm. Psychophysiology. 52:460–471. [DOI] [PubMed] [Google Scholar]
- Kasamatsu T, Heggelund P. 1982. Single cell responses in cat visual cortex to visual stimulation during iontophoresis of noradrenaline. Exp Brain Res. 45:317–327. [DOI] [PubMed] [Google Scholar]
- Klukowski G, Harley CW. 1994. Locus coeruleus activation induces perforant path-evoked population spike potentiation in the dentate gyrus of awake rat. Exp Brain Res. 102:165–170. [DOI] [PubMed] [Google Scholar]
- Kolta A, Reader TA. 1989. Modulatory effects of catecholamines on neurons of the rat visual cortex: single-cell iontophoretic studies. Can J Physiol Pharmacol. 67:615–623. [DOI] [PubMed] [Google Scholar]
- Li F, Yi C, Jiang Y, Liao Y, Si Y, Dai J, Yao D, Zhang Y, Xu P. 2019. Different contexts in the oddball paradigm induce distinct brain networks in generating the P300. Front Hum Neurosci. 12:1–10. [DOI] [PMC free article] [PubMed] [Google Scholar]
- Luo PF, Wang BR, Peng ZZ, Li JS. 1991. Morphological characteristics and terminating patterns of masseteric neurons of the mesencephalic trigeminal nucleus in the rat: an intracellular horseradish peroxidase labeling study. J Comp Neurol. 303:286–299. [DOI] [PubMed] [Google Scholar]
- Manunta Y, Edeline J-M. 1997. Effects of noradrenaline on frequency tuning of rat auditory cortex neurons. Eur J Neurosci. 9:833–847. [DOI] [PubMed] [Google Scholar]
- Moriya S, Tei K, Murata A, Yamazaki Y, Hata H, Muramatsu M, Kitagawa Y, Inoue N, Miura H. 2011. Associations between self-assessed masticatory ability and higher brain function among the elderly. J Oral Rehabil. 38:746–753. [DOI] [PubMed] [Google Scholar]
- Moxon KA, Devilbiss DM, Chapin JK, Waterhouse BD. 2007. Influence of norepinephrine on somatosensory neuronal responses in the rat thalamus: a combined modeling and in vivo multi-channel, multi-neuron recording study. Brain Res. 1147:105–123. [DOI] [PMC free article] [PubMed] [Google Scholar]
- Murphy PR, O’Connell RG, O’Sullivan M, Robertson IH, Balsters JH. 2014. Pupil diameter covaries with BOLD activity in human locus coeruleus. Hum Brain Mapp. 35:4140–4154. [DOI] [PMC free article] [PubMed] [Google Scholar]
- Murphy PR, Robertson IH, Balsters JH, O’connell RG. 2011. Pupillometry and P3 index the locus coeruleus-noradrenergic arousal function in humans. Psychophysiology. 48:1532–1543. [DOI] [PubMed] [Google Scholar]
- Nieuwenhuis S, Aston-Jones G, Cohen JD. 2005. Decision making, the P3, and the locus coeruleus-norepinephrine system. Psychol Bull. 131:510–532. [DOI] [PubMed] [Google Scholar]
- Nnoaham KE, Kumbang J. 2008. Transcutaneous electrical nerve stimulation (TENS) for chronic pain. Cochrane Database Syst Rev. CD003222. [DOI] [PubMed] [Google Scholar]
- Parra M, Ascencio L, Urquina H, Manes F, Ibanez A. 2012. P300 and neuropsychological assessment in mild cognitive impairment and Alzheimer dementia. Front Neurol. 3:1–10. [DOI] [PMC free article] [PubMed] [Google Scholar]
- Pedroso RV, Fraga FJ, Corazza DI, Andreatto CAA, Coelho FG de M, Costa JLR, Santos-Galduróz RF. 2012. P300 latency and amplitude in Alzheimer’s disease: a systematic review. Braz J Otorhinolaryngol. 78:126–132. [DOI] [PMC free article] [PubMed] [Google Scholar]
- Picton TW. 1992. The P300 wave of the human event-related potential. J Clin Neurophysiol. 9:456–479. [DOI] [PubMed] [Google Scholar]
- Pineda JA, Foote SL, Neville HJ. 1989. Effects of locus coeruleus lesions on auditory, long-latency, event-related potentials in monkey. J Neurosci. 9:81–93. [DOI] [PMC free article] [PubMed] [Google Scholar]
- Polich J. 2007. Updating P300: an integrative theory of P3a and P3b. Clin Neurophysiol. 118:2128–2148. [DOI] [PMC free article] [PubMed] [Google Scholar]
- Polich J, Corey-Bloom J. 2005. Alzheimer’s disease and P300: review and evaluation of task and modality. Curr Alzheimer Res. 2:515–525. [DOI] [PubMed] [Google Scholar]
- Rajkowski J, Kubiak P, Aston-Jones G. 1994. Locus coeruleus activity in monkey: phasic and tonic changes are associated with altered vigilance. Brain Res Bull. 35:607–616. [DOI] [PubMed] [Google Scholar]
- Remijn GB, Hasuo E, Fujihira H, Morimoto S. 2014. An introduction to the measurement of auditory event-related potentials (ERPs). Acoustical Science And Technology. 35:229–242. [Google Scholar]
- Roger A, Rossi GF, Zirondoli A. 1956. Le rôle des afférences des nerfs crâniens dans le maintien de l’état vigile de la préparation “encéphale isolé”. Electroencephalogr Clin Neurophysiol. 8:1–13. [DOI] [PubMed] [Google Scholar]
- Saling LL, Phillips JG. 2007. Automatic behaviour: efficient not mindless. Brain Res Bull. 73:1–20. [DOI] [PubMed] [Google Scholar]
- Swick D, Pineda JA, Foote SL. 1994. Effects of systemic clonidine on auditory event-related potentials in squirrel monkeys. Brain Res Bull. 33:79–86. [DOI] [PubMed] [Google Scholar]
- Tramonti Fantozzi MP, De Cicco V, Barresi M, Cataldo E, Faraguna U, Bruschini L, Manzoni D. 2017. Short-term effects of chewing on task performance and task-induced mydriasis: trigeminal influence on the arousal systems. Front Neuroanat. 11:68. [DOI] [PMC free article] [PubMed] [Google Scholar]
- Tramonti Fantozzi MP, Diciotti S, Tessa C, Castagna B, Chiesa D, Barresi M, Ravenna G, Faraguna U, Vignali C, De Cicco V, et al. 2019. Unbalanced occlusion modifies the pattern of brain activity during execution of a finger to thumb motor task. Front Neurosci. 13:1–11. [DOI] [PMC free article] [PubMed] [Google Scholar]
- Tucha O, Mecklinger L, Maier K, Hammerl M, Lange KW. 2004. Chewing gum differentially affects aspects of attention in healthy subjects. Appetite. 42:327–329. [DOI] [PubMed] [Google Scholar]
- Usher M, Cohen JD, Servan-Schreiber D, Rajkowski J, Aston-Jones G. 1999. The role of locus coeruleus in the regulation of cognitive performance. Science. 283:549–554. [DOI] [PubMed] [Google Scholar]
- van Dinteren R, Arns M, Jongsma MLA, Kessels RPC. 2014. P300 development across the lifespan: a systematic review and meta-analysis. PLoS One. 9:1–13. [DOI] [PMC free article] [PubMed] [Google Scholar]
- Wang X-Y, Wu H-Y, Lu H-T, Huang T-T, Zhang H, Zhang T. 2017. Assessment of mismatch negativity and P300 response in patients with disorders of consciousness. Eur Rev Med Pharmacol Sci. 21:4896–4906. [PubMed] [Google Scholar]
- Waterhouse BD, Lin CS, Burne RA, Woodward DJ. 1983. The distribution of neocortical projection neurons in the locus coeruleus. J Comp Neurol. 217:418–431. [DOI] [PubMed] [Google Scholar]
- Wilson RS, Leurgans SE, Boyle PA, Schneider JA, Bennett DA. 2010. Neurodegenerative basis of age-related cognitive decline (e–pub ahead of print) (CME). Neurology. 75:1070–1078. [DOI] [PMC free article] [PubMed] [Google Scholar]
- Wu T, Chan P, Hallett M. 2008. Modifications of the interactions in the motor networks when a movement becomes automatic. J Physiol (Lond). 586:4295–4304. [DOI] [PMC free article] [PubMed] [Google Scholar]
- Yoshida A, Moritani M, Nagase Y, Bae YC. 2017. Projection and synaptic connectivity of trigeminal mesencephalic nucleus neurons controlling jaw reflexes. J Oral Sci. 59:177–182. [DOI] [PubMed] [Google Scholar]
- Zhang Y, Li R, Du J, Huo S, Hao J, Song W. 2017. Coherence in P300 as a predictor for the recovery from disorders of consciousness. Neurosci Lett. 653:332–336. [DOI] [PubMed] [Google Scholar]


