

Abstract
The increasing industrial and biomedical applications of nanomaterials have enhanced the need to educate a well-trained nanotechnology workforce. This need has led to efforts to introduce hands-on, nanotechnology-based, experimental modules into high school or college-level courses in science or engineering. However, the majority of such efforts have focused on nanoparticle synthesis techniques, and an equally important aspect of working with nanomaterials, i.e. nanoparticle characterization, has received less attention. Herein, we report a series of nanoparticle characterization experiments, as part of a newly developed “Nano and Biointerfaces” course, to familiarize upper undergraduate students as well as graduate students in chemical engineering with nanoparticle characterization techniques. An inquiry-based approach was used in that the composition and properties of nanoparticles were not revealed to the students beforehand and students were asked to perform experiments to characterize nanoparticle composition, size, morphology, and surface area. The results of these experiments were compared with certificates of analysis for particles, provided by the vendor, and the differences in measured properties were discussed. Assessment was performed through evaluation of laboratory memos and presentations, a question in the end of semester final exam, and a student survey. The modular nature of these experiments allows for them to be implemented, with modifications as needed, in other higher education institutions, or in high schools, to familiarize students with nanoparticle characterization.
Keywords: Upper division undergraduate, graduate level/research, Chemical engineering, Hands on learning/Manipulatives, Inquiry based/Discovery learning, Nanotechnology
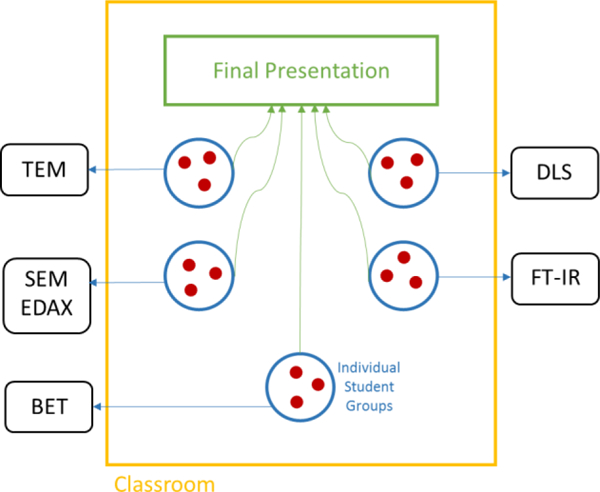
GRAPHICAL ABSTRACT
INTRODUCTION
The 21st century has witnessed the increasing incorporation of engineered nanomaterials into everyday life. Cosmetics, personal care, coatings, electronics, medical devices, and even food industry are now actively utilizing nanomaterials in their products.1, 2 In addition, nanomaterials are the subject of intense studies for biomedical applications such as imaging and drug delivery. The breadth of industries using nanomaterials in their processes has resulted in an increasing need for trained workforce. The number of nanotechnology jobs in the United States are expected to surpass 6 million by the year 2020.3 Thus, it is necessary to educate science and engineering students in working with nanomaterials to satisfy the current workforce needs. This is recognized by the ACS guidelines and evaluation procedures for bachelor’s degree programs, which has called on programs to provide students with training with regards to “the preparation, characterization, and physical properties” of systems including meso- or nanoscale materials.4
The need for increased student training in nanotechnology has led to the development of laboratory modules, from high school to graduate level, which provide hands-on training in working with nanomaterials. However, the majority of such experimental modules have been focused on nanoparticle synthesis,5–8 and an important aspect of working with nanomaterials, i.e. nanoparticle characterization, has received less attention. While familiarity with different methods of nanoparticle synthesis is undoubtedly valuable, a common challenge faced in the workforce, and in academic laboratories, is to delineate the physicochemical properties of nanoparticles that are not well characterized. Therefore, it is important that trainees have a basic foundation in working with different nanoparticle characterization techniques, understand how to analyze the data from each technique, and know what methods to choose depending on the property of interest.
An inquiry-based approach to experimental modules focused on nanoparticle characterization can be useful in providing students with hands-on familiarity with nanoscience. Inquiry-based approaches in undergraduate courses have been shown to improve students’ ability in scientific thinking9 and to make scientific research more inclusive.10 Nanoparticle characterization is commonly performed in academic research groups focused on nanotechnology. While some undergraduate students get the opportunity to participate in undergraduate research and learn about particle characterization techniques, an inquiry-based course project provides an opportunity for students who do not normally get such an opportunity to get hands-on experience with nanoparticle characterization.
Herein, a set of laboratory experiments, as part of a project in an upper-undergraduate and graduate level “Nano and Biointerfaces” course, is described with a focus on the characterization of engineered nanomaterials. The experiments were inquiry-based in that the composition and properties of nanoparticles were not revealed to the students beforehand and they were asked to perform the experiments, complete the analysis, and discover the answer. Nanoparticle characterization focused on size, charge, morphology, surface area, and surface functional groups. Assessment was performed by evaluating lab reports and presentations, testing the ability of students to choose appropriate characterization methods in the end of semester exam, and through a student self-evaluation survey. The proposed set of experiments require collaboration among several laboratories; however, they can be implemented in most higher education institutions and could be useful as part of courses focused on nanotechnology or as higher level materials or surface science courses.
EXPERIMENTAL METHODS
The experiments described below were performed twice, in two offerings of a newly developed, “Nano and Biointerfaces” course. In the first offering, 14 students (10 undergraduate, 4 graduate) and in the second offering 24 students (14 undergraduate, 10 graduate) were enrolled in the course. While experiments were performed in both course offerings, systematic student evaluations were performed in the second offering and are presented in this report. Experiments were assigned towards the end of the semester to ensure that there would be enough time to discuss all class topics and describe the basics for each instrument and the related data analysis techniques. For example, in a 15 week semester, experiments were assigned on week 10 and students were given until week 14 to complete the characterizations, with in-class presentations occurring on the last week. Note that students performed experiments outside the scheduled class time (i.e. no class sessions were dedicated to performing the experimental assignments). Students were divided in groups of two or three with a total of 10 groups in a class of 24 students. Groups were assigned to do characterization experiments using five different instruments (dynamic light scattering, scanning electron microscopy, transmission electron microscopy, BET surface area analysis, and Fourier Transform InfraRed spectroscopy), with two groups assigned to each instrument.
Materials
Amine-modified polystyrene particles (nominal diameter of 0.2 µm), sulfate-modified polystyrene particles (nominal diameter of 0.2 µm), and amine-modified silica nanoparticles (nominal diameter of 1 µm) were commercially procured and used for the experiments. Note that these diameters do not match the conventional definition of nanomaterials, which is used for materials with at least one dimension below 100 nm. However, the term “nanoparticle” has been used throughout the manuscript as the methods are applicable to characterization of nanomaterials and are in line with the learning goals of the “Nano and Biointefaces” course, which were focused on familiarizing students with the basics of nanotechnology.
Polystyrene particles were purchased from ThermoFisher (Waltham, MA) and silica particles were purchased from Micropspheres-Nanospheres (Cold Spring, NY). Aliquots of nanoparticles with different coatings, containing 100 µg of nanoparticles were made in Eppendorf tubes, centrifuged, lyophilized, and given to students as powders. Tubes were labeled only with numbers and their content was not revealed to the students. Each group of students, consisting of two to three members, was given a tube and was asked to perform a certain characterization experiment on the particles. Sample preparations were performed as per instructions for each instrument and the procedures were explained to the students prior to each experiment by the course teaching assistant or by instrument technicians. Whenever possible, students were asked to prepare the samples. This included particle sonication for DLS experiments, weighing and drying the samples for BET experiments, and making KBr pellets for FTIR experiments. Complicated sample preparation steps, such as sputter coating for SEM experiments, were performed by the instrument technician, along with a detailed description of all of the steps, while students were present. Following sample preparations, experiments and data analysis steps were performed by the students.
Dynamic Light Scattering
Nanoparticles were weighed and dispersed in deionized water to obtain a final concentration of 0.1 mg/mL. The suspension was sonicated in an ultrasonic bath for 20 minutes and transferred to a disposable cuvette. Size measurements were performed by dynamic light scattering, using a Malvern Zetasizer (Nano ZS, Malvern Instruments, UK). Average particle size was recorded and the polydispersity index (PDI), calculated based on cumulant analysis on autocorrelation function11, was monitored to be within the acceptable range (PDI<0.2).
Scanning Electron Microscopy and Energy-Dispersive X-ray Spectroscopy
To prepare samples for the scanning electron microscopy (SEM) experiments, a double-sided carbon tape was placed on an aluminum holder. A droplet of a dilute nanoparticle suspension in ethanol was placed on the tape and excess particles were removed with an air blower until a thin single layer of particles spread on the tape. The sample was then gold-coated for 1 minute in a coating chamber. Imaging was performed on with a JEOL JSM-6090 LV microscope (JEOL, Tokyo, Japan). The accelerating voltage and spot size was varied between 15 to 20 kV and 30 to 50 nm, respectively.
Transmission Electron Microscopy
Lyophilized particle samples were first crushed to obtain fine agglomerates. These agglomerates were then transferred into an ethanol solution and were completely dispersed using an ultrasonic bath. Few droplets of the suspension were placed on a Ted Pella Inc. (Redding, CA) carbon-coated TEM grid (carbon film on 200 mesh copper) and the grid was mounted on JEOL EM-21010/21020 single tilt sample holder. A JEM JEOL-2100F high-resolution transmission electron microscope (HRTEM) operated at 200 kV was used for imaging.
Fourier-Transform Infrared (FT-IR) Spectroscopy
FT-IR spectroscopy was performed on lyophilized particles. First, a narrow and transparent pellet was made with the KBr using a pellet press die. This pellet was run as a blank for the instrument. A small amount of the sample was then mixed thoroughly with KBr and a narrow pellet was made with the mixture. The new pellet was run as a sample in a Bruker Vertex 80 FT-IR spectrometer. The KBr used in the FT-IR experiments should be completely dry, therefore it was heated in an oven at 70℃ overnight prior to the experiments. Throughout the experiment, the working environment was saturated with nitrogen to ensure low humidity.
Brunauer–Emmett–Teller (BET)
BET analysis was performed using a Micromeritics TriStar II instrument (Micromeritics, Norcross, GA). Prior to the experiment, lyophilized particles were placed in test tubes and degassed at 333 K overnight to remove moisture. The mass of the particles was calculated by weighing the degassed tubes before and after loading the particles. For the experiment, the samples were exposed to discreet quantities of nitrogen at 77.4 K and the pressure after the gas reaches equilibrium was used to generate the BET plot. Using BET theory, the BET plot, and the mass of the sample, the specific surface area of the samples were calculated.
Hazards
All particles should be handled with care to prevent exposure. This requires the use of personal protective equipment including gloves, goggles, and masks when working with lyophilized particles. BET experiments are performed at low temperature and require the use of heat resistant gloves. In FT-IR experiments, laser safety precautions are needed and students should not stare directly into the laser or its reflection. Potassium bromide, used in FT-IR is an eye irritant and needs to be handled with gloves. SEM and TEM operations require caution due to the use of high voltage and high vacuum.
RESULTS AND DISCUSSION
Goals and Educational Objectives
Experiments were designed to address a number of educational objectives under two broad goals: 1) reinforce the topics introduced in the class and 2) increase confidence in using experimental techniques for nanoparticle characterization (Table 1). While students were introduced to the working principles of all equipment in class, they had not previously worked with any of the characterization equipment. Therefore, all experiments were performed under close supervision of a teaching assistant or laboratory technicians. Experiments were divided into multiple categories to provide information on various aspects of nanoparticle characterization. Hydrodynamic particle size was measured by DLS, particle dry size and morphology was evaluated by electron microscopy (SEM and TEM), particle surface area was measured using the BET adsorption method, and particle surface-functional group was characterized by FT-IR.
Table 1.
Learning goals and objectives of the project.
| i. Reinforce the topics discussed in class. |
| a. Describe why nanoparticle characterization is needed b. Name different nanoparticle characterization techniques c. Identify appropriate techniques depending on the property to be examined d. Describe the working theory of different nanoparticle characterization instruments |
| ii. Increase confidence in using experimental techniques for nanoparticle characterization. |
| a. Outline sample preparation steps for one characterization technique b. Describe post-processing analysis for one characterization technique c. Interpret the results for one characterization technique |
Nanoparticle Characterization Results
The hydrodynamic size of nanoparticles in water was characterized using dynamic light scattering (DLS). DLS utilizes fluctuations of the scattered light in a suspension of particles to determine particle diffusion coefficient and subsequently the hydrodynamic diameter of the particles. Prior to the start of the experiment, students suspended the particles in deionized water and placed the suspension in a sonication bath for 30 minutes. Note that the use of a probe sonicator might be needed if bath sonicaton is not capable of redispersing the particles. The results of the DLS experiments showed size values that were close to the nominal diameter (see e.g. Fig. 1 for 200 nm polystyrene particles). While DLS data do not require much post-analysis, all students performing DLS experiments were asked to report the decay function for their particles, to ensure the quality of results, and use the Stokes-Einstein equation and to find the diffusion coefficient of particles in water.
Figure 1.

Example student data for dynamic light scattering (DLS) characterization of sulfate-modified polystyrene nanoparticles (nominal diameter 200 nm).
The dry size and morphology of particles were investigated using SEM and TEM. For these experiments, students worked in close contact with laboratory technicians to prepare samples and acquire images. In electron microscopy a beam of high energy electrons is used rather than the beam of visible light, which is used in normal microscopy. This feature gives electron microscopes the ability to image the structure of small objects with a higher resolution compared to light microscopes. An example of TEM images with 1 µm amine-modified silica particles as sample, is provided in Fig. 2. Students were asked to use the ImageJ software,12 analyze the size of at least 100 particles, and report the data as average diameter ± standard deviation. Interestingly, in some cases the particle size inferred from the images did not match the values reported by the vendor. For example for the 1 µm silica particles shown in Fig. 2 a value of 587 ± 32 nm was reported by the students. This led to in-class discussions on the need for particle characterization and why a user should always plan to perform particle characterization even if nominal values or certificates of analysis are available from the vendor.
Figure 2.
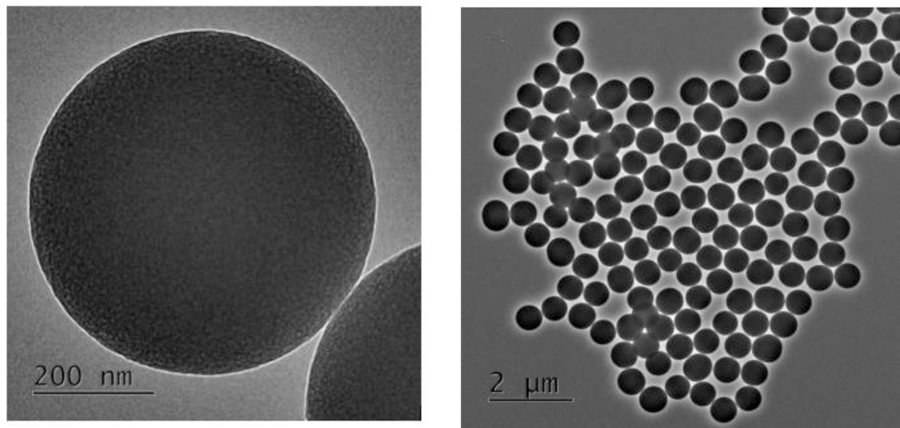
Example student data for TEM characterization of amine-modified silica nanoparticles (nominal diameter: 1 µm) at A) high- and B) low-magnification.
Particle surface area analysis was performed using the BET adsorption method. BET theory relates the ratio of the equilibrium pressure and the pressure at which the sample surface is saturated to calculate the monolayer adsorption capacity of a surface, which can in turn be used to calculate the total surface area.13 For these experiments, students heated the samples overnight, to remove moisture, and performed the adsorption experiment on the following day. All students were able to get a linear plot for relative pressure (P/P0) vs. P/V(P-P0) as expected for BET plots in the P/P0 range of less than 0.3 (Fig. 3). However, the actual surface area reported by the students for the particles showed differences from the expected value. For example, the particles shown in Fig. 3, a surface area of 26 m2/g was reported by the vendor while students reported a value of 33.8 ± 0.8 m2/g. This unexpected result gave an opportunity to discuss potential reasons for such deviations. The theoretical surface area of the particles, based on particle diameters estimated from TEM images, was calculated in class and was close to the surface area reported by the vendor. It was noted that surface area values larger than the expected number cannot have been caused by particle aggregation, as aggregation would be expected to reduce the surface area. It was then suggested that the amount of lyophilized particles might not have been enough for the measurements to be performed successfully. This was tied back to one of the drawbacks of using the BET method, the fact that BET instruments generally require a large amount of lyophilized particles for the measurements to be reliable.
Figure 3.

Example student data for BET surface area analysis for amine-modified polystyrene nanoparticles (nominal diameter 200 nm).
The surface functional groups on the surface of nanoparticles were determined using FTIR experiments. FTIR measures absorption or emission of a sample over the infrared spectrum. The peaks in the spectrum can be compared to the spectrum of known structures for obtaining the type of the bonds that exist in the sample. These experiments were assigned to graduate students given the need to search the literature for the fingerprints of various chemical groups. Some information was shared with the students to make this task easier to accomplish. For example, a group focused on the analysis of amine-modified polystyrene nanoparticles and it was shared with them that they can expect a large amount of nitrogen and carbon double bonds. This group reported the potential structure of the core particle as toluene, which was very close to the structure of polystyrene, but were not able to correctly guess the surface functional group. The result from this group’s work is demonstrated in Fig. 4. These results were discussed in-class and it was noted that in most cases, characterization is performed as part of a project and other information, in addition to the surface functional groups identified by FTIR, can generally be used to make conclusions regarding the final chemical structure of the particles of interest.
Figure 4.

Example student data for FT-IR characterization of amine-modified polystyrene nanoparticles (nominal diameter 200 nm). Note that the approximate structure given by the students (toluene) is close to the actual structure (styrene), but is incorrect.
Following the completion of experiments, students were asked to prepare a short presentation and a short memo, with appendices as needed, to report their findings. Following all in-class presentations, the certificate of analysis for each particle was shown by the instructor and differences between the acquired data and those reported by the vendor were pointed out and discussed.
Assessment
Assessment was performed through 1) evaluation of student laboratory reports and presentations, 2) a question in the end of semester final exam, and 3) student self-evaluation through a survey. All student groups were able to receive a score of 95 or higher (out of 100) in the evaluation of laboratory reports and presentations. While this suggested a very good understanding of the working principles for the instruments and the analysis involved, the grade might have been inflated due to the tendency of the students to interact closely with the instructor and ensure the correctness of their analysis prior to the presentations and submissions.
The final exam also contained a question with regard to particle characterization techniques (presented in Supporting Information). This question revealed satisfactory results with 56% of the students receiving a score of 90% or higher and 74% a score of 80% or higher in this question. Finally, student self-evaluation through a questionnaire (presented in Supporting Information) revealed further insight into the effectiveness of the experimental modules (Figure 5). Students reported a high level of confidence in understanding and interpreting the results from each technique. However, students were less confident in identifying the appropriate technique for characterizing a nanoparticle property of interest. Since each group of students were asked to characterize nanoparticles using only one technique, having a less holistic understanding of what technique to select to characterize a nanoparticle property of interest is not surprising. This issue can be addressed by more in depth discussions, questions, and examples in the classroom. Students were also less confident in sample preparation steps for each instrument. This was somewhat expected given that the sample preparation steps for some techniques, e.g. electron microscopy, have multiple steps and their mastery requires time and practice.
Figure 5.
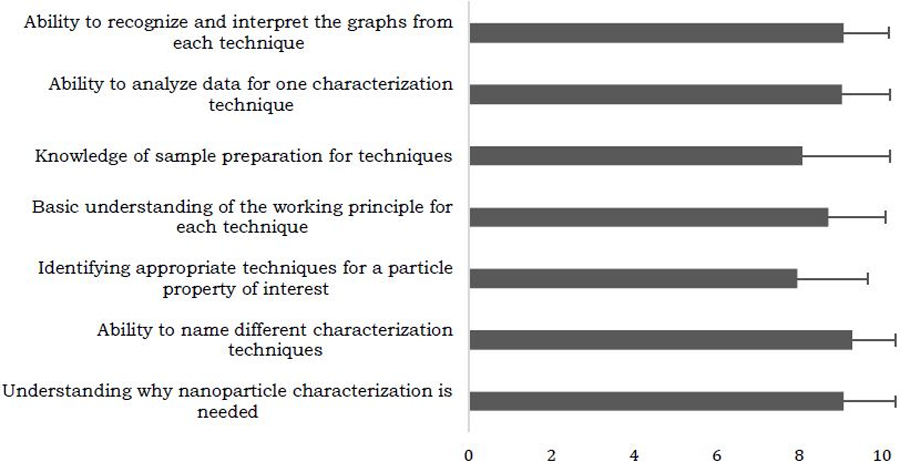
Summary of student self-evaluation survey with the score of 10 denoting “highly confident” and score of 1 denoting “not confident at all”.
Given that the instrumentation needed for the experiments in this project were spread across the Ohio University campus, it was not possible to provide a theoretical background for each instrument immediately before each experiment. However, the working principles behind each instrument were discussed in the course and students started the experiments having already received this information. In general, students enjoyed the hands-on component and showed enthusiasm for the experiments. Students also enjoyed being able to see the certificate of analysis provided by the vendor for each particle after the completion of the experiments, particularly given the fact that in most cases the results of the experiments closely matched the values reported by vendors.
This set of experiments was selected to be included as part of a newly developed “Nano and Biointerfaces” course. However, these experiments could be incorporated into other courses and the instrumentations needed for the experiments are available in most higher education institutions. However, such instrumentation might not all be accessible in one building, as was the case here, which enhances the need for planning and coordination. Experiments can be modified to incorporate other types of nanoparticles such as gold and silver as they have characteristics that can be analyzed using less expensive and more accessible instruments. In this regard, experiments with instruments such as UV-Visible spectrometer, which can reveal particle size based on the dependence of optical properties on particle size and aggregation state,14, 15 or dark field microscopy, which can detect scattered light from nanoparticles,16, 17 can be implemented for rapid evaluation of particle properties. Such instruments are generally more available than DLS and electron microscopes and can be particularly useful in lower level undergraduate courses or in high schools.
Experiments can also be modified to incorporate other instruments that might be more accessible or be scaled down for use in lower level undergraduate courses or in high schools. Further experiments with characterized nanoparticles, for example studies on their toxicity to mammalian cells and how toxicity varies based on particle properties, can also be incorporated to educate students on environmental and biological interactions of nanomaterials. The overall activity can also be further strengthened by providing the students with the ability to provide feedback to their teammates, for example using the online evaluation tool CATME,18 to help students enhance their team-work skills using the provided feedback. These possibilities will be considered for future offerings of the course.
CONCLUSION
With the increasing incorporation of nanotechnology into the science and engineering curriculum, innovative approaches have been used to add laboratory components to coursework. While other topics such as nanoparticle dose quantification,19 interfacial properties,20, 21 and interactions with the environment,22, 23 are starting to gain momentum, many of the current approaches are still focused on nanoparticle synthesis. The proposed set of experiments, as part of a newly developed “Nano and Biointerfaces” course focused on another, equally important, aspect of nanotechnology by familiarizing students with nanoparticle characterization techniques and the required analysis after each experiments. This set of experiments, with modifications as needed, could be applied in other institutions, and as part of other courses, to provide students with hands on experience in nanoparticle characterization.
Supplementary Material
ACKNOWLEDGMENTS
This work was supported by the National Institute of Health (grant R15ES030140) to AF. Support from the Russ College of Engineering and Technology and the Department of Chemical and Biomolecular Engineering at Ohio University, as well as the Ohio University Foundation Board of Trustees 1804 Fund is also gratefully acknowledged.
Footnotes
ASSOCIATED CONTENT
Supporting Information
Student handout, final exam question used to assess students, questionnaire for student self-evaluation, and instructor notes (including list of particles, list of instruments, sample preparation, troubleshooting and tips, and other considerations).
REFERENCES
- 1.Baalousha M; Yang Y; Vance ME; Colman BP; McNeal S; Xu J; Blaszczak J; Steele M; Bernhardt E; Hochella MF, Outdoor urban nanomaterials: the emergence of a new, integrated, and critical field of study. Sci .Total Environ 2016, 557, 740–753. [DOI] [PubMed] [Google Scholar]
- 2.Vance ME; Kuiken T; Vejerano EP; McGinnis SP; Hochella MF Jr; Rejeski D; Hull MS, Nanotechnology in the real world: Redeveloping the nanomaterial consumer products inventory. Beilstein J. Nanotechnol 2015, 6 (1), 1769–1780. [DOI] [PMC free article] [PubMed] [Google Scholar]
- 3.Roco MC; Mirkin CA; Hersam MC, Nanotechnology research directions for societal needs in 2020: summary of international study Springer: 2011. [Google Scholar]
- 4.American Chemical Society Committee on Professional Training, ACS Guidelines and Evaluation Procedures for Bachelor’s Degree Programs American Chemical Society; Washington, DC: 2015. [Google Scholar]
- 5.Cooke J; Hebert D; Kelly JA, Sweet nanochemistry: a fast, reliable alternative synthesis of yellow colloidal silver nanoparticles using benign reagents. J. Chem. Edu 2014, 92 (2), 345–349. [Google Scholar]
- 6.Dalverny A-L; Leyral G; Rouessac F; Bernaud L; Filhol J-S, Synthesizing and Playing with Magnetic Nanoparticles: A Comprehensive Approach to Amazing Magnetic Materials. J. Chem. Edu 2017, 95 (1), 121–125. [Google Scholar]
- 7.Jenkins JA; Wax TJ; Zhao J, Seed-Mediated Synthesis of Gold Nanoparticles of Controlled Sizes To Demonstrate the Impact of Size on Optical Properties. J. Chem. Edu 2017, 94 (8), 1090–1093. [Google Scholar]
- 8.Dziedzic RM; Gillian-Daniel AL; Petersen GM; Martínez-Hernández KJ, Microwave synthesis of zinc hydroxy sulfate nanoplates and zinc oxide nanorods in the classroom. J. Chem. Edu 2014, 91 (10), 1710–1714. [Google Scholar]
- 9.Brownell SE; Hekmat-Scafe DS; Singla V; Chandler Seawell P; Conklin Imam JF; Eddy SL; Stearns T; Cyert MS, A high-enrollment course-based undergraduate research experience improves student conceptions of scientific thinking and ability to interpret data. CBE—Life Sci. Edu 2015, 14 (2), ar21. [DOI] [PMC free article] [PubMed] [Google Scholar]
- 10.Bangera G; Brownell SE, Course-based undergraduate research experiences can make scientific research more inclusive. CBE—Life Sci. Edu 2014, 13 (4), 602–606. [DOI] [PMC free article] [PubMed] [Google Scholar]
- 11.Frisken BJ, Revisiting the method of cumulants for the analysis of dynamic light-scattering data. Appl. opt 2001, 40 (24), 4087–4091. [DOI] [PubMed] [Google Scholar]
- 12.Abràmoff MD; Magalhães PJ; Ram SJ, Image processing with ImageJ. Biophotonics Intern 2004, 11 (7), 36–42. [Google Scholar]
- 13.Brunauer S; Emmett PH; Teller E, Adsorption of gases in multimolecular layers. J. Am. Chem. Soc 1938, 60 (2), 309–319. [Google Scholar]
- 14.Haiss W; Thanh NT; Aveyard J; Fernig DG, Determination of size and concentration of gold nanoparticles from UV− Vis spectra. Anal. Chem 2007, 79 (11), 4215–4221. [DOI] [PubMed] [Google Scholar]
- 15.Amendola V; Meneghetti M, Size evaluation of gold nanoparticles by UV− vis spectroscopy. J. Phys. Chem. C 2009, 113 (11), 4277–4285. [Google Scholar]
- 16.Bu T; Zako T; Fujita M; Maeda M, Detection of DNA induced gold nanoparticle aggregation with dark field imaging. Chem. Commun 2013, 49 (68), 7531–7533. [DOI] [PubMed] [Google Scholar]
- 17.Li T; Wu X; Liu F; Li N, Analytical methods based on the light-scattering of plasmonic nanoparticles at the single particle level with dark-field microscopy imaging. Analyst 2017, 142 (2), 248–256. [DOI] [PubMed] [Google Scholar]
- 18.Loughry ML; Ohland MW; Woehr DJ, Assessing teamwork skills for assurance of learning using CATME team tools. J. Mark. Edu 2014, 36 (1), 5–19. [Google Scholar]
- 19.Campos AR; Knutson CM; Knutson TR; Mozzetti AR; Haynes CL; Penn RL, Quantifying gold nanoparticle concentration in a dietary supplement using smartphone colorimetry and google applications. J. Chem. Edu 2015, 93 (2), 318–321. [Google Scholar]
- 20.Karunanayake AG; Gunatilake SR; Ameer FS; Gadogbe M; Smith L; Mlsna D; Zhang D, Undergraduate Laboratory Experiment Modules for Probing Gold Nanoparticle Interfacial Phenomena. J. Chem. Edu 2015, 92 (11), 1924–1927. [Google Scholar]
- 21.Yin D; Chen J; Gu B; Geng W, Investigating the Phase Inversion of Pickering Emulsions: An Experiment To Explore Colloid and Interface Chemistry Concepts. J. Chem. Edu 2018, 95 (4), 662–665. [Google Scholar]
- 22.Amaris ZN; Freitas DN; Mac K; Gerner KT; Nameth C; Wheeler KE, Nanoparticle synthesis, characterization, and ecotoxicity: A research-based set of laboratory experiments for a general chemistry course. J. Chem. Edu 2017, 94 (12), 1939–1945. [Google Scholar]
- 23.Metz KM; Sanders SE; Miller AK; French KR, Uptake and Impact of Silver Nanoparticles on Brassica rapa: An Environmental Nanoscience Laboratory Sequence for a Nonmajors Course. J. Chem. Edu 2013, 91 (2), 264–268. [Google Scholar]
Associated Data
This section collects any data citations, data availability statements, or supplementary materials included in this article.